Journal of Chemical and Pharmaceutical Research, 2014, 6(11):319-325
Research Article
CODEN(USA) : JCPRC5
ISSN : 0975-7384
Development of validated RP-HPLC-PDA method for the analysis of
Capecitabine in bulk, dosage forms and in dissolution samples
A. Karthik, K. Vasantha, G. Lakshmi Suneetha, M. Sai Sree and Buchi N. Nalluri*
Department of Pharmaceutics, KVSR Siddhartha College of Pharmaceutical Sciences, Vijayawada, AP, India
_____________________________________________________________________________________________
ABSTRACT
The present study was aimed at developing a simple, specific, efficient and sensitive RP-HPLC-PDA method for the estimation of capecitabine in bulk, dosage forms and in vitro in dissolution samples. Separation was carried out on Phenomenex C18 reverse phase column (250× 4.6mm, 5 µm) employing a mobile phase consisting of 15mM
Ammonium acetate: methanol (35:65 v/v) at flow rate of 1mL/min and UV detection at 240nm. The retention time of capecitabine was 6.7 min. The linearity was achieved over a concentration range of 2-10µg/mL (R2 =0.999), the limit of detection and limit of quantification were 0.065µg/mL and 0.195µg/mL respectively. The method was validated for parameters like accuracy, precision, assay, linearity, specificity, stability and robustness. Validation acceptance criteria were met in all the cases. The proposed method can be used for the determination of capecitabine and monitoring its concentration in in vitro dissolution studies.
Key words: Capecitabine, dissolution, method validation, RP-HPLC.
_____________________________________________________________________________________________
INTRODUCTION
Capecitabine (CPT), chemically is 5'-deoxy-5-fluro-N [(pentoxy) carbonyl] cytidine [1]. It is an orally administrated chemotherapeutic agent used in the treatment of megaloblastic and collateral cancer. CPT is a pro-drug that is selectively tumor-activated to its cytotoxic moiety (fluorouracil), by thymidine phosphorylase, an enzyme found in higher concentrations in many tumors compared to normal tissues or plasma. The activation of CPT follows a path way with three enzymatic steps and two intermediate metabolites 5'-deoxy-5-fluro cytidine (5'-DFCR), 5’- deoxey-5-fluro uridine (5'1DFUR), deoxey-5-flurouracil (active form) [2].
Literature survey revivals few reported LC-MS-MS methods for the determination of a CPT in biological fluids [3,4] , spectroscopic methods in combination with the other drugs [5] and few methods by RP-HPLC in tablet formulation [6-11]. However, there was no validated RP-HPLC-PDA method reported so far for the estimation of CPT in dissolution samples. Dissolution test has emerged as a very important tool for the characterization of the performance of a drug product in the pharmaceutical field. It is a regular quality control procedure in good manufacturing practice.
EXPERIMENTAL SECTION
Chemicals
CPT was gift sample from Hetero Drugs Ltd., India. Ammonium acetate, water and methanol were purchased from
E. Merck, Mumbai, India. All the solvents and reagents were of HPLC grade. CPT tablets [CAPNAT® containing
500mg of CPT (B. No. 600833)] were purchased from local pharmacy.
Equipment
A Shimadzu Prominence HPLC system provided with DGU-20A3 degasser, LC-20AD binary pumps, SIL-20AHT auto sampler, and SPD-M20A PDA detector was used. All the data was processed using LC solutions software. The
chromatographic analysis was performed on Phenomenex C18- RP column (250 × 4.6mm, 5µ m).
Chromatographic Conditions
Mobile phase consisting of 15mM ammonium acetate: methanol (35:65 v/v) was used in isocratic mode and the mobile phase was filtered through membrane filter of 0.45µ m (Millipore) and pumped from the respective solvent reservoir at a flow rate of 1 mL/min and the injection volume was 20µL. PDA detection was performed at 240 nm and the separation was achieved at ambient temperature.
Preparation of stock and standard solutions
10mg of CPT was accurately weighed, transferred into a clean dry volumetric flask, dissolved in 5 mL of water. The volume was adjusted to the mark with the water in a 10mL volumetric flask. An appropriate volume of the stock solution was then further diluted with water to get the required concentrations of standard solutions in a concentration range of 2-10µg/mL.
Validation of the HPLC method
The method was validated according to the ICH guidelines [12]. The parameters were summarised below.
Specificity
The specificity of the method is its ability to assess the analytes in the presence of other components. The overlay of diluent, placebo, standard and sample were presented in Figure 2. The retention times of drug substance and the drug product were observed.
Linearity
Standard calibration curves were prepared with six standard over the CPT concentration range of 2-10 µg/mL (2, 4,
6, 8, 10µg/mL), with triplicate determination at each level. The data of peak area vs. drug concentration were treated
with linear least square regression analysis. Values of the slope, the intercept and the coefficient of regression for the calibration curve of CPT were given in Table-1. The high value of the coefficient of regression indicated good linearity.
Precision
The precision of an analytical procedure expresses the closeness of agreement (degree of scatter) between a series of measurements obtained from multiple sampling of the same homogeneous sample under the prescribed conditions. The determination of CPT was replicated six times under the same operating conditions over a short period of time. The standard deviation and the relative standard deviation were reported for precision. Less than 2 RSD (%) for peak areas indicates the precision of the developed method and the data was presented in Table-1.
Accuracy
To study the reliability and accuracy of the method , recovery studies were carried out by spiking 80%, 100% and 120% of CPT standard to the drug product samples. Samples were injected in triplicate across its range. The percentage recovery and the RSD(%) were calculated at each level of addition and the data was given in Table-1.
Limit of Detection (LOD) and Limit of Quantification (LOQ)
The LOD and LOQ values were determined by the formulae LOD = (3.3×σ)/m and LOQ = (10×σ)/m (Where, σ is
the standard deviation of the responses and m is mean of the slopes of the calibration curves).
Robustness
______________________________________________________________________________
Assay
Twenty tablets were weighed and finely powdered. A powder quantity equivalent to 10 mg CPT was accurately weighed and transferred to a 10 mL volumetric flask. 5 mL of water was added to the same. The flask was sonicated for 5 min and volume was made up to the mark with water. The above solution was filtered using Nylon disposable syringe filter (13 mm, 0.45 µm) and the filtrate was diluted with diluent (water) so as to obtain a concentration in the range of 2-10 µg/mL as discussed above. The amount present in the each tablet was calculated by comparing the area of standard CPT with that of the tablet sample.
Dissolution analysis
Marketed tablets were subjected to in vitro drug release studies in distilled water for 1 hour to access the ability of the formulation for providing immediate drug delivery. Drug release studies were carried out in eight stage dissolution test apparatus (LAB INDIA DS 8000, Mumbai, India) using specified volume of dissolution media (900 mL) maintained at 37±0.5ºC and the paddles were adjusted at 50 rpm speed. 5mL of the samples were withdrawn from the dissolution medium at each time interval (5, 10, 15, 20, 30, 45 and 60 minutes) and 5 mL of fresh medium was replaced each time. Removed samples were filtered through a nylon filter (0.45µ m), suitably diluted and analyzed using the above developed RP-HPLC method. The % release of CPT in the test samples was calculated by comparing peak area of the test samples with the peak area of the standard.
Filter Compatibility Study
Dissolution samples were checked for compatibility with both the nylon filter (0.45µ m) and Polyvinylidene Difluoride (PVDF) filters (0.45µ m). CPT standard in dissolution medium was prepared and the solution was filtered through the filters. Both the filtered and unfiltered standard samples were injected and chromatograms were observed.
RESULTS AND DISCUSSION
The RP-HPLC-PDA procedure was optimized with a view to develop a rapid and accurate analytical method for the quantification of CPT in bulk, dosage forms and in dissolution samples. A Phenomenex C18 RP aqueous column
(250 × 4.6mm, 5µ m) in isocratic mode, with mobile phase15mM ammonium acetate: methanol (35:65 v/v) was used. The flow rate was 1ml/min and using water as diluent, the sample was injected which produced a sharp peak with tailing factor within the limits. The peak was eluted with in 10min run time and the retention time was 6.73min for CPT. For quantitative analytical purpose wavelength was set at 240nm, which provided better reproducibility with minimum or no interference. The method was validated as per ICH guidelines. The peak purity index was found to be greater than 0.9999 and this indicates the peak purity of the drug sample used in the analysis which is represented in Figure-1 along with UV spectra.
Method validation
The method has been validated as per ICH-Guidelines for the following parameters.
Linearity
A linear relationship was evaluated across the range (2-10 µg/mL) of the analytical procedure in triplicate. The range of concentrations was selected based on 80-120 % of the test concentration. Peak area and concentrations were subjected to least square regression analysis to calculate regression equation. The correlation coefficient (R) was found to be 0.999 indicating a linear response over the range used. Slope and Y-intercept of the calibration curve was given in Table-1.
Precision
Precision studies were carried out in terms of repeatability. Repeatability of standard application was assessed by using six replicates of concentration at 10µg/mL level and the data was given in Table 1. The % RSD was found to be below 2 for peak areas, this shows the closeness of the data values to each other, indicating the precision of the method.
Specificity
0.0 1.0 2.0 3.0 4.0 5.0 6.0 7.0 8.0 9.0 m in -40 -30 -20 -10 0 10 20 30 40 m AU
240nm ,4nm (1.00)
6
.7
3
3
6.50 6.55 6.60 6.65 6.70 6.75 6.80 6.85 6.90 6.95 min
-0.001 0.000 0.001 0.002 0.003 0.004 0.005 0.0 5.0 10.0 15.0 20.0 25.0 30.0 35.0 40.0 45.0 50.0 mAU Peak Zero Line Purity Curve
200.0 225.0 250.0 275.0 300.0 325.0 350.0 375.0 nm
0.0 2.5 5.0 7.5 10.0 12.5 15.0 17.5 20.0 m AU
6.71/ 1.00/smth/sm th
2 4 0 2 1 6 3 0 5
Figure 1: A - Chromatogram of CPT (10 µg/mL) B - Peak purity index of CPT and C – UV Spectrum of CPT
0.0 1.0 2.0 3.0 4.0 5.0 6.0 7.0 8.0 9.0 min
[image:4.595.168.447.438.611.2]-50000 0 50000 100000 150000 uV
Figure 2: Overlay of the A)Diluent, B) Placebo, C) Standard and D) Sample of CPT chromatograms
Accuracy
Accuracy of the method was examined by performing recovery studies by standard addition method by spiking the known quantities of the standard at 80, 100, 120% to the drug product solution of 4µg/mL and these solutions were analyzed in triplicate in each level of addition. The percent recovery of the added standard to the drug product sample was calculated and it was found to be 99.9-102.1 and the percent RSD was less than 2, which indicated a
good accuracy of the method. The obtained recovery results were given in Table –1.
A
B
C
______________________________________________________________________________
Table. 1: Linearity, Precision and Accuracy data of CPT
Validation data of CPT
Linearity (n=3)
Range 2-10 µg/mL y =39781x-22401
R=0.999 R2=0.997
Precision (n=6)
Average peak area of the standard sample (RSD)
367815 (0.401)
Accuracy (n=3)
Percent Level of addition Mean Percent Recovery (RSD)
80 99.96 (0.351)
100.6 (0.433) 102.1 (1.028)
100 120
Limit of Detection (LOD) and Limit of Quantification (LOQ)
LOD and LOQ were determined based on statistical calculation from the calibration curves, where LOD = (3.3
×σ)/m; LOQ= (10.0×σ)/m (σ is the standard deviation of the y-intercepts of the three regression lines and m is mean
of the slopes of the three calibration curves). The limit of detection for CPT was found to be 0.065µg/mL, the drug
peak could be detected without any base line disturbances at this concentration. The limit of quantification for CPT
was found to be 0.197 µg/mL.
Assay
Assay of CPT tablets was performed by the proposed method and the percent assay of the formulation was calculated as an average of three determinations, which was about 110.72 ± 0.057. These results indicate that the present RP-HPLC-PDA method can be successfully used for the assay of CPT in bulk and dosage forms.
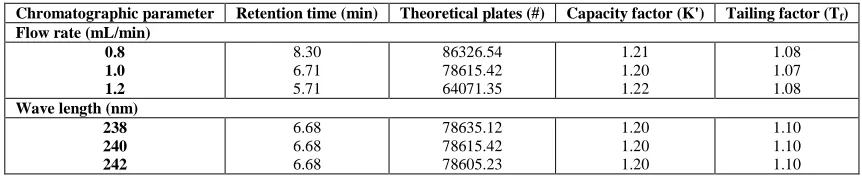
Robustness
Robustness of the method was determined by making slight changes in the chromatographic conditions, such as change in, flow rate and wavelength. It was observed that there were no marked changes in the chromatograms, which demonstrated that the RP-HPLC-PDA method developed is robust. The robustness limits for flow rate variation, and wave length variation were well within the limit. By altering the flow rate and wavelength, it was assured that the proposed method was unaffected by small variations in method parameters. The results were given in Table-2.
Table. 2: Robustness data for CPT
Chromatographic parameter Retention time (min) Theoretical plates (#) Capacity factor (K') Tailing factor (Tf)
Flow rate (mL/min) 0.8 1.0 1.2 8.30 6.71 5.71 86326.54 78615.42 64071.35 1.21 1.20 1.22 1.08 1.07 1.08
Wave length (nm) 238 240 242 6.68 6.68 6.68 78635.12 78615.42 78605.23 1.20 1.20 1.20 1.10 1.10 1.10 System suitability
System suitability testing is an integral part of the analytical procedure. System suitability studies were carried out
by injecting five times a 10µg/mL standard concentration of CPT at different injection volumes ranging from 10µL
to 50µL. The RSD (%) values for system suitability parameters like retention time, tailing factor and theoretical plate number were less than 2 indicating the present conditions were suitable for the analysis of CPT in tablets. System suitability test data was given in Table-3.
Table. 3: System suitability parameters
Parameters CPT (RSD)
Retention Time (min) 6.73 (0.41)
Tailing Factor (Tf) 1.10 (0.53)
Theoretical Plate Number(#) 81934.12 (1.15)
Stability of the analytical solution
[image:5.595.90.521.466.555.2]found to be less than 2 when compared with the initial zero time interval solution, thus indicating that the solutions were stable for a period of 7 days when stored at 8°C.
Filter compatibility study
Compatibility of 0.45µm nylon filter and Polyvinylidene Difluoride (PVDF) filters (0.45µm) were studied. Standard sample solution and dissolution samples were filtered and analysed and the variation in the assay value was calculated. After the analysis it was found that nylon filters were suitable for filtration.
Dissolution analysis of the marketed product
The above validated method was used for the in-vitro dissolution analysis of CPT tablets. The percent drug release was within in the limits of NLT 85% of the labelled amount of CPT dissolved in 45min, assuring that the developed method can be successfully applied for the routine in-vitro dissolution sample analysis of CPT. The dissolution profile was presented in Figure-3.
Figure. 3: Dissolution profile of marketed Capecitabine tablet
CONCLUSION
In this study, a rapid and an efficient RP-HPLC-PDA method was developed for the analysis of CPT in bulk, dosage forms and in dissolution samples. This method was validated according to International Conference on Harmonisation (ICH) Guidelines, and found to be appropriate for routine quality control analysis for the estimation of CPT in tablets and in dissolution samples using isocratic mode of elution. The results of linearity, precision, accuracy and specificity, were demonstrated to be within the limits. The method provides selective quantification of CPT without interference from diluents and placebo. By this method, using compendial dissolution conditions, it was possible to accurately estimate the amount of CPT in dissolution samples without any additional pre-treatment. Therefore, this method can be employed in quality control to estimate the amount of CPT in bulk, dosage forms and in analysis of dissolution samples of marketed CPT tablets.
Acknowledgements
The authors are thankful to Hetero Drugs Ltd, India for providing gift sample and also to the Siddhartha Academy of General and Technical Education, Vijayawada, for providing facilities to carry out the research work.
REFERENCES
[1] Indian Pharmacopoeia, 6th Edition, The Indian Pharmacopoeia Commission, Ghaziabad, 2010; 973.
[2]HP Rang; MM Dale; JM Ritter; RJ Flower; G Henderson. Rang and Dale’s Pharmacology, 7th Edition, Elsevier
Churchill Livingstone, Elsevier Inc., Spain, 2012; 681.
[3]D Montange; M Bérard; M Demarchi; P Muret; S Piédoux; JP Kantelip. B Roye. J Mass Spectroscopy, 2010, 45(6), 670-677.
[4]A Salvodar; L Millerious; A Raenou. Chromatographia, 2006, 63(11-12), 609-675.
[5]M Kishore; M Jayaprakash; RT Vijaya bhaskar. Int. J. chem. Tech. Res., 2011, 3(1), 63-69.
[6]S Jayaselean; SK Bajibali; U Ramesh. Int. J. chem. Tech. Res., 2010, 2(4), 2086-2090.
[7]RT Karnakar; KS Sravan; RY Ravindra. J. Pharm. Res., 2011, 4(1), 256-258.
______________________________________________________________________________
[9]V Rajesh; V Anupama; V Jagathi; S Praveen. E-J. Chem., 2011, 8(3), 2012-2017.
[10]AD Phani kumar; RY Venkata; G Sunitha; K Ramakrishna; M Ceema; RA Venkateswara. Int. J. Res. Pharm.
Biomed. Sci., 2011, 2(1), 175-181.
[11]S Vijayanthi; B Thangabalan; K Ramalingam. J. Pharm. Res., 2012, 5(5), 2834-2836.
[12]International Conference on Harmonization of Technical Requirements for Registration of Pharmaceuticals for