*
.
-4ppliedAdecl7mzics andA4uterinls Val. 510 (2014) pp 185-192 5 (2014) Trm~nw Tech Publications, Switzerladdoi: 10.4028/1+~w~~.sciertt1fic.1~et~&.LnL 510.185
The Influence of Electrical Resistivity Array
on
its
Soil
Electrical
Resistivity Value
Mohd Hazreek
Zainal
bidi in'^*^^,
Rosli
saad21b,
Devapriya Chitmi
~ i j e y e s e k e r a ~ l ~ , ~ ,
Fauziah
~ h r n a d ~ . ~ ,
Nut-
Azwin
~ s r n a i l ~ ~ ~
1Department of Infrastructure and Geomatic Engineering, Facuky of Civil and Environmental Engineering, Clniversiti Tun Hussein Onn Malaysia, Johor MALAYSIA
2
Geophysics Section, School of Physics, Universiti Sains Malaysia, Pulau Pinang MALAYSIA
3
Research Center for Soft Soil, Universiti Tun Hussein 6nn Malaysia, Johor MALAYSIA
4
School of Civil Engineering, Universiti Sains Malaysia, Nibong Tebal MALAYSLA
5 ~ ~ a o l of Architecture, Computing and Engineering, University of East London, London ENGLAND
Keywords: Soil electrical resistivity; Array, Dipole dipole; Pole dipole and moisture content.
Abstract. Electrical resistivity technique has become a popular alternative tool by the geotechmical
engineers in subsurface investigation. This study presents the influence of soil electrical resistivity value (ERV) due to the different types sf electrical resistivity array used in practice. The dissiinilarity
of ERV was become a popular debate by the engineers which posses less fundamental knowledge in this area. In the past, the theory of electrical resistivity technique was less being discovered by the engineer which creates lots of black boxes during the utilization of electri~al resistivity method (ERM) in engineering purposes. Hence, the result which produced from the ERM was difficult to deliver in a sound of definitive ways due to lack of knowledge and experienced of most engineers. Hence, this study presents the influence of soil ERV due to the different types of array used with particular reference to as Dipole-dipole and Pole-dipole. A line of electrical resistivity imaging was performed on small embankment of sandy
and
lateritic soil with different types of array using A3EM SAS (4000) eq~tipment. Three in line of soil samples were tested for moisture content (IV) testimmediately after the electrical resistivity data acquisition was completely measured. Moreover, particle size distribution test also was perfomxxl for all s ~ i l samples in order to support the findings. It was fwnd that the ERV m7as never be the same for each types of array used even on the same
particular location of the survey lkc. However, it was found that there was a consistent relatio~~hip
between ERV and moisture content for both types of soil tested which can be represent by ERV m
Z/w. Hence, it was found that ERV produced was relative t~ the types of array used during the field measurement. Each types of army were applicable to be used in subsurface profiling and its selection was subjected to the target of interest.
Site investigation (SI) is a prelimina~y stage to the design and construction of any of civil engineering structure. According to [I], site investigation is the process in which geological, geotechnical and other relevant information which might affect the construction or perfor~nance of a civil engineering or building project are acquired. Commonly, SI works was performed using conventional drilling technique or other alternative technique such as geophysical method. Based on [I], the foremost classical geotechcal site investigation method for subsurface profile exploration is the application of
boring (light percussion drilling, power augering and washboring), drilling (rotary drilling and coring), probing (Mackintosh probe, dynamic probing) and examination in-situ (trial pitting, large bored shah, tunnel and h f t s ) . T l ~ e results from the conventional methods were produced exactly in a direct output due to its destructive method (drilling) thus producing a good parameter for design and
constmction purposes. However, the problems in most traditional boring and drilling method encounter when .the area of the investigatio~ was large which will illcrease the number of borehole thus increasing money and time of the project. Furthermore, the information obtained was a single point data and the interpolation between a large boreholes spacing can lead to illcrease the d e g t ~ e of uncertaiiIties of the subsurface profile investigated [2,3,4].
Hence, alternative technique such as geophysical method was required in order to compliment the conventional method w h h may reduce cost and time of SI wol-ks. Geophysical method consists of
several techniques such as resistivity, seismic, magnetic, gravity, ground penetration radar, etc, The basis of the geophysical method is qualitative studying of earth using physical properties such as electrical resistance, velocity, magnetic susceptibility, density, etc. Generally, geophysical techniques contributes several advantages for example, it can be implemented more quickly and less expensiveiy and has the ability to cover greater areas more thoroughly [5,6,3,7]. F~u-thennore, it provides a large-scale characterization of the physical properties under undisturbed conditions [3]. According to [I
1,
site damageability remains minimal and can be negligible alti~ough the resistivity method requires ground contact during the data acquisition. The process of geophysical technique starts from dab acquisition (field measurement for raw data collection), data processing (raw data analysis using utility software), and finally, result interpretation (anomaly outcome). In the past, the resistivitymethod was rwognized as a popular technique applied in engineering, ensironmental and
archaeology such as subsurface profile mapping in order to locate bedrock [a], boulder and cavity [9], groundwater resources [lo, 1 1 , 12,131 and contamination [ 141, [1 51, leachate migration [!6], mining
[17] and ancient crater [la]. Generally, the majority of those studies were solely focused on the basis of mzpping perspective (such as for detection purposes) in order to assist the conventional method Most techniques are applied in engineering, environmental and archaeological purposes.
Geopkysicaf method was truly championed by people from physical sciences (geopl~ysicist) and is now gaining increased popularity with geotechnical m d structural engineers. In the -past, the application of geophysical techniques such as resistivity method was increasingly used by engineers in SI works especially when dealing in a difficult site and due to its high efficiency of cost and time of its operational. However, the results produced were always unconvinced due to several reasons such as report& by [19] that GM is not being fully explored by the civil engineers due to their lack of exposure and expertise in this area. As reported by [I], some of the reasons are due to poor planning of
geophysical sun7ey by engineers who lack experience in the techniques, over optimistic
geophysicists leading to inappropriate application of the available teclmiques. Furthermore, several geophysicists always try to hide t h ~ i r expertise for business reasons [ 191. Several bhck b x e s were raised during the stage s f data acquisition, processing and interpretation. Those problems create most of the geophysical res~lts to be very difficult due to its weak and ambiguity justification.
Hence, &is study presents a field electrical resistivity and laboratory moisture content data with different m a y setting in order ta discover the influenced of electrical resistivity array to the soil resistivity electrical vdue. This study aims to reduce some black box and zmbiguities via relationship of different array of ERV and basic geoteclmical properties with particular reference to motsture content and supported with soil grain size characteristics. Furthermore, this fundamental study can possibly increased the confidence level of engineers when dealing
with resistivity method in
SItvorks.
Material and Methods
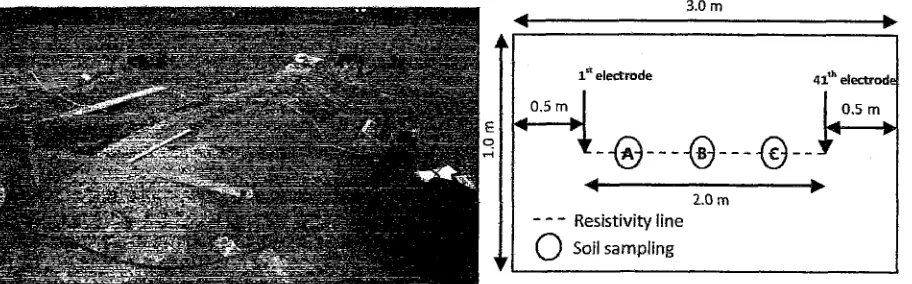
This study consists of three stages: viz fieldwork, data processing using utility sofiware and laboratory experimental. Fieldwork was begin with the construction of small soil embankment with size of 3.0 (length, m) x 1.0 (wide, in) x 0.3048 (height, m) with all sides of the model edge shaped into a gentle slope < 45". The embankment w 7 s constructed without any compaction effort due to the luose condition of lateritic soil swdy purposes. The4 a line of 2D resistivity imaging was performed
Applied
Mechanics and
Materials Vol. 510 2 87electrods (6 inch of length with 2 mm of diameter) with 50 mm eqml spacing via 42 jumper cables f o r total spread line of 2 m length. Then, both resistivity land cables were connected to the electrode selector and Terramater SAS 4000 data logger for field s e w . Finally, 12 volt battery as connected t o the data logger to supply direct current (DC) during the data acquisition. This study used ctipole dipole and pole dipole array due to its dense data with deeper penetration. In order to reduce boundary effect that may reduce the ERV accuracy caused by refracted and reflected current, the electrical resisti'c7ity line was placed at the center ofthe soil model with additional offset (0.51111 from each end o f its length. Based on [20], electrical current may propagate in geomaterials via the process of electrolysis where the current is carried by ions at a comparatively slow rate. Hence, soil models were poured with water before the electrical resistivity test was conducted. Otl~erwise, m e n t will be loathed to propagate through the model due to the dry soil condition w k h will cause some error in the electrical resistivity readings. The model under 2D Electrical resistivity data acquisition ms shown in Fig. 1. All raw data obtained from field measurement was transferred to the computer using SAS4000 utilities software. Then, those data was processed and analyzed using RES2DINV software of [21] to provide an inverse model that approximate the actual subsurface structure. Finally after the resistivity test finished, three soil samples were taken at different point of location in line of the resistivity test immediateiy and tested for soil moisture content using oven drying method and particle size distribution test using dry and wet sieve based on [221. Total depth of soil samples taken was 0.1778 rn from 1 inch of the ground surface. Schematic diag-am representing soil sampling and electrical resistivity line alignment was given in Fig. I.
---L
2.0 m
[image:3.601.79.535.357.499.2]- -
-
Resistivity line Soil samplingFig. 1 Soil embankment model (lateritic soil) tested by 2D electrical resistivity iinaging (Left) and Schemztic diagram of the soil sampling position and resistivity line ali,onment (Right)
Results and Discussions
Electrical resistivity results at point A, B and C was extracted
frsm
2D resistivity section produced from the processing stage. 'It was wound that the electrical resistivity vaIue (ERV) at point C has thelowest ERV followed by ERV at point A and C respectively. The result for 2D resistivity section and localized ERV at point A, A, and C was given in Fig. 2 - 3 and Table 1.
Depth Iteration 7 Abs. error = 78.8 Z
-8.0 U.bOS 0.800 1-28 1.6s n.
Inverse M d e l Resistivity Section
m s l 1 r n m m ~ m m t 7 ~ ~ m m m m -
50.0 zee ear I O U ~ s m ~ S O D ~ iseea sesua
R c s i s t i u i t y i n ohm-m Unit electrode spacing O.BSuoa R.
[image:3.601.85.531.588.742.2]bepth I t c r ~ t l o n jl Abs. error = 19.4 X
8.8 1-&88 1.868 1.28 1.60 R.
Inuerse mdel R e s i s t i u i t y Section
CRR f B % B Z O O S 3535 5518 IBRUR 25811
[image:4.595.71.518.79.187.2]R e 5 i s t i u i t g i n 0hn.m U n i t electrode spacing 1.85Qar a.
Fig.3 Global 2D electrical resistivity tonlography section and localize selected point (A, B and C) of
ERV used for further detail study at soiI model using Pole-dipale array
Table 1. Localized ERV at point A, B and C extracted from 2D ERV tomography section
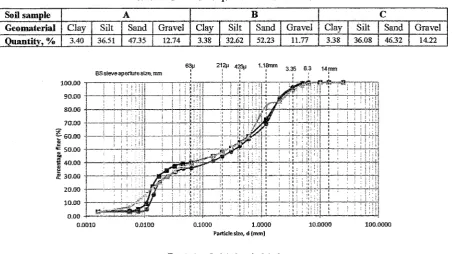
From geotechnical laboratory test, it was found that the soil material was classified as Silty SAPID
based an its composition which dominantly composed from sand and silt fraction. All sieve analysis results of so2 specimen tested from both models has shorn some variation in terms of grain size
quantification due to the natural heterogeneity features of soil. Detail classification results obtained from sieve analysis was given in Table 2 and Fig. 4. Soil moisture content test has revealed that point
C (16.54 %) was the highest compared to point A (16.15 %) and 13 (1 5.83 96) respectively. ERV was forlnd to be higher using Dipole dipole array compared to the pale dip-oie array used during the resistivity data acquisition.
Table 4. Grain size quantification results.
Resistivity array Soil sample (point)
Resistivity, p (am)
Pole-dipole
0.0010 0.0100 0.10M) 1.0000 lO.00OO 100.0000
Particlesize, d fmml
Dipole-dipole
A
9200
+PointA -S=-Po1nt6 --PointC
Figure. 4. PSD curve for lateritic soil model at point A
According to results from resistivity value, both array (Dipole-dipole and Pole-dipole) has found to be dissimilar which indicate that the application of electrical resistivity technique has an influence due to the array setting used during the field measurement. The ERV for both array used was found to be different even the measurement was performed on the same survey line. Basically, this factor
C
1 5625
B
12965 A
17178
Soil sample Geomaterial % C C 5501 B 17720 B Clay 3.38 A Gravel 11.77 Silt 36.08 Clay 3.40 Clay 3.38
Sand
I
Gravel 46.32/
14.22 Silt1
Sand [image:4.595.67.520.439.693.2]Applied Mechanics and Materials Vol. 510 1 89
occurred due to the different geometry factor,
R
derived from the different types of army used. The value of apparent ERV (pa) was gcatly influenced by K factor applied in all measurement. Geometry factor, K describes the geometv of the electrode configuration used in data acquisition. Apparentresistivity (pa) is ERV estimated based on half-pace geometry assumption which refers to the field ERV. According to [20], apparent resistivity will be equal to the true resistivity provided tlie current
and configuration \vas applied over the homogeneous isotropic ground. Field ERV was determined
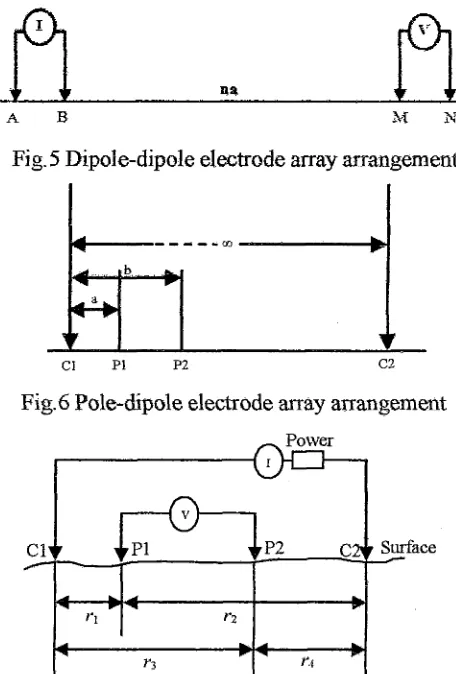
using Dipole-dipole and Pole-dipole array with a geometry factor as given i r ~ final Eq. 1 and 2 whch i s derived from basic Eqs. 3 and 4. Both array geometry factor, I(used in this study was derived from Eq. 4 based on basic four elec-trode system of measurement. The schematic diagram of field resistivity configuration was given in Fig. 5 and Fig. 6 wliile the schematic diagram for the basic four electrode system is given in Fig. 7.
where
R
is a resistance term given by R=A V77pa = ( ( 2 m b ) /(b - u))
*
R where R is a resistance t a m give11 by R=A Y/(Twhere R is a resistance term given by R=AY/I, K is geometry factor based on pole-dipole electrode
c0nfigurat;on
[image:5.601.190.418.420.757.2]where K = ( < I / ( I / T I - I / T ~ ) - ( I / ~ ~ - I / ~ ~ ) )
Fig. 5 Dipole-dipole electrode array arrangement
Fig.6 Bole-dipole electrode array arrangement
However, both ai-ray has demonstrate that the ERV was lowest at highest moisture content (I@)
value (point C) and vice versa (point B). This finding has corfmned the previous theory that statcd that ERV will be decreased with the increasing water content or can be represent usiilg relationship
with ERV cws lhv. According to [6], a soil's electrical resistivity value generally varies inversely proportional to the water content and dissolved ion concentration as clayey soil exhibit high dissolved ion concentration, wet clayey soils have lowest resistivity of all soil materials while coarse, dry sand
and gravel deposits and massive bedded and hard bedrocks have the highest ERV. As reported by
[ 2 3 ] , a decrease of ERV was results from an increased of metal ions or inorganic elements in geomaterials. Apart from the influence of array, water content and partides fractions, this controlled miniature model study also revealed that the soil electrical resistivify value n72s highly influenced by
the presence of air void content. The ERV was found to be very high due to the inconsiste11t1y present of low moisture content and high volume of void based on this study w%ich fo'ocused on loose trial
embankment model. Due to the loose condition of soil model, it enables a higher air filled void which able to increased the
ERV
over tbe range of the previous reference charts and tables. According to [9],air filled void posses a higher resistivity value compared with the water filled void. As reported by [24], ERV for sand and gravel was varied from 50 Qm (wet) - 10,000 k (dry). Hence, careful consideratio~ls such as supported data from others need to be considered in order to interpret a reliable result from loose soil condition Otherwise, it can be wrongly interpreted as hard rock materials.
This study has demonstrated that the electrical resistivity array proves to have an influenced in producing the electrical resistivity value together with the influence of geo~ateria1 feahres such as
fine or coarse gained fraction and water content quantity. Each array has a specific strefish and weakness and the option for array was always relative to the target interest. For example, Wenner array has a good application for horizontal structure while Pole-dipole was the best ai-ray for deeper imaging. As reparted by [9f, the best selection of array was based on signal strength, sensitivity of resistivity value due ta the hanging of vertical and horizontal structure, depth of investigation, type of structure which needs to be mapped and noise level. Finally, the confidence level and reliability of electrical resistivity anomaly interpretation and codusion can be enhanced due to the better understanding of basic fundamental of resistivity may used during each of field measurement
The electrical resistivity value of Silty SAND was successfully performed under small model of soil trial. embankment ~ n d e r loose condition The influence on soil resistivity data due to different types of array 4awsuccessfully and methodically studies and presented. The ERV was largely influenced by types of arra-j used due to the different geometry factor derived from each differat types of array. This study has reduced few of the black boxes (uncertainties) through some of the basic resistivity theory presented. This study has also proved that the ERV was itzfluenced by physical characteristic of soil such as the quantity of moisture content and geomaterials fraction.
Applied Mechanfcs and Materials Val. 510
References
[I] C.RI. Clayton, MC. Ma.tthews, and N.E. Simons: Site Investigalion (Blackwell Science Ltd, 1935).
[2] M.H.Z. Abidin, F. h a d , D.C. Wijeyesekera, R Saad, and MF.T. Baharuddin, in: Soil Resistivity Measurenlents to Predict Moisture Content and Density in Loose and Dense Soil. AppliedMechanics a?zdAdifer?als, VoL 353-3 56, p. 91 1-91 7 (201 3).
[3] A. Godio, C. Strobbia and, G. De. Bacco, in: Geophysical Characterisation of a Rockslide in an
Alpine Region, Engi~leering Geoiogy, Vol. 83, p. 273-286 (2006).
[4] H.J. Mauritsch W. Seibel, R Amdt, A. Romer, K. Scheidei-bauer, and GP. Sendlhofer in:
GeophysicaS Investigations of Large Landslides in the Cashic Region of Southern Austria,
Engineering Geology, Vol. 56, p. 373-388 (2000).
[5 ] R Khatri, V.K. Sfirivastava and R Chandak, in: Correlation between Vertical Electric Sounding and Conventional Methods of Geotechnicat Site Investigation. Intert~utioncll Jotrrnuf of Advanced Engineering Sciences and Techoiogies, Vol. 4, p. 042-053 (201 1).
[6] C. fiu, and J.B. Evett: Soils a~zd Foundation (Pearson International, Siqapore 2008).
[73 I?. Cosenza, E. Mamet, F. Rej iba, Y. Jun Cui, A Tabbagh and Y. Charlery. Correlations between geotechnical and electrical data: A case study at Garchy in France. Jozmzal of A p p M
Geophysics, Vol. GO, p. 165-178 (2006).
[8]
R
Saad, N.M. M W z a , and E.T. Mohamad, in: The 2D Electrical Resistivity Tomography(ERT) Study for Civil and Geotechnical Engineering Purposes. Electronic Jotcmal of Geotechndcal Erzgineerirzg, Vol. 16, p. 2 537-1 545, (20 1 1).
[9] Z. lusoh, Application of 2-D Resistivity Imaging and Seismic Refraction Tecfinlque in Subsurface Tnvestigation for Civil Engineering, M. $. thesis, Sch. Physics, Science Univ., Penang, Malaysia (201 0).
[lO]K.A.N, Adiat, MN. Nawawi, and K Abdullah, in: Assessing the Accuracy of GIS-based
Elementary Muhi Criteria Decision AnaIysis as a Spatial Prediction Tool - A case of Predicting Potential Zones of Sustainable Groundwater Resources. Journal of Hydrology, Vol. 440-441, p.
75-89 (20 12).
[I 1 ]R S a d , M.N.M. Nawawi, and E. T. Mohamad, in: Groundwater Detection in Alluvium Using 2-D Electrical Resistivity Tomography (ERT). Electronic Jownad oJ'Geotechnical Engineering, Vol. 17, p. 369-376 (2012).
[12]U. H a m 1 5 AR. Samsudin, and E.P. Malim, in: Groundwater investigation in Kuala $clangor
using vertical electrical sounding (VES) surveys. EnrironrrzenfaE G e o l o ~ , Vol. 51, p. 1349- 1359 (2007j.
[13]U. Hamzah, R. Yaacup, A.R. Samsudin, and M.S. Ayub, in: Electrical imaging of the Gror~ndwater Aquifer at Banting, Selangor, Malaysia. En1iron?nentai Geology, Vol. 49, p. 1 1 56- 1 1 62 (2006).
[14]hfF.T. Baharuddin, S.Taib, R. Hashim, M.H.Z. Abidin, and M.F. Ishak, in: Time-lapse
resistivity investigation of salinity changes at an ex-promontory land: a case study of Carey Island, Selangor, Malaysia. Enviror?mental Mor.ritoriul.g and Assessment, Vol. 180, p. 345-369
(201 1).
[l G1A.R Sanlsudin, B.E. A &him, W.Z.W. Ymcob, U. H a ~ m h , in: hhpping of contamination plumes at municipal solid wwte disposal sites using geoelectric imaging technique: Case studies
in Malaysia. Journal of Spatin7 Hydrology, Vol. 6 no, 2 (2006).
[17]R. Saad, I. Adii, and A.S. Mohamad, in: The Study of Iron Ore Prospect using 2-D Resistivity m d
Induced Polarization QP) Method. Elecfru?iic Jozn.mI ~fG.mtcchnial Engi'neel-ing, Val. 14, p.
2981-2988 (2012).
[1S]R Saad, M.M Saidia, N.M Muztaza, N.A. Ismail, and N.E.H. Ismail, in: Subsurface Study Using 2-D Resistivity Imaging Method for Meteorite Impact at Bukit Bunt.& Perak. Electro~ic
Jor~~marl of Geotechnical E1?@17eer-i12g, Vcl. 16, p. 1507-1 51 3 (201 1).
[I 9lhiH.Z. Abidin, D.C. Wijeyesekera, F. Ahrnad, and R S a d , in: Integral Analysis of Laboratory
and Field Electrical Resistivity Value for Soil Moisture Content Prediction
-
Soft Soil&?gi~eert'-~g h?tcmm$z~al Colzference, (201 3).
1201 W - M Telford, L.P. Geldart, and, R.E. Sheriff &plied Geoyhysics (Cambridge University Press, 1990).
[21]M.H. Loke, L Acwortk, and T. Dahlln, in: A comparison of smooth and bloc& inversion
methods 2-D electrical imaging surveys. Explo~ Geophj?~, Vol. 34, No. 3, p. 182 - 187 (2003).
[22]iMefhods of Testfor bTaibfo~. Ciryid Engineering Pzrzyoses, British s t a f ~ b r d 1377: 1980.
[23]Y. Jung, Y. Lee, and Ha, H. in: Application of Electrical Resistivity Imaging Techniques to Civil and Environmental Problems. Use of GeoprSlsicaf Meth~ds in Conslnlction (2000).