Journal of Chemical and Pharmaceutical Research, 2014, 6(7):1991-1999
Research Article
CODEN(USA) : JCPRC5
ISSN : 0975-7384
Supervised prediction of drug-target interactions by ensemble learning
Yan Qing Niu
School of Mathematics and Statistics, South-central University for Nationalities, Wuhan, China
____________________________________________________________________________________________ABSTRACT
Drug-target interaction (DTI) provides novel insights about the genomic drug discovery. The wet experiments of identifying DTIs are time-consuming and costly. Recently, the increase of available data provides the opportunity to the development of computational methods. Although many computational methods have been proposed (such as classification-based methods, graph-based methods and network-based methods), there is still room for improvements. On one hand, there are much more non-interaction drug-target pairs than interaction pairs, and the classification-based methods are undermined by the imbalanced data and heavy computational burden. On the other hand, the graph-based methods and the network-based methods are incapable of predicting the interactions between new drugs and new targets. In the paper, we investigate the correlation of drugs and targets that interact, based on four classes of drug–target interaction data involving enzymes, ion channels, G-protein-coupled receptors and nuclear receptors. By exploiting the global information from interaction data, we compile the drug-target interaction networks as the binary classification datasets with positive and negative drug-target pairs. Then, we develop a representation of drug-target pairs based on drug chemical similarity and target sequence similarity, and adopt the random forest as classification engine to build the prediction models. Compared with the state-of-the-art methods, our method produces satisfying performance on the benchmark datasets. In general, our method can predict the interactions between know drugs and targets as well as the interactions between new drugs and new targets. In conclusion, our method is a promising tool for the drug–target interaction prediction.
Key words: ensemble learning, machine learning, bioinformatics, drug-target interactions, drug discovery
____________________________________________________________________________________________
INTRODUCTION
The identification of interactions between drugs and target (DTIs) proteins plays an important role in the drug discovery [1-3]. The high-throughput experiments that analyze the genome, transcriptome and proteome can help to understand the genomic spaces populated by common protein classes, and identify potentially useful compounds. However, the wet experiments are time-consuming and costly. The boom of bioinformatics promotes the establishment of drug databases, and the increase of data provides the opportunity for the development of computational methods, and the computational methods become an alternative.
The earlier methods are based on the tradition computational techniques. Keiser et al. (2007) [4] predicted target protein families based on the known structures of a set of ligands, but may not perform well for target proteins with limited number of known ligands. Humberto et al. developed a multi-target QSAR classifier and built a web server for DTI prediction [5]. Li et al. proposed a docking-based method, and construct a web server named 'TarFisDock' for DTI identification [6]. However, those traditional methods could not be used when the 3D structures of target proteins are not available.
Graph-based models take DTIs as a bipartite, and use the graph theory and supervised inference methods to predict DTIs. The network-based models adopt the complex network algorithm to predict the DTIs.
In 2008, Yamanishi et al.[7] formulated the drug–target interaction inference as a supervised learning problem for a bipartite graph, and build prediction models by using nearest profile, weighted profile and bipartite graph learning respectively. More recently, the researchers come to realize that similar drug compounds are likely to interact with similar target proteins (we name it 'similarity principle' in the following context), thus graph-based models and network-based models are developed. Yamanishi et al. [8] (2009) uses bipartite local models to predict target proteins of a given drug, and to predict drugs targeting a given protein. Xia (2010) [9] adopts the semi-supervised method to predict drug-protein interaction from heterogeneous biological spaces. In 2011, Huang [10] considers the DTIs as the complex network, and adopts the network-based inference method to predict potential DTIs. Laarhoven (2011) [11] adopts the Gaussian interaction profile kernels to predict drug-target interaction. Chen (2012) [12] developed the drug-target interaction prediction by random walk on the heterogeneous network. In 2012, Yu [13] proposed a systematic binary classification approach that efficiently integrates the chemical, genomic, and pharmacological information for drug targeting and discovery on a large scale, by using two machine learning methods-Random Forest (RF) and Support Vector Machine (SVM). Chen (2013) [14] proposed A Semi-Supervised Method for Drug-Target Interaction Prediction with Consistency in Networks.
In general, the classification-based models may benefit from the sophisticated binary classification algorithms. However, there are much more non-interaction drug-target pairs than interaction pairs. In order to deal with the imbalance, the known interacting pairs are taken as positive instances, and negative instances of the same number are extracted from non-binding drug-target pairs. This strategy may lead to the information loss, and influence the performance of prediction models. In contrast, due to the use of similarity principle, the graph-based methods and network-based methods can yield better performance than the classification-based models. However, they cannot effectively predict interactions between new drugs (drugs not existing in the training set) and new targets (targets not existing in the training set). Therefore, the applicability of the graph-based methods and network-based methods are seriously undermined.
In order to build high-accuracy and useful prediction models, we should consider some points concerning the drug-target interaction: (1) the similarity principle incorporates the mechanism of drug-target interaction, and it is very important for building prediction models. (2) The applicability of prediction models is as important as the accuracy. The powerful method should make prediction for any DTIs, especially the interactions between new drugs and new targets. In order to address above issues, we take following strategies. Firstly, we use the known DTIs as the positive instances, and adopt the data bootstrapping technique to extract negative instances from non-interaction pairs. Then, multiple balanced datasets with binary instances are compiled, which may reduce the information loss in data processing. Secondly, we develop a novel representation of drug-target pairs by considering drug chemical structure similarity and protein sequence similarity. Thirdly, we adopt the random forest as the classification engine, and develop the base classifiers based on the multiple datasets. Thus, the ensemble model is constructed by combining based classifiers. Compared with the state-of-the-art methods, our method produces satisfying performance on the benchmark datasets. In general, our method can predict the interactions between know drugs and targets as well as the interactions between new drugs and new targets. In conclusion, our method is a promising tool for the drug–target interaction prediction.
EXPERIMENTAL SECTION
Datasets
There are several databases related with the drug-target interaction, such as the KEGG BRITE [15], BRENDA [16], SuperTarget [17] and DrugBank [18]. These databases contain containing experimentally validated DTIs, and help to establish the foundation of computational works. KEGG BRITE is a component of KEGG (Kyoto Encyclopedia of Genes and Genomes) database, which can provide the information about the protein-protein interaction. BRENDA (http://www.brenda-enzymes.org/) is the main collection of enzyme functional data. SuperTarget (http://bioinf-apache.charite.de/supertarget_v2/) is a database collecting information about drug-target relations, which mainly consists of three different types of entities: drugs, proteins, and side effects. Besides, information about pathways and ontologies can be obtained. DrugBank database (http://www.drugbank.ca/) is an important resource that combines detailed drugs with comprehensive drug target. The database contains 1455 FDA-approved small molecule drugs, 131 FDA-approved biotech drugs and etc.
datasets are shown in table 1. Since the datasets have been widely used in the recent studies, they are adopted as the benchmark datasets to evaluate our models and make comparison with benchmark methods.
Table 1. The details of benchmark datasets
Dataset #Drug #Target #Interaction Non-Interaction versus Interaction Enzyme 445 664 2926 99.9843
Ion channel 210 204 1476 28.0244 GPCR 223 95 635 32.3622 Nuclear receptor 54 26 90 14.6000
Basic idea of our method
In this paper, we attempt to predict drug-target interactions through comparative study of binary classification-based models, graph-based models and network-based models. Firstly, we generate the instances representing the interacting drug-target pairs and non-interacting pairs from interaction data, and transform the original problem into the binary classification. Then, we develop an encoding scheme of presenting drug-target pairs as numeric vectors, which incorporates the idea that the similar drugs are likely to interact with similar targets. In order to build the high-accuracy prediction models, we adopt the random forest as the classification engine, and develop the ensemble models. The basic idea is shown in FIg.1.
Interaction data
Binary instances
Numerical Vectors
Ensemble models
Instance
Generation
Encoding
Scheme
Ensemble
learning
Figure 1. The flowchart of our method
The details of compiling binary instances from interaction data, the encoding scheme and ensemble learning strategy are presented in the following context.
Generating instances from interaction data
Here, we formulate the original problem as the binary classification, by generating binary instances from interaction data. For N drugs and M targets, there are N*M drug-target pairs. Clearly, the known interaction pairs take a small proportion of all pairs, and there are a huge number of non-interaction pairs. For example, the enzyme data includes 292554 non-interaction pairs. The imbalanced and large-scale data lead to the heavy computational burden. In the related studies, non-interaction pairs are randomly selected until they reached the same number as the positive pairs, thus the balanced dataset are generated. However, this strategy may lead to the information loss and have the negative impact on the performance of prediction models.
Here, we adopt data bootstrapping to compile binary instances. Given the interaction data, the interaction drug-target pairs are used as the positive instances, and data sampling is implemented n times on the non-interaction pairs to obtain n subsets with the same size as interaction pairs. By combining interaction pairs and n subsets of non-interaction pairs respectively, we can obtain n balanced datasets, which are further used for modeling. The flowchart of generating instances from interaction data is shown by table 2. The strategy can make use of the interaction dataset and avoid the data bias.
Figure 2. The flowchart of generating instances from interaction data
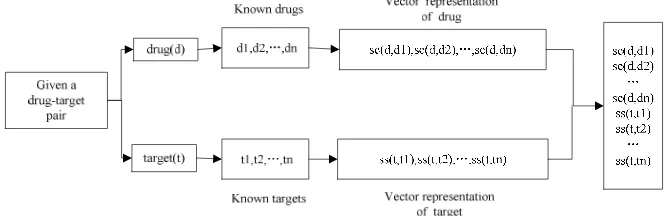
Vector representation of drug-target pairs
protein sequences or peptides by various descriptors or features. These descriptors are usually related with the physicochemical and structural properties of the molecules, and can be used to infer models to predict, e.g. the structural or functional class of a protein.
The similarity principle (the similar drugs are likely to interact with similar targets) is widely used in the recently proposed graph-based models and network-based models, and the studies show the similarity principle can well describe the mechanism of drug-target interaction. Therefore, we develop an encoding scheme for drug-target pair representation by incorporating the similarity principle.
For drugs, we can collect their chemical structures from the KEGG LIGAND database, and compute the chemical structure similarity between drugs using SIMCOMP program [19-20]. SIMCOMP provides a global similarity score based on the size of common substructures between drugs using a graph alignment algorithm. The similarity between drugs d and d’ is given bysc d d( , ')= dId' / dUd' . For target proteins, we obtained their primary sequences from the KEGG GENES database, and computed sequence similarities between proteins using a normalized version of Smith–Waterman scores. The score between two proteins t and t’ is given by
( , ') ( , ') / ( ( , ) ( ', '))
[image:4.595.139.472.293.401.2]ss t t =sw t t sw t t sw t t , where sw t t( , ) means the original Smith-Waterman score. Therefore, a drug-target pair is represented by combining the chemical structure similarity and sequence similarity, shown by Figure 3.
Figure 3. The encoding scheme of represent drug-target pairs as numerical vectors
Given a set of drug-target pairs{ , } 1
k k
K i j k
d t = , covering a set of drugs { }n1 ii i
d = and a set of targets { }m1 i i i
t = , diis represented by the vector
{
sc d d( ,i 1),sc d d( ,i 2),L,sc d d( ,i n)}
, and ti is represented by the vector{
ss t t( , ),i 1 ss t t( , ),i 2 L,ss t t( , )i m}
. Thus, we can represent the drug-target pair of di and ti by merging two vectors.The development of ensemble models
Due to the efficiency and good generalization capability, the random forest is used as the classification engine in the paper, and we adopt the ensemble learning technique to construct the prediction model. Random forest (RF) is a machine learning method developed by Leo Breiman and Adele Cutler [21], which can be used for both classification and regression. Typically, a random forest (RF) is made up of many decision trees, which are constructed in the following way: the sampling technique is adopted to generate multiple samples from the dataset, and trees are constructed on these samples by selecting split features from a small random subset of features. The ensemble learning is a popular technique in machine learning [22], which can incorporate various features or data resources to achieve high-accuracy performance. Its effectiveness has been proved by numerous applications in bioinformatics [23-26].
The scheme of the ensemble model is summarized as follows.
1. Let A− be the set of non-interaction drug-target pairs;A+be the set of interaction pairs. Random data sampling is implemented n times on the A− to obtain n data subset Ai
− whose size is equal to the size of
A+,i=1, 2,L,n; 2. Combined each Ai− and A+ to generate n datasets with binary instances, i=1, 2,L,n . Totally, n base-classifiers can be constructed on n datasets, and the ensemble model consists of these base-classifiers.
3. Given a new instance, n classifiers will make n decision values (binary value), and average voting given by classifiers is used as the final decision.
Random forest and data bootstrapping are implemented by Weka package [27], and default parameters are adopted.
Performance evaluation metrics
accuracy (ACC), precision, recall, F-measure (F), the area under ROC curve (AUC) and the area under PR (AUPR). TP Recall SN TP FN = = + TN SP TN FP = + TP TN ACC
TP TN FP FN
+ = + + + TP Precision TP FP = +
2 Precision Recall
F
Precision Recall
× = ×
+
Where TP,TN , FP and FN are the number of true positives, the number of true negatives, the number of false positives and the number of false negatives. Following the previous works, R , AUC and AUPR are used as the primary evaluation metrics to evaluate and compare models.
RESULTS
In this section, we focus on the drug-target interactions concerning four pharmaceutically useful target protein classes: enzymes, ion channels, GPCRs and nuclear receptors.
The statistical analysis on benchmark dataset
The similarity principle is widely adopted in the network-based methods and graph-based methods, and leads to the satisfying performances. Here, we take the statistical analysis to test the similarity principle.
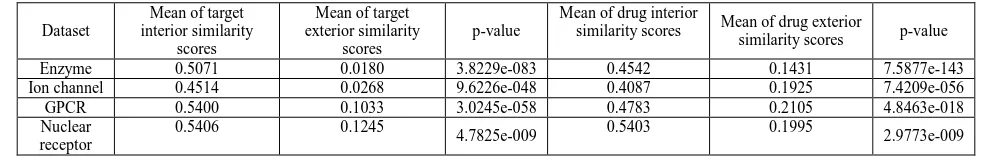
For each protein family, targets of each drug are divided into the interaction targets or non-interaction targets. For each drug, the mean similarity score between interaction targets (target interior similarity) as well as the mean similarity score between interaction targets and non-interaction targets (target exterior similarity) are calculated respectively. For example, we can obtain a vector of 445 target interior similarity scores and a vector of 445 target exterior similarity scores for 445 drugs in the Enzyme dataset. Likewise, drugs can be into interaction or non-interaction for each drug, and their difference can also be analyzed.
[image:5.595.255.356.100.228.2] [image:5.595.58.559.553.633.2]As shown in table 2, the interior targets are much more similar than exterior targets; likewise, the interior drugs are more similar than exterior drugs. By paired t-test, the difference of interior targets and exterior targets is statistically significant. The statistically significant different is also observed for the interior drugs and exterior drugs. The results demonstrate the similarity principle
Table 2. The AUC scores of ensemble models using different data sampling times, evaluated by 10-fold CV
Dataset
Mean of target interior similarity
scores
Mean of target exterior similarity
scores
p-value
Mean of drug interior
similarity scores Mean of drug exterior
similarity scores p-value
Enzyme 0.5071 0.0180 3.8229e-083 0.4542 0.1431 7.5877e-143 Ion channel 0.4514 0.0268 9.6226e-048 0.4087 0.1925 7.4209e-056 GPCR 0.5400 0.1033 3.0245e-058 0.4783 0.2105 4.8463e-018 Nuclear
receptor
0.5406 0.1245
4.7825e-009 0.5403 0.1995 2.9773e-009
Table 2. The AUC scores of ensemble models using different data sampling times, evaluated by 10-fold CV
Data 1 2 4 6 8 10 12 14 16 18 20 Enzyme 0.9540 0.9650 0.9700 0.9720 0.9720 0.9730 0.9730 0.9730 0.9730 0.9730 0.9730 Ion Channel 0.9480 0.9640 0.9690 0.9690 0.9710 0.9710 0.9710 0.9710 0.9720 0.9720 0.9720 GPCR 0.8880 0.9120 0.9210 0.9230 0.9250 0.9260 0.9260 0.9270 0.9280 0.9290 0.9290 Nuclear Receptor 0.8110 0.8360 0.8290 0.8340 0.8370 0.8360 0.8360 0.8400 0.8430 0.8440 0.8430
The performance of ensemble models
Here, the data bootstrapping is implemented n times to generate multiple datasets from interaction data, and the ensemble model is constructed based on multiple datasets. The parameter n may influence the performances of ensemble models. Therefore, we test different values of n ranging from 1 to 20 and results are shown in Table 2. The results demonstrate the parameter n has the impact on the performances of models, and the greater value of parameter may lead to greater AUC score. In previous classification-based models, the non-interacting pairs with the same number of interaction pairs are randomly sampled from all non-interacting ones, and the balanced dataset is compiled. In order to test the usefulness of the multiple data bootstrapping, we construct the non-ensemble prediction models. In fact, the non-ensemble model is a special case for the ensemble model (data sampling time n=1). According to the results in the table 2, the ensemble models yield better performance than the non-ensemble models.
However, much bootstrapping times can lead to the heavy computational burden. Considering the medium between the performance and the computational cost, we set the data bootstrapping times n as 10 in the following study. Table 3 shows the performance of our ensemble models, in terms of different statistics.
Table 3. The performance of models evaluated by 10-fold CV (data sampling time n=10)
Data AUPR AUC TPR FPR recall precision F accuracy Enzyme 0.699 0.972 0.899 0.059 0.899 0.133 0.231 0.941 Ion Channel 0.753 0.969 0.920 0.093 0.920 0.262 0.407 0.908 GPCR 0.471 0.920 0.876 0.196 0.876 0.122 0.214 0.807 Nuclear Receptor 0.353 0.838 0.825 0.296 0.825 0.161 0.269 0.712
Obviously, based on the known interaction, our models can produce the satisfying results for unknown interactions. Our model can produce the AUC scores of 0.973, 0.971 and 0.926 for Enzyme, Ion Channel, GPCR, respectively, which consist of hundreds of or thousands of interaction data. Because nuclear receptor dataset only includes 26 interactions, the prediction model gives out the AUC score of 0.836 on this dataset. For four protein families, our model can produce the recall scores greater than 0.8, showing the potential of our computational methods.
The performance of models for new drugs and new targets
In the 10-CV, drugs and targets in the training set are called ‘known’, whereas those not existing in the training set are called ‘new’. Compared with the drug-target pairs in the training set, there are four classes of pairs in the testing set: (1) known drug and known target; (2) new drug and known target; (3) known drug and new target; (4) new drug and new target. In fact, the results in the table 3 are the average performances of our models on the dataset, which may include four classes of pairs in the testing set.
With respect to the practical use, researchers may be more interested in the prediction of interaction between new drugs and new targets. Therefore, we carry out more computational experiments. Here, we adopt three different ways of data splitting for 10-fold Cross Validation, namely drug split, target split, and drug-target split. Drug split is to split drugs into 10 parts, and keep all targets in both training set and testing set; target split is to split targets into 10 parts, and keep all drugs in both training set and testing set; drug-target split is to split both drugs and targets into 10 parts, and drugs and targets in the testing set are not included in the training set.
Table 4, table 5 and table 6 respectively show the 10-CV performance of models using three ways of data splitting. For Enzyme, Ion Channel and GPCR, the models can yield the AUC scores greater than 0.8. For Nuclear Receptor, the models produce the AUC scores greater than 0.7. More important, in the drug-target split, the prediction models yield satisfying results for new drugs and new targets.
Table 4. The 10-CV performance of models based on drug split
Data AUC TPR FPR recall precision F accuracy Enzyme 0.822 0.380 0.040 0.380 0.088 0.143 0.955 Ion Channel 0.772 0.415 0.062 0.415 0.193 0.263 0.920 GPCR 0.863 0.769 0.187 0.769 0.113 0.197 0.812 Nuclear Receptor 0.790 0.678 0.282 0.678 0.141 0.234 0.715
Table 5. The 10-CV performance of models based on target split
Table 6. The 10-CV performance of models based on drug-target split
Data AUC TPR FPR recall precision F accuracy Enzyme 0.865 0.556 0.044 0.556 0.112 0.186 0.952 Ion Channel 0.846 0.629 0.078 0.629 0.224 0.330 0.912 GPCR 0.865 0.783 0.189 0.783 0.113 0.197 0.810 Nuclear Receptor 0.760 0.653 0.287 0.653 0.134 0.222 0.709
Comparison with benchmark methods
Here, several state-of-the-art methods are adopted as the benchmark methods for comparison, such as Yaminish’s bipartite graph learning method[7], Yaminish’s bipartite local method[8] and Cheng’s network-based inference method[10].
Yaminish’s bipartite graph learning method[7] embed compounds and proteins on the interaction network into a unified space called ‘pharmacological space’, and then build a model between the chemical/genomic space and the pharmacological space. Yaminish’s bipartite local method [8] represents the unknown drug-target interactions as a bipartite graph. The bipartite local model first predicts target proteins of a given drug, and then predicts drugs targeting a given protein. Then, two independent predictions are combined for prediction. Cheng’s network-based inference method [10] adopts the resource allocation algorithm to predict interactions in the drug-target interaction network. These methods were ever evaluated on the same benchmark datasets, and the performance scores can be obtained from the publications.
In order to compare different methods, we performed 10 trials of 10-fold cross-validation, and R scores, AUC score and AUPR scores are adopted. According to the results in table 7, the AUC scores of our method are obviously better than the graph learning method, and are closed to the bipartite local method and NBI method. In addition, as shown in the table 8 and table 9, our method leads to poor performance than bipartite local method and NBI method in terms of AUPR and R. Although the bipartite local method and NBI method can produce high-accuracy performance, they fail to predict the interactions between new drugs and new targets. In contrast, our method can make prediction for such pairs, and may have the potential for practical application.
Table 7. The 10-CV performance of different method in terms of AUC
Data Bipartite learning method bipartite local method NBI method Our method Enzyme 0.904 0.97.0 0.975 0.973 Ion Channel 0.851 0.968 0.976 0.971 GPCR 0.899 0.948 0.946 0.926 Nuclear Receptor 0.843 0.850 0.838 0.836
Here, we must emphasize the applicability of prediction models is as important as the accuracy. Compared with the state-of-the-art methods, our method can produce the high-accuracy performance and predict any DITs.
Table 8. The 10-CV performance of different method in terms of AUPR
Data Bipartite learning method bipartite local method NBI method Our method
Enzyme N.A 0.832 N.A 0
Ion Channel N.A 0.768 N.A 0.753
GPCR N.A 0.652 N.A 0.471
Nuclear Receptor N.A 0.581 N.A 0.353
Table 9. The 10-CV performance of different method in terms of R
Data Bipartite learning method bipartite local method NBI method Our method Enzyme 0.574 N.A 0.935 0.909 Ion Channel 0.271 N.A 0.981 0.924
GPCR 0.234 N.A 0.948 0.882
Nuclear Receptor 0.148 N.A 0.851 0.844
CONCLUSION
chemical similarity and protein sequence similarity. Then, we adopt the random forest as the classification engine, and develop the ensemble models to make prediction. Compared with the state-of-the-art methods, our method produces high-accuracy performance for the benchmark datasets. More importantly, our method can produce the satisfying performance for the interactions between new drugs and new targets. In conclusion, our method is promising for the computational prediction of DTIs.
REFERENCE
[1]Keiser MJ, Setola V, Irwin JJ, Laggner C, Abbas AI, et al. (2009) Predicting new molecular targets for known drugs. Nature 462: 175–181.
[2]Ashburn TT, Thor KB (2004) Drug repositioning: identifying and developing new uses for existing drugs. Nat Rev Drug Discov 3: 673–683.
[3]Boguski MS, Mandl KD, Sukhatme VP (2009) Drug discovery. Repurposing with a difference. Science 324: 1394–1395.
[4]Keiser MJ, Roth BL, Armbruster BN, Ernsberger P, Irwin JJ, et al. (2007) Relating protein pharmacology by ligand chemistry. Nat Biotechnol 25: 197–206.
[5]Gonzalez-Diaz H, Prado-Prado F, Garcia-Mera X, Alonso N, Abeijon P, et al. (2011) MIND-BEST: Web Server for Drugs and Target Discovery; Design, Synthesis, and Assay of MAO-B Inhibitors and Theoretical-Experimental Study of G3PDH Protein from Trichomonas gallinae. J Proteome Res 10: 1698–1718.
[6]Li H, Gao Z, Kang L, Zhang H, Yang K, et al. (2006) TarFisDock: a web server for identifying drug targets with docking approach. Nucleic Acids Res 34: W219–224.
[7]Yamanishi, Y. et al. (2008) Prediction of drug-target interaction networks from the integration of chemical and genomic spaces. Bioinformatics, 24, i232–i240.
[8]Bleakley K, Yamanishi Y (2009) Supervised prediction of drug-target interactions using bipartite local models. Bioinformatics 25: 2397–2403.
[9]Xia,Z. et al. (2010) Semi-supervised drug-protein interaction prediction from heterogeneous biological spaces. BMC Syst. Biol., 4 (Suppl. 2), S6.
[10]Cheng F, Zhou Y, Li W, Liu G, Tang Y. Prediction of Drug-Target Interactions and Drug Repositioning via Network-Based Inference. PLoS One. 2012;7(7):e41064. doi: 10.1371/journal.pone.0041064. Epub 2012 Jul 16. [11]Van Laarhoven,T. et al. (2011) Gaussian interaction profile kernels for predicting drug-target interaction. Bioinformatics, 27, 3036-3043.
[12]Chen,X. et al. (2012) Drug-target interaction prediction by random walk on the heterogeneous network. Mol. Biosyst., 8, 1970–1978.
[13]Yu H, Chen J, Xu X, Li Y, Zhao H, Fang Y, Li X, Zhou W, Wang W, Wang Y. A systematic prediction of multiple drug-target interactions from chemical, genomic, and pharmacological data. PLoS One. 2012;7(5):e37608. doi: 10.1371/journal.pone.0037608. Epub 2012 May 30.
[14]Hailin Chen and Zuping Zhang. A Semi-Supervised Method for Drug-Target Interaction Prediction with Consistency in Networks. PLoS One. 2013; 8(5): e62975.
[15]Tanabe M, Kanehisa M. Using the KEGG database resource. Curr Protoc Bioinformatics. 2012 Jun;Chapter 1:Unit1.12. doi: 10.1002/0471250953.bi0112s38.
[16]BRENDA in 2013: integrated reactions, kinetic data, enzyme function data, improved disease classification: new options and contents in BRENDA.Schomburg I., Chang A., Placzek S., Söhngen C., Rother M., Lang M., Munaretto C., Ulas S., Stelzer M., Grote A. Scheer M., Schomburg D.Nucleic Acids Res., 41:764-772 (2013) [17]SuperTarget goes quantitative: update on drug-target interactions.Hecker N, Ahmed J, von Eichborn J, Dunkel M, Macha K, Eckert A, Gilson MK, Bourne PE, Preissner R.Nucleic Acids Res. 2012 Jan;40(Database issue):D1113-7. doi: 10.1093/nar/gkr912. Epub 2011 Nov 8.
[18]DrugBank 3.0: a comprehensive resource for 'omics' research on drugs. Knox C, Law V, Jewison T, Liu P, Ly S, Frolkis A, Pon A, Banco K, Mak C, Neveu V, Djoumbou Y, Eisner R, Guo AC, Wishart DS. Nucleic Acids Res. 2011 Jan;39(Database issue):D1035-41.
[19]Hattori, M., Okuno, Y., Goto, S. and Kanehisa, M."Development of a chemical structure comparison method for integrated analysis of chemical and genomic information in the metabolic pathways", Journal of the American Chemical Society, 125, 11853-11865 (2003)
[20]Hattori, M., Okuno, Y., Goto, S. and Kanehisa, M."Heuristics for Chemical Compound Matching", Genome Informatics 14, 144-153 (2003)
[21]Breiman,L.: Random Forests. Mach. Learn.2001, 45, 5-32.
[22]Polikar R (2006) Ensemble based systems in decision making. IEEE Circuits Syst Mag 6(3):21-45.
[23]Hu J, Yang YD, Kihara D (2006) an ensemble algorithm for discovering regulatory motifs in DNA sequences. BMC Bioinformatics 7(1):342.
25(7):941-947.
[25]Abeel T, Helleputte T, Van de Peer Y, Dupont P, Saeys Y (2010) Robust biomarker identification for cancer diagnosis with ensemble feature selection methods. Bioinformatics 26(3):392-398.
[26]Deng L, Guan J, Dong Q, Zhou S (2009) Prediction of protein-protein interaction sites using an ensemble method. BMC Bioinformatics 10(1):426.