ISSN: 1992-8645 www.jatit.org E-ISSN: 1817-3195
MULTI CRITERIA SOFTWARE QUALITY ASSESSMENT OF
OPEN SOURCE CONTENT MANAGEMENT SYSTEM
1
EMA UTAMI, 2JAMAL
1
Magister of Informatics Engineering, Universitas AMIKOM Yogyakarta, Indonesia
2
Informatics Engineering, STMIK Balikpapan, Indonesia
Email : ,1 [email protected], 2 [email protected]
ABSTRACT
The purpose of this study is to compare the quality of software from five web applications based on open source Content Management System (CMS) e-commerce. Thus which has the best quality design model is providing recommendations to web developers, businesses and beginner on building an e-commerce website. This study uses a web application Prestashop, Magento, Woocommerce, Oscommerce and Openchart. The measurement of software quality uses traditional metrics and CK metrics suite parameters.
To measure software quality using tools PHP Depend. Traditional metrics quantitative assessment, CK
metrics suite and software quality factors to get the best quality web applications using a combination of methods Analytical Hierarchy Process (AHP) and methods Technique for Order Preference by Similarity to Ideal Solution (TOPSIS). Determination of the quality of software is based on two main stages, namely the first stage by using AHP. AHP is used to find the weight of traditional metrics, CK metrics suite and software quality factors parameters. The second stage uses TOPSIS method. TOPSIS is used to search final score and ranking. The result of this study indicates that web applications Prestashop has the best software quality compared with Woocommerce, Oscommerce, Magento, and Opencart.
Keywords: Traditional Metrics, CK Metrics Suite, Software Quality Factors, AHP, TOPSIS
1. INTRODUCTION
The purpose of the software is to create quality software. These objectives can be achieved by conducting an assessment of the quality of the software, involving many factors. The quality of a software design is very important to be measured to encounter the quality of the software used, so the problem encountered can be solved quickly. Having quality software be expected to reduce probability of occurring problems and faster to resolve when errors are founded. In this study, the authors take 5 pieces of web applications (Prestashop, Magento, Woocommerce, Oscommerce, and Opencart) based on open source Content Management System (CMS) e-commerce to be assessment. The author chooses a web application because the application is built with any programming language largely based object-oriented class. These five web applications will be measured and be ranked based on an objective assessment of the results of the assessment of traditional quantitative metrics, CK metrics suite and quality factors are processed by using AHP-TOPSIS. How the result of combination of traditional metrics, CK Metrics suite and
AHP-TOPSIS method used to assessment the quality software ?
1.1 Traditional Metrics
In object-oriented systems, the traditional metrics are generally applied to a method which includes the operations of the class. A method is a component of an object that operates on the data in response to the message and is defined as part of the class declaration [16]. Three traditional metrics used in this discussion are: 1). Cyclomatic Complexity (CC); 2). Line Of Code (LOC); 3).
Comment Percentage (CP) [3],[18],[19].
1.2 CK Metrics Suite
ISSN: 1992-8645 www.jatit.org E-ISSN: 1817-3195
1). The Weighted Methods Per Class (WMC); 2). Depth of Inheritance Tree (DIT); 3). Number Of Children (NOC); 4). Coupling Between Object Classes (CBO); 5). Response For a Class (RFC); 6). Lack of Cohesion of Method (LCOM) [3],[18],[19]. Several previous studies have used a software quality measurement tools are realized in several parameters such as the traditional metrics [12],[18],[19] and CK Metrics Suite [4],[5],[8]. This software quality measurement tool called the Object Oriented Design (OOD) Metrics.
1.3 Software Quality Factors
Measuring the quality of the software can be done using one from any variety of software quality models that exist. Model ISO 9126 is an international standard that exists today, this model still general. This model has the software quality factors as the following: functionality, reliability, usability, efficiency, maintainability and portability [15],[16]. McCall models have many components of the assessment. This model is suitable for use if the main problem is a thorough and in-depth assessment [15]. This model has a software quality
factors as follows: correctness, reliability,
efficiency, integrity, usability, maintainability, flexibility, testability, portability, Reusability and
Interoperability [11],[15],[16]. Olsina and
colleagues, a few years ago to develop a "Tree of quality assessment" that can be used to identify a number of attributes of technical ie: usability,
functionality, reliability, efficiency and
maintainability which would then be used as a guide for the achievement of goals relating to criteria that can be set at a high-quality web applications [16],[17].
1.4 AHP and TOPSIS Method
AHP is a method of paired comparisons to some of the objects to be evaluated. AHP was first published by T.L. Saaty in his book entitled "The Analytic Hierarchy Process" in 1990 [20]. The purpose of the AHP is to help people in organizing thought and judgment to make decisions more effectively. One of the advantages of AHP is based on pairwise comparison matrix and analyzing the consistency check. Pairwise comparisons are the most important part of the AHP, where the provision of pairwise comparisons should be done by skilled in the art.
TOPSIS is one of multiple criteria decision making, first introduced by Yoon and Hwang in 1981. TOPSIS in principle that the selected
alternative should have the closest distance from the positive ideal solution and farthest from the negative ideal. This method is widely used to solve practical decision-making. This is due to the concept is simple and easy to understand, computationally efficient and has the ability to measure the relative performance of alternatives decision [9].
2. RELATED WORK
Okanovic taking some of the open source web applications, open source can be used for free, modified and shared to everyone [14]. Results from this study can be used as a starting point to make the decision of choosing a framework for building web applications.
Monga et al have explained various attributes or factors affecting reusability software. The most common factors identified as understandability, maintainability, quality and impact analysis [13]. The study also access the measure or metric to measure these attributes and then justify it.
Bansal et al have reviewing and analyzing the object-oriented metrics, identify and validate object-oriented metrics [2]. Research results are four of the six metrics CK Metrics that WMC, NOC, CBO and the RFC is suitable for the complexities and quality measurement while the metric DIT and LCOM is not suitable measurement OO design. McNinch in another study [12] states that the Response for Class (RFC) is the Number of Remote Methods (NRM) + Number of Local Methods (NLM).
Dong measure and assess the ability of junior students majoring in engineering in innovation by using AHP-TOPSIS [7]. AHP method is used to set the weight value, and TOPSIS methods used to obtain the final value for ranking. Through these studies concluded that the AHP-TOPSIS is a model that can be used to measure innovation, the method is also simple and light to use.
Al Maliki et al used AHP-TOPSIS to find the most suitable location to serve as a place of research (Lead Pollution Study) [1]. This study was made to propose new procedures associated with site selection, to locate the most suitable of the six alternatives given, by combining the two methods of decision-making. AHP is used to determine the weight of the seven criteria, were selected based on human health, through pairwise comparisons. TOPSIS used to obtain the final value and the final ranking.
ISSN: 1992-8645 www.jatit.org E-ISSN: 1817-3195
expected that government officials can find out a lack of information provided through the website so that they can fix it. AHP method is used to determine the weight, while TOPSIS is used to determine the final value / ranking and Zaidan et al used integrated AHP-TOPSIS to evaluating and selecting EMR Software packages using multi criteria decision making[24].
3. RESEARCH METHODS
3.1 Methodology
Results of this study are expected to produce a method that can help users determine which is the best software of several software being evaluated. In this case study researchers used five open source web applications CMS e-commerce namely
Prestashop 1.6.0.4, Magento 1.7.0.2,
Woocommerce 2.3.7, Oscommerce 1.5.6, and Opencart 2.3.4. All software are tested without any
modifications. Measurement parameters of
traditional metrics and CK Metrics Suite done using tools analysis software named PHP depend. Three traditional metrics (CC, LOC, CP) and four CK
metrics suite ( WMC, DIT, NOC, CBO) are used to
measure the metrics and processed using AHP-TOPSIS. The security aspect of software is not calculated in this research.
To simplify the explanation, the research stages described in Figure 1.
Figure 1. Main Stages Research Methodology
The final result of this study is expected quantitative value of each web application that is found to be the representation of the web application quality ratings.
3.2. Weighting Traditional Metrics, CK Metrics Suite and Software Quality Factors
In the first stage using AHP to find the value weights [1],[7], the weighting parameters of traditional metrics and CK Metrics Suite and software quality factors in order to get the weight of each of these parameters. Results of weighting parameters are checked for consistency, if the value Consistency Ratio <0.1, then the result of the weighting can be used / received.
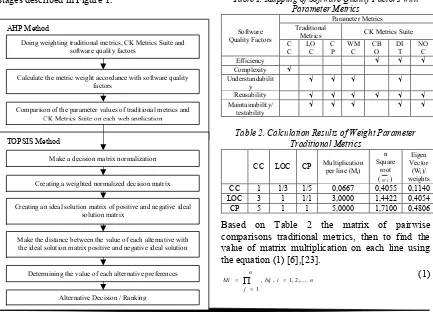
[image:3.612.92.525.434.746.2]Comparison of traditional metrics parameters and CK Metrics Suite guided by the scale Saaty. In comparing the parameters to consider objectivity of measurement. Mapping of Software Quality Factors with Parameter Metrics in Table 1. The mapping in the Table are used as a reference for determining the value of a variable pairwise comparison criteria on traditional parameters metrics.
Table 1. Mapping of Software Quality Factors with Parameter Metrics
Software Quality Factors
Parameter Metrics Traditional
Metrics CK Metrics Suite
C C
LO C
C P
WM C
CB O
DI T
NO C
Efficiency √ √ √
Complexity √
Understandabilit y
√ √ √ √
Reusability √ √ √ √ √ √
Maintainability/ testability
√ √ √ √ √
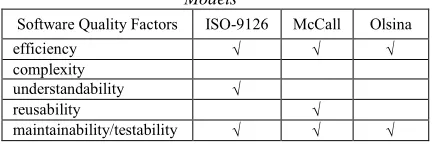
Table 2. Calculation Results of Weight Parameter Traditional Metrics
CC LOC CP Multiplication per line (M i)
n Square
root (Wi)
Eigen Vector (Wi)/
weights
CC 1 1/3 1/5 0,0667 0,4055 0,1140 LOC 3 1 1/1 3,0000 1,4422 0,4054 CP 5 1 1 5,0000 1,7100 0,4806
Based on Table 2 the matrix of pairwise comparisons traditional metrics, then to find the value of matrix multiplication on each line using the equation (1) [6],[23].
n i
bij n
j
Mi , , 1,2,...,
1 = =
= ∏ (1)
AHP Method
Doing weighting traditional metrics, CK Metrics Suite and software quality factors
Calculate the metric weight accordance with software quality factors
Comparison of the parameter values of traditional metrics and CK Metrics Suite on each web application
TOPSIS Method
Make a decision matrix normalization
Creating a weighted normalized decision matrix
Creating an ideal solution matrix of positive and negative ideal solution matrix
Make the distance between the value of each alternative with the ideal solution matrix positive and negative ideal solution
matrix
Determining the value of each alternative preferences
ISSN: 1992-8645 www.jatit.org E-ISSN: 1817-3195 0667 , 0 ) 5 / 1 ( ) 3 / 1 ( 1
1= x x =
M
To calculate M2, ..., M3 step is equal to M1. From
the results of matrix multiplication per line above,
then to calculate the square root of n Mi using
equation (2) [6],[23].
nMi
Wi = ,i=1,2,…,n (2)
4055 , 0 30,0667 1= =
W
To count W2
,…,
W3 step is equal to W1.
To perform normalization matrix, using the equation (3) [6],[23].
n i
n
j wi wi
Wi , 1,2,..., 1
/ ∑ =
=
= (3)
5577 , 3 7100 , 1 4422 , 1 4055 , 0
1= + + =
W 1140 , 0 5577 , 3 4055 , 0
1= =
W
To count W2,…,W3 the same step with the search
for value W1.
To find the value of Lamda Max, using the equation (4) [6],[23].
n i n j Wi n i
maks , 1,2,..., 1 1 = ∑ = ∑ = =
λ (4)
0291 , 3 4806 , 0 ) 1 1 2 , 0 (( ) 4054 , 0 ) 1 1 3333 , 0 (( ) 1140 , 0 ) 5 3 1 (( = + + + + + + + + = x x x maks λ
To find the value of Consistency Index (CI), using the equation (5) [6],[19],[23].
1 − − = n n maks CI λ (5) 0145 , 0 1 3 3 0291 , 3 = − − = CI
To find the value of Random Index (RI) based on the value of the Random Index (RI) in Table 3, for n = 3, then the value of Random Index (RI) = 0.58
Table 3. Random Index Value (RI) [6],[23]
n 1 2 3 4 5 6 7 8 9
RI 0,00 0,00 0,58 0,90 1,12 1,24 1,32 1,44 1,45
To find the value Consistency Ratio (CR), using the equation (6) [6],[19],[23].
RI CI
CR= (6)
0251 , 0 58 , 0 0145 , 0 = = CR
In accordance with the concept of AHP, if the value Consistency Ratio (CR) < 0.1, the value of the above comparison values obtained CR = 0.0251, less than 0.1, then the weighting parameters are acceptable.
[image:4.612.311.526.335.428.2]The next step is to calculate the weighting parameter CK Metrics Suite. To calculate weighting factors CK Metrics Suite steps are the same as traditional metrics calculating the weighting parameter. CK Metrics Suite is WMC, RFC, DIT, NOC and CBO suitable for evaluating the quality of software and object-oriented software quality measure at the level of class [2],[21]. Response for Class (RFC) is the Number of Remote Methods (NRM) + Number of Local Methods (NLM). This metric developed by Wei Li and Sallie Henry or known by the name of Li & Henry Metrics [10],[12], so that in this study only used four metrics of CK Metrics Suite is WMC, DIT, NOC and CBO.
Table 4. Calculation Results of Weighting Parameter CK Metrics Suite W M C D I T N O C C B O Multipli cation per line (Mi) n Square root (Wi)
Eigen Vector (Wi)/ weights
WMC 1 1 1 3 3,0000 1,3161 0,2818
DIT 1/1 1 3 5 15,0000 1,9680 0,4214
NOC 1/1 1/3 1 3 1,0000 1,0000 0,2141
CBO 1/3 1/5 1/3 1 0,0222 0,3861 0,0827
After the result Eigen Vector /weight, in each parameter CK Metrics Suite, then the consistency check. In this case the value of Lamda Max / λmaks = 4.1410, Number parameter 4, the obtained Consistency Index (CI) using the equation (5).
0470 , 0 1 4 4 1410 , 4 = − − = CI
To find the value of Random Index (RI) based on the value of the Random Index (RI) in Table 3, for n = 4, then the value of Random Index (RI) = 0.90.
To find the value Consistency Ratio (CR) using equation (6). 0522 , 0 90 , 0 0470 , 0 = = = RI CI CR
Value Consistency Ratio (CR) < 0.1, then the weighting parameters acceptable.
ISSN: 1992-8645 www.jatit.org E-ISSN: 1817-3195
Table 5. Mapping of Comparative Software Quality Models
Software Quality Factors ISO-9126 McCall Olsina
efficiency √ √ √
complexity
understandability √
reusability √
maintainability/testability √ √ √
In scoring comparison with regard to the use of software quality model of Table 5. The above can be sorted from the quality factors of software most
widely used by software quality models
are maintainability / testability, efficiency,
understandability, reusability and complexity. The next step is to calculate the parameter weighting factors of software quality. To calculate the factors of software quality steps the same as calculating the weighting parameter Traditional
Metrics.
Table 6. Calculation Results of Weighting Parameter Software Quality Factors
m
ai
nt
ai
n
abi
li
ty
/t
es
tabi
li
ty
ef
fi
ci
enc
y
unde
rs
tandabi
li
ty
re
u
sabi
li
ty
com
p
le
xi
ty
Multiplic ation per line (Mi)
n Square
root (W1)
Eigen Vector (Wi)/ weights
maintainability /
testability 1 2 5 5 7 350,0000 3,2271 0,4434 efficiency 1/2 1 5 5 7 87,5000 2,4457 0,3361 understandability 1/5 1/5 1 1 3 0,1200 0,6544 0,0899 reusability 1/5 1/5 1/1 1 3 0,1200 0,6544 0,0899 complexity 1/7 1/7 1/3 1/3 1 0,0023 0,2959 0,0407
After the result Eigen Vector / weight, for each parameter Software Quality Factors, necessary to check consistency. In this case the value of Lamda Max / λmax = 5.1483, number of parameters 5, the obtained Consistency Index (CI) using the equation (5).
0421 , 0 1 5
5 1683 , 5
= −
− =
CI
To find the value of Random Index (RI) based on the value of the Random Index (RI) in Table 3 for n = 5, then the value of Random Index (RI) = 1.12.
To find the value Consistency Ratio (CR) using equation (6).
0376 , 0 1200 , 1
0421 , 0
= = =
RI CI CR
In accordance with the concept of AHP, if the value Consistency Ratio (CR) < 0.1, the value of the above comparison values obtained CR = 0.0376, less than 0.1, then the weighting parameters are acceptable.
[image:5.612.89.305.159.231.2]Each parameter traditional metrics and CK Metrics Suite has a different contribution to the factors of quality software, so the metric can be calculated on the weight of each of the factors of software quality in accordance with Table 7.
Table 7. Metric Weight (MW) Calculation at Software Quality Factors
Software Quality Factors
Traditional Metrics and CK Metrics Suite Weight Parameter
Maintainability / Testability
((MW)CP + (MW)LOC + (MW)CC +(MW)WMC +
(MW)DIT +(MW)NOC)/6
Efficiency ((MW)CBO +(MW)DIT +(MW)NOC)/3
Understandability ((MW)CP + (MW)LOC +(MW)WMC +(MW)DIT)/4
Reusability ((MW)CP + (MW)LOC + (MW)WMC +( MW)CBO +
(MW)DIT +(MW)NOC)/6
Complexity (MW)CC
[image:5.612.90.313.368.498.2] [image:5.612.312.525.398.521.2]For more details, writers will enter the weight values of Table 2 and Table 4 using the equation in Table 7 so the results can be seen in Table 8.
Table 8. Metric Weight (MW) Calculation Result at Software Quality Factors
Software Quality Factors
Traditional Metrics and CK Metrics Suite Weight
Parameter
Metric Weight (MW) Maintainability /
Testability
( 0,1140 + 0,4050 + 0,4806 +
0,2818 + 0,4214 + 0,2141 )/6 0,3195 Efficiency ( 0,0827 + 0,4214 + 0,2141 )/3 0,2394
Understandability ( 0,4806 + 0,4050 + 0,2818 +
0,4214)/4 0,3972
Reusability ( 0,4806 + 0,4050 + 0,2818 +
0,0827 + 0,4214 + 0,2141)/6 0,3143
Complexity 0,1140 0,1140
[image:5.612.314.523.634.728.2]The final value weighting is used to find the final value / rank using TOPSIS method for determining the quality of the software produced by the equation in Table 9.
Table 9. The End Calculation Weight of Software Quality Factors
Software Quality Factors
Quality Weight (QW) x Metric Weight (MW)
Maintainability / Testability
(QW)Maintainability/Testabilityx
(MW)Maintainability/Testability
Efficiency (QW)Efficiency x(MW)Efficiency
Understandability (QW)Understandability x(MW) Understandability
ISSN: 1992-8645 www.jatit.org E-ISSN: 1817-3195 Complexity (QW) Complexity x(MW) Complexity
[image:6.612.90.302.192.287.2]For more details, the writer will include the value of Table 6 and Table 8 using the equation that is in Table 7 so that the results can be seen in Table 10.
Table 10. Calculation Result Weight Final on Software Quality Factors
Software Quality Factors
Quality Weight (QW) x
Metric Weight (MW) Final Weight Maintainability /
Testability ( 0,4434 x 0,3195 ) 0,1417 Efficiency ( 0,3361 x 0,2394 ) 0,0805
Understandability ( 0,0899 x 0,3972 ) 0,0357
Reusability ( 0,0899 x 0,3143) 0,0283
Complexity ( 0,0407 x 0,1140 ) 0,0046
4. RESULT DISCUSSION AND EVALUATION
4.1 Measurement Result
[image:6.612.312.527.374.517.2]By using the PHP Depend, traditional metrics value measurement results and CK Metrics Suite of five open source web applications CMS e-commerce is shown in Table 11.
Table 11. The Results of Measurement Traditional Metrics and CK Metrics Suite on each Web Application
Metric Name
P
ar
am
et
er
M
et
ri
c
P
re
st
as
ho
p
M
age
nt
o
W
ooc
om
m
e
rc
e
O
sc
om
m
er
ce
O
p
enc
ar
t
Traditional Metrics
CC 54,3472 12,6594 29,6294 23,3063 28,1069 LOC 377,7358 110,3943 247,5175 156,3100 214,0554 CP 43,4410 29,4527 53,3636 14,3506 3,0238
CK Metrics
Suite
WMC 65,1419 13,9196 34,5035 26,5646 31,5723 DIT 1,7009 1,8467 1,0699 0,4391 2,0337
NOC 0,0000 0,0000 0,2203 0,0849 0,0000
CBO 1,7686 0,8863 0,9930 0,7417 0,2693
Number of classes in each of the web applications after calculation by using PHP Depend can be seen in the following Table 12.
Table 12. Class Number on Each Web Application
No. Web Applications Number of Classes
1 Prestashop 1.6.0.4 458
2 Magento 1.7.0.2 3086
3 Woocommerce 2.3.7 286
4 Oscommerce 2.3.4 271
5 Opencart 1.5.6 505
4.2. Comparison Value Parameter of
Traditional Metrics and CK Metrics Suite on Each Web Application
After doing measurement parameters of traditional metrics and CK Metrics Suite carried out a comparison between a web application by using one of the parameters of traditional metrics or CK Metrics Suite. The parameter value is inversely related to software quality factors [8],[18]. Then the comparison is necessary to inverse. So if a web application-1 CC = a, web application-2 CC = b and web application-3 CC = c, then the comparison is shown in Table 13.
Table 13. Comparison of Parameters Metric Each Web Application
CC Web Application -1 Web Application -2 Web Application -3
Web Application -1 1 1/(a/b) 1/(a/c)
Web Application -2 1/(1/(a/b)) 1 1/(b/c) Web Application -3 1/(1/(a/c)) 1/(1/(b/c)) 1
On the web application-1 compared with web applications-2 is a / b as factors of software quality is inversely proportional to the value of the parameter that should be in inverse becomes 1 / (a / b). Table 14 in the comparison CC in each web application, values based on Table 11.
Table 14. Parameter Comparison of CC in Each Web Application
CC
P
re
st
as
ho
p
M
age
nt
o
W
ooc
om
m
e
rc
e
O
sc
om
m
er
ce
O
p
enc
ar
t
Prestashop 1 1/(54,3472 /12,6594)
1/(54,3472 /29,6294)
1/(54,3472 /23,3063)
1/(54,3472 /28,1069)
Magento 1/(1/(54,3472 /12,6594)) 1
1/ (12,6594 /29,6294)
1/(12,6594 /23,3063)
1/(12,6594 /28,1069) Woo
commerce
1/(1/(54,3472 /29,6294))
1/(1/(12,6594 /29,6294)) 1
1/(29,6294 /23,3063)
1/(29,6294/ 28,1069) Os
commerce
1/(1/(54,3472 /23,3063))
1/(1/(12,6594 /23,3063))
1/(1/(29,6294 /23,3063)) 1
1/(23,3063 /28,1069)
Opencart 1/(1/(54,3472 /28,1069))
1/(1/(12,6594 /28,1069))
1/(1/(29,6294/ 28,1069))
11/(1/(23,3063 /28,1069)) 1
[image:6.612.90.303.423.560.2]In the Table 15 is a comparison between the values of each web application against CC parameter, its value is based on Table 14.
Table 15. Results Comparison of CC on each Web Application
CC
P
re
st
as
ho
p
M
age
nt
o
W
ooc
om
m
e
rc
e
O
sc
om
m
er
ce
O
p
enc
ar
t
Prestashop 1 0,2329 0,5452 0,4288 0,5172 Magento 4,2930 1 2,3405 1,8410 2,2202
Woocommerce 1,8342 0,4273 1 0,7866 1,206 Oscommerce 2,3319 0,5432 1,2713 1 1,206
Opencart 1,9336 0,4504 0,8292 0,8292 1
[image:6.612.312.525.564.679.2]ISSN: 1992-8645 www.jatit.org E-ISSN: 1817-3195
0282 , 0 5172 , 0 4288 , 0 5452 , 0 2329 , 0 1
1= x x x x =
M
To calculate M2, ..., M5 step is equal to M1. From the results of matrix multiplication per line above,
then to calculate the square root of n Mi using
equation (2).
4897 , 0 50,0282 1= =
W
To calculate W2
,…,
W5 the same step with W1.
To perform normalization matrix, using equation (3).
5790 , 5 9025 , 0 1419 , 1 9424 , 0 1024 , 2 4897 , 0
1= + + + + =
W
0878 , 0 5790 , 5
4897 , 0
1= =
W
To calculate W2, ..., W5 same step by finding the
value of W1. The overall result can be seen in Table
[image:7.612.304.529.85.164.2]16.
Table 16. The Results Comparative Evaluation of CC Parameter Values on Each Web Application
CC Multiplication per line (Mi) root (n Square
1
W )
Eigen Vector (Wi)/
Evaluation Factor Prestashop 0,0282 0,4897 0,0878 Magento 41,0709 2,1024 0,3768 Woocommerce 0,7434 0,9424 0,1689 Oscommerce 1,9419 1,1419 0,2047 Opencart 0,5988 0,9025 0,1618
In the Table 16 above than 5 web applications. In
the CC evaluation factors Magento web
applications have the highest value. This indicates that the web application Magento has the complexities of the algorithms in the method are high. Then the second order to fifth are
Oscommerce, Wocommerce, Opencart, and
Prestashop.
The same steps in the process of comparison CC, conducted for the comparison process parameter LOC, CP, WMC, DIT and CBO on each web application. In this study, the NOC evaluation was not conducted due to NOC parameter value to the web application Prestashop, Magento, and Opencart is zero, so it can not be evaluated using AHP method. The overall results of evaluation factor parameter for each Web application see in Table 17.
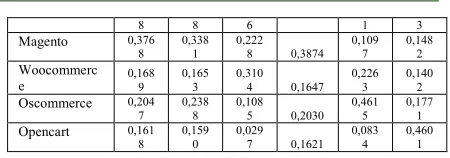
Table 17. Comparison of Value Parameter Traditional Metrics and CK Metrics Suite on each Web
Application
Evaluation Factors
CC LOC CP WM
C DIT CB
O
Prestashop 0,087 0,098 0,328 0,0828 0,119 0,074
8 8 6 1 3
Magento 0,376
8 0,338
1 0,222
8 0,3874 0,109
7 0,148
2
Woocommerc e
0,168 9
0,165 3
0,310 4 0,1647
0,226 3
0,140 2
Oscommerce 0,204
7 0,238
8 0,108
5 0,2030 0,461
5 0,177
1
Opencart 0,161
8 0,159
0 0,029
7 0,1621 0,083
4 0,460
1
In general, the parameters of traditional metrics and CK Metrics Suite has a tendency inversely related to software quality factors. The smaller the value of the parameters of traditional metrics and CK Metrics Suite, the better the quality of the software. Except for the parameters Comment Percentage (CP) the bigger the better, but the percentage of comments about 30% of the most effective because it can help web developers [19].
In the Table 17 parameter value is the ratio of traditional metrics and CK metrics suite for each web application. In the evaluation factors Cyclomatic Complexity (CC) is the lowest value Prestashop. As explained previously that a method with the lower value of the parameter CC is usually better. Evaluation factor Line Of Code (LOC) that the highest value is Magento, this indicates that the number of lines of code owned by Magento most so will result in increasing the size of the file. The file size is too high is not good for an application. Evaluation factors Comment Percentage (CP) or Comment Line of Code (CLOC) web application Prestashop and Woocommerce have comment lines that most so good enough for the developer and manager of the web. In the evaluation factors Weighted Methods per Class (WMC) values were highest in Magento web application. WMC’s value is too high on a software application; it has the tendency of failure. In the evaluation factors parameter Depth of Inheritance Tree (DIT) is the highest value on Oscommerce applications. A class hiracki deep (big DIT) also leads to more complexity stimulation. The plus side of DIT great value implies that many methods can be reused (reuse). Evaluation Factor parameter Coupling Between Object Classes (CBO) the highest value on the application Opencart. This indicates that Opencart has many classes that interdependence between one class to another class. It also led to inconsistencies in the level of interdependency between the modules in an application.
4.3. Looking for Final Score Ranking of the TOPSIS Method
ISSN: 1992-8645 www.jatit.org E-ISSN: 1817-3195
Metrics Suite and the weighting process of software quality factors using AHP. The next process is to look for an alternative final value decision / rank using TOPSIS method [1],[7]. Preliminary data from the result of measurement metrics traditional parameters and CK Metrics Suite on each web application.
54,3472 12,6594 29,6294 23,3063 28,1069 54,3472
377,7358 110,3943 247,5175 156,3100 214,0554 377,7358
43,4410 29,4527 53,3636 14,3506 3,0238 43,4410
65,1419 13,9196 34,5035 26,5646 31,5723 65,1419
1,7009 1,8467 1,0699 0,4391 2,0337 1,7009
0,0000 0,0000 0,2203 0,0849 0,0000 0,0000
1,7686 0,8863 0,9930 0,7417 0,2693 1,7686
TOPSIS require performance rating for each alternative on each criterion are normalized according to the equation (7) [6],[9].
n j
m i
m i Xij
Xij
rij , 1,2,..., ; 1,2,...,
0
= =
∑ =
= (7)
Calculation to obtain the total Xi12 are:
5611 , 775 . 151 ) 7686 ,
1 2
( ) 0000 ,
0 2
( ) 7009 ,
1 2
(
) 1419 ,
65 2
( ) 4410 ,
43 2
( ) 7358 ,
377 2
( ) 3472 ,
54 2
(( 7 1
= +
+
+ +
+ +
=
∑ Xij
The same way to get a total Xi22, ..., Xi52.
1395 , 0 5611 , 744 . 151
3472 , 54
= =
rij
The same way done to get performance rating for :
r21 ... r51; r12 ... R52; ...; r15 ... r55
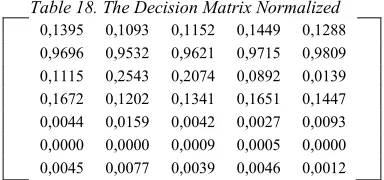
[image:8.612.312.526.376.500.2]The overall results were normalized decision matrix can be seen in Table 18.
Table 18. The Decision Matrix Normalized
0,1395 0,1093 0,1152 0,1449 0,1288 0,9696 0,9532 0,9621 0,9715 0,9809 0,1115 0,2543 0,2074 0,0892 0,0139 0,1672 0,1202 0,1341 0,1651 0,1447 0,0044 0,0159 0,0042 0,0027 0,0093 0,0000 0,0000 0,0009 0,0005 0,0000 0,0045 0,0077 0,0039 0,0046 0,0012
As has been explained previously that each parameter traditional metrics and CK Metrics Suite have contributed differently to the factors of quality software, so that on each of the factors of software quality calculated in accordance with their
respective contributions using the equation view Table 7. Here is counting factors in software quality web applications Prestashop :
Maintainability/ testability
= ((BM)CP + (BM)LOC + (BM)CC +(BM)WMC +
(BM)DIT +(BM)NOC)/6
= (0,1115 + 0,9696 + 0,1395 + 0,1672 + 0,0044 + 0,0000)/6
= 0,2320
Efficiency = ((BM)CBO +(BM)DIT +(BM)NOC)/3
= (0,0045 + 0,0044 + 0,0000 )/3 = 0,0030
Understandability = ((BM)CP + (BM)LOC +(BM)WMC +(BM)DIT)/4
= (0,1115 + 0,9696 + 0,1672 + 0,0044 )/4 = 0,3132
Reusability = ((BM)CP + (BM)LOC + (BM)WMC +(BM)CBO +
(BM)DIT +(BM)NOC)/6
= (0,1115 + 0,9696 + 0,1672 + 0,0045 + 0,0044 + 0,0000 )/6
= 0,2095
Complexity = (BM)CC
= 0,1395
The results can be seen in Table 19. The column Prestashop. The same way that is done to calculate the software quality factors of other web application namely Magento, Woocommerce, Oscommerce, and Opencart.
Table 19. Weighting Software Quality Factors at Each Web Application
P
re
st
as
ho
p
M
age
nt
o
W
ooc
om
m
e
rc
e
O
sc
om
m
er
ce
O
p
enc
ar
t
Maintainability /
Testability 0,2320 0,2422 0,2373 0,2290 0,2129 Efficiency 0,0030 0,0079 0,0030 0,0026 0,0035
Understandability 0,3132 0,3359 0,3270 0,3071 0,2872 Reusability 0,2095 0,2252 0,2188 0,2056 0,1917
Complexity 0,1395 0,1093 0,1152 0,1449 0,1288
Make a decision matrix that is normalized
weighted, with weights W = (W1, W2, ..., Wn) is the
weighting parameter criteria (eigen vector) obtained in the calculation process AHP, where W = (0,1417; 0,0805; 0,0357; 0,0283; 0,0046).
Results are normalized weighted decision Y11 is as
follows (can be seen in Table 21, the shaded part):
Y = w1 x r11 = 0,1417 x 0,2320 = 0,0329
The same way done to get the value of:
Y21…Y51 ; Y12…Y52 ; … ; Y15…Y55
The overall results were normalized weighted decision matrix can be seen in Table 20.
Table 20. Weighted Normalized Decision Matrix
[image:8.612.102.294.560.650.2]ISSN: 1992-8645 www.jatit.org E-ISSN: 1817-3195 0,0112 0,0120 0,0117 0,0110 0,0103
0,0059 0,0064 0,0062 0,0058 0,0054 0,0006 0,0005 0,0005 0,0007 0,0006
Determining the ideal solution matrix and matrix solutions positive negative. The ideal solution
notation with A+ positive and negative ideal
solution is denoted by A-, positive to find the ideal
solution is as follows:
Y1 +
= Max (0,0329; 0,0002; 0,0112; 0,0059; 0,0006)
= 0,0329
The same way done to get the value Y2+,…, Y5+, so
the ideal positive solution matrix is as follows:
A+ = [ 0,0329 ; 0,0343 ; 0,0336 ; 0,0324 ; 0,0302 ]
To find a negative ideal solution is as follows:
Y1- = Max (0,0329; 0,0002; 0,0112; 0,0059; 0,0006)
= 0,0002
The same way done to get the value Y2-,…, Y5-, so the negative ideal solution matrix is as follows:
A- = [ 0,0002 ; 0,0005 ; 0,0002 ; 0,0002 ; 0,0003 ]
Calculates the distance between the alternative with ideal positive solution, using equation (8) below [6,9]:
m i
D i
n
j 1 Yj Yij , 1,2,...,
2 ) ( = = +
∑
= + − (8) )2 0302 , 0 0302 , 0 ( )2 0324 , 0 0324 , 0 ( )2 0336 , 0 0336 , 0 ( )2 0343 , 0 0343 , 0 ( )2 0329 , 0 0329 , 0 ( 1 − + − + − + − + − = + D 0000 , 0 = + D iThe same way is done to get the value D3+,…, D5+.
The overall result can be seen in Table 21. Calculates the distance between the alternative with ideal negative solution, using equation (9) below [6],[9]:
m i
D i n
j 1 Yij Yi , 1,2,...,
2 ) ( = = −
∑
= + − (9) )2 0003 , 0 0302 , 0 ( )2 002 , 0 0324 , 0 ( )2 0002 , 0 0336 , 0 ( )2 0005 , 0 0343 , 0 ( )2 0002 , 0 0329 , 0 ( 1 − + − + − + − + − = − D 07247 , 0 = − DiThe same way done to get the value D3-,…, D5-. The
overall result can be seen in Table 21. To determine the value of the preference for each alternative (Vi), using equation (10) is as follows [6],[9]:
D i D i D i Vi + + − = _ ,i=1,2,…,m (10) 00000 , 1 0000 , 0 07247 , 0 07247 , 0 = + = Vi
The same way is done to get the value V2 …V5. The
overall result can be seen in Table 21.
Table 21. Preference Results with TOPSIS Method
Application Web Name D+ D- Vi
Prestashop 0,00000 0,07247 1,00000 Magento 0,07242 0,00013 0,00173 Woocommerce 0,04803 0,02445 0,33732 Oscommerce 0,05984 0,01263 0,17429 Opencart 0,07182 0,00075 0,01037
Table 21 is the result of a preference by using TOPSIS of each web application.
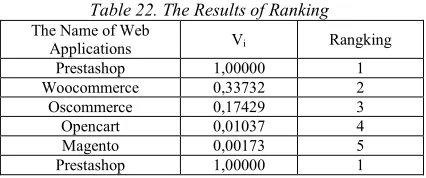
Table 22. The Results of Ranking
The Name of Web
Applications Vi Rangking
Prestashop 1,00000 1
Woocommerce 0,33732 2
Oscommerce 0,17429 3
Opencart 0,01037 4
Magento 0,00173 5
Prestashop 1,00000 1
Table 22 is result on rank, it can be concluded that in accordance with the concept of TOPSIS that
the higher the value Vi, the higher / better
preference for the alternative. From the aspect of object oriented design models using traditional metrics, CK Metrics Suite and factors of quality of design software, web applications Prestashop with 1,00,000 best value quality of other web applications. Whereas most of lace is a Magento web applications with a value of 0.00173.
4.4 Recomendation
Based on the analysis and the measurement of the quality of web application software (Prestashop,
Magento, Woocommerce, Oscommerce, and
Opencart), then obtained some recommendations for the three stakeholders. The recommendations are as follows:
1.The evaluation result CBO parameters for each
web application; Opencart has the highest value. This indicates that Opencart has many classes that interdependence between one class to another class, so the show is not good for an
application It also leads to inconsistent level of
[image:9.612.313.526.288.377.2]ISSN: 1992-8645 www.jatit.org E-ISSN: 1817-3195
software. DIT parameter evaluation results for each web application Oscommerce has the highest value. This indicates that the depth of the greatest hierarchy Oscommerce application, so that high-level complexity. LOC on each web application. Prestashop has the highest value. This indicates that the web application has a size of high Prestashop. The number of lines / size high will result in increasing the number of files.
2.Prestashop is recommended to businesses to use ,
because it has the best quality among
e-commerce web application (Magento,
Woocommerce, Oscommerce, and Opencart).
3.For the Layman if the purpose for learning
programming are advised to use Prestashop and Woocommerce, because they have a more complete commentary. If the goal for business recommended use Prestashop, because of its good quality. For those who've never used before for example CMS wordpress CMS
advised can use Woocommerce because
Woocommerce is the development of CMS wordpress.
4.5 Evaluation
The software quality is one of complex problems, thus multi criteria decision making method is one of the solutions. Using of traditional and CK metrics and AHP-TOPSIS to calculated of software quality is significant different from with previous research work. Depth research and comparison the result test using same testing software with different methods are needed to get more facts and merits or demerits for this methods.
5.
CONCLUSIONS
Based on the research that has been done, it can be concluded that the quality of web applications Prestashop most excellent quality of other web applications because it has the highest preference value namely 1,00,000. In accordance with the concept of TOPSIS that the higher is the preference value, the higher / better alternative (app) is. While the lowest level of quality is a Magento web applications with a value of 0.00173.
The results of the evaluation factors parameter value comparison Cyclomatic Complexity (CC) on each web application, Prestashop has the smallest value. A low value on the CC indicates the application is better than on other web application.
In the comparison of the results to the evaluation factors parameter values; Comment Percentage (CP) Prestashop and Woocommerce web applications have the highest value. This
indicates that the web application Prestashop a complete have comments, so good enough for web developers to build e-commerce web application.
The results of the evaluation factors comparison Weight Method per class (WMC) on each web application, Prestashop has the smallest value. It shows that the web application software Prestashop has a low failure rate.
The results of the comparison evaluation parameter values Coupling Between Object Classes (CBO) on each web application, Prestashop has the smallest value. The smaller is the value of CBO, the fewer classes that relate the class a good show. Class are not dependent on each other to be better used in an application.
More research needs to be developed to implement object oriented design metrics like MOOD metrics suite or the incorporation of other metrics for example Li & Henry metrics. Using a combination of methods other than AHP with TOPSIS and involves many factors evaluation.
REFERENCES :
[1] Ali Al Maliki, Gary Owens, and David Bruce,
“Combining AHP and TOPSIS Approaches to Support Site Selection for a Lead Pollution
Study”, 2012 2nd International Conference on
Environmental and Agriculture Engineering IPCBEE, Vol. 37, 2012, pp. 1-9.
[2] Mukesh Bansal and C. P. Agrawal, “Critical
Analysis of Object Oriented Metrics in
Software Development”, 2014 Fourth
International Conference on Advanced
Computing & Communication Technologies,
IEEE Xplore, 978-1-4799-4910-6/14, pp.
197-201.
[3] Ritu Chauhan, Rahul Singh, Ashish Saraswat,
Anwar Husain Joya, and Vinit Kumar Gunjan, “Estimation of Software Quality using Object
Oriented Design Metrics”, International
Journal of Innovative Research in Computer and Communication Engineering, An ISO 3297:2007 Certified Organization, Vol. 2, Issue 1, January 2014, pp. 2581-2586.
[4] Shyam R. Chidamber and Chris F. Kemerer,
“Towards a Metrics Suite for Object Oriented
Design”, Proceeding Sixth OOPSLA
Conference, 1991, pp. 197-211.
[5] Shyam R. Chidamber and Chris F. Kemerer,
“A Metrics Suite for Object Oriented Design”,
IEEE Transactions on Software Engineering, Vol. 20, Issue: 6, Jun 1994, pp. 476-493.
[6] Yin Chun, Huang Yan-yan,Wang Zhi-quan,
“Topsis-AHP-Simulation Method and Its
ISSN: 1992-8645 www.jatit.org E-ISSN: 1817-3195
Evaluation”, 2009 Chinese Control and
Decision Conference (CCDC 2009), 978-1-4244-2723-9/09, pp. 2954-2957.
[7] Dong Chunhua, “Innovation Capacity
Appraisal of Junior College Engineering
Students Based on AHP-TOPSIS”,
Communication Software and Networks (ICCSN), 2011 IEEE 3rd International Conference, IEEE Xplore, 978-1-61284-486-2/111, pp. 85-88.
[8] Efano Hermawan and Petrus Mursanto,
“Pemeringkatan Software Aplikasi
Berdasarkan Properti Kualitas Disain dan
Metrics for Object Oriented Software
Menggunakan Analytic Hierarchy Process”,
Journal of Information System, Vol. 5, Issue 1, April 2009, pp. 1-7.
[9] Chen Zhao Jiang and Zhang Yan, “Application
of TOPSIS Analysis Method Based on AHP in Bid Evaluation of Power Equipment”,
Information and Financial Engineering (ICIFE), 2010 2nd IEEE International Conference, IEEE Xplore, 978-1-4244-6928-4/10, pp. 193-196.
[10] Wei Li and Sallie Henry,
“
MaintenanceMetrics for The Object Oriented Paradigm”,
Software Metrics Symposium, 1993. Proceedings., First International, IEEE Xplore, 0-8186-3740-4/93, pp. 52-60.
[11] Jim A. McCall, Paul K. Richards, and Gene F. Walters, "Factors in Software Quality: Concept and Definitions of Software Quality",
RADC-TR-77-369, Vol. 1 (of three), Final
Technical Report, November 1977, pp. 1-168.
[12] Craig A. McNinch, “Measuring and
Quantifying Web Application Design”,Thesis,
Master of Science In Computer Science, The University of Montana, Missoula, July 2012, pp. 1-56.
[13] Chahat Monga, Aman Jatain, and Deepti Gaur,
“
Impact of Quality Attributes on SoftwareReusability and Metrics to Assess These
Attributes”, IEEE Advance Computing
Conference (IACC), 978-1-4799-2572-8/14, pp. 1430-1434.
[14] V. Okanovic, “Web Application Development
with Component Frameworks”, Information
and Communication Technology, Electronics and Microelectronics (MIPRO), 2014, IEEE Xplore, pp. 889-892.
[15] Wayan Gede Suka Parwita, Luh Arida Ayu Rahning Putri, “Komponen Penilaian Kualitas
Perangkat Lunak Berdasarkan Software
Quality Models”, Seminar Nasional Teknologi
Informasi & Komunikasi Terapan 2012 (Semantik 2012), 23 Juni 2012, pp. 89-94. [16] Roger S. Pressman, “Software Engineering A
Practitioner’s Approach”, Seventh Edition, McGraw Hill, New York, 2010.
[17] Roger S. Pressman, David Lowe, “Web Engineering A Practitioner’s Approach”, McGraw Hill, New York, 2009.
[18] Linda H. Rosenberg, “Applying and
Interpreting Object Oriented Metrics”,
Proceedings of Software Technology
Conference, April 1998.
[19] Linda H. Rosenberg and Lawrence E. Hyatt, 2001, “Software Quality Metrics for
Object-Oriented Environments”, NASA Technical
Report SATC, No.1, pp 11-58.
[20] Thomas L. Saaty, “How to Make a Decition :
The Analytic Hierarchy Process”, European
Journal of Operational Research, Vol. 48, Issue 1, 5 September 1990, pp. 9–26.
[21] Aman Kumar Sharma, Arvind Kalia, and Hardeep Singh, “Metrics Identification for Measuring Object Oriented Software Quality”, International Journal of Soft Computing and Engineering (IJSCE), Vol. 2, Issue 5, November 2012, pp. 255-258.
[22] Sandeep Srivastava and Ram Kumar, “Indirect Method to Measure Software Quality using
CK-OO Suite”, 2013 International Conference
on Intelligent Systems and Signal Processing (ISSP), IEEE Xplore, 978-1-4799-0317-7/13, pp. 47-51.
[23] Fangjuan Zhu and Ye Liu, "Assessment of the
Information Disclosure Level about
Government Website Through AHP-TOPSIS
Method”, 2011 International Conference of
Information Technology, Computer Engineering and Management Sciences, IEEE Xplore, 978-0-7695-4522-6/11, pp. 179-181 [24] Zaidan, A. A., et al. "Evaluation and selection
of open-source EMR software packages based on integrated AHP and TOPSIS", 2015,