IJPSR (2016), Vol. 7, Issue 3 (Research Article)
Received on 30 September, 2015; received in revised form, 04 December, 2015; accepted, 25 February, 2016; published 01 March, 2016
HIGH THROUGHPUT LC-MS/MSMETHOD FOR THE QUANTITATION OF LINAGLIPTIN IN HUMAN PLASMA BY SOLID PHASE EXTRACTION USING 96 WELL PLATE FORMAT
Tangudu Nagabhusana Rao*, Guntuku Girija Sankar and Lade Jyothi Rani
College of Pharmaceutical Sciences, Andhra University, Visakhapatnam, Andhra Pradesh - 530003 India. Mallareddy Institute of Pharmaceutical Sciences, Dhulapally, Secunderabad, India.
ABSTRACT: High-throughput Liquid chromatography–mass spectrometry method has been developed and validated for the quantification of Linagliptin in human plasma using Linagliptin D4 as an internal standard (ISTD). Following solid phase extraction (SPE) in 96 well plate format, the analyte and ISTD were run on phenyl hexyl, 100A 100 X 4.6mm, 2.6µusing an isocratic mobile phase consisting of 10mM Ammonium formate buffer (pH 6.5 ± 0.5): Methanol 15:85 v/v. The precursor and productions of the drugs were monitored on a triple quadrupole instrument operated in the positive ionization mode. The method was validated over a concentration range of 99.532-10045.049pg/mL with relative recoveries ranging from 69.9 to 77.1%. The inter batch precision (%CV) across three validation runs was≤ 2.9%.The Inter batch accuracy determined at four QC levels (LLOQ, LQC, MQC and HQC) was between 95.2–102.7%. According to the validated results, the proposed method was found to be specific, accurate, precise and high throughput method and could be used for the estimation of Linagliptin in human plasma and can be applied for the routine analysis.
INTRODUCTION: Linagliptin is an oral drug that reduces blood sugar (glucose) levels in patients with type 2 diabetes 1. Linagliptin is a member of a class of drugs that inhibit the enzyme, dipeptidyl peptidase-4 (DPP-4). Other members of this class include sitagliptin (Januvia), and saxagliptin (Onglyza).
QUICK RESPONSE CODE
DOI:
10.13040/IJPSR.0975-8232.7(3).1321-30
Article can be accessed online on:
www.ijpsr.com
DOI link: http://dx.doi.org/10.13040/IJPSR.0975-8232.7 (3).1321-30
Following a meal, incretin hormones such as glucagon-like peptide-1 (GLP-1) and
glucose-dependent insulin tropic
polypeptide (GIP) are released from the intestine, and their levels increase in the blood. GLP-1 and GIP reduce blood glucose by increasing the production and release of insulin from the pancreas.
GLP-1 also reduces blood glucose by reducing the secretion by the pancreas of the hormone, glucagon, a hormone that increases the production of glucose by the liver and raises the blood level of glucose. The net effect of increased release of GLP-1 and GIP is to reduce blood glucose levels. Linagliptin inhibits the enzyme, Key words:
Linagliptin,
Linagliptin D4, Solid Phase Extraction and 96 well plates
Correspondence to Author: Tangudu Nagabhusana Rao Sr. Scientist II
Nektar Therapeutics (India) Pvt Ltd. Sy Nos. 101/2, Genome Valley, Lalgadi Malakpet, Shameerpet Mandal, Hyderabad, R.R. District, Telangana - 500078, India
DPP-4, that destroys GLP-1 and GIP and thereby increases the levels and activity of both hormones. As a result, levels of GLP-1 and GIP in the blood remain higher, and blood glucose levels fall 2-5. In summary, Linagliptin reduces blood glucose levels by inhibiting DPP-4 and increasing the levels of GLP-1 and GIP. Linagliptin was approved by the FDA in May 20116-10.
FIG.1: STRUCTURE OF LINAGLIPTIN
Linagliptin may be taken with or without food. The recommended dose is 5 mg/day.
The most common side effects of
Linagliptin are stuffy or runny nose and sore throat. Hypoglycemia may occur when Linagliptin is combined with insulin or a sulfonylurea-type drug. Allergic reactions and muscle pain also may occur. Pancreatitis also has been reported.
Rifampin decreases the blood
concentration of Linagliptin by stimulating break down of Linagliptin by CYP3A4 liver enzymes. Other drugs that increase activity CYP3A4 may also reduce the blood concentration of Linagliptin. Very few methods have been developed for the estimation of Linagliptin in human plasma by LC-MS/MS. The aim of the present work was to develop and validate the high throughput LC-MS/MS Method using solid phase extraction technique as per the US FDA guidelines 11 to quantify the Linagliptin in human plasma using Linagliptin D4 as an internal standard.
Experimental:
Chemicals and reagents:
Working standards of Linagliptin and Linagliptin d4 were obtained from Aurobindo Pharma Ltd. (Hyderabad,
India). LC–MS grade methanol and
acetonitrile were purchased from Thermo Fisher Scientific India Pvt. Ltd. (Mumbai, India). GR grade ammonium formate was pro-cured from Merck Specialties Pvt.
Ltd. (Mumbai, India). GR grade
orthophosphoric acid was purchased from Merck. HPLC water was obtained from
Milli-Q water purification system
(Millipore). Human plasma containing K2 EDTA anticoagulant was obtained from Doctor’s pathological lab (Hyderabad, India). Waters Oasis HLB 96 well plates 30 µm (10 mg) were purchased from Waters Corporation (Milford, MA, USA).
Instrumentation:
Agilent 1200 Series equipped with a binary pump for solvent delivery was used for the analysis. Mass spectrometric detection
was performed on API-4000 triple
quadrupole mass spectrometer (MDS
SCIEX, Toronto, Canada) equipped with turbo ion spray inter- face. Quantitation was performed in multiple reaction monitoring (MRM) mode and Analyst software version 1.4.2 (SCIEX) was used for controlling the hardware and data handling.
Chromatographic conditions:
Chromatographic separation was
performed on Kinetex phenyl hexyl, 100A 100 X 4.6mm, 2.6µ analytical column. Isocratic mobile phase consisting of 10mM Ammonium formate buffer (pH 6.5 ± 0.5): Methanol 15:85 v/v was delivered at a flow rate of 0.8 mL/min. The auto sampler was set at 10⁰C±2⁰C and the injection volume was 10 µL. The column oven temperature was set at35.0 ± 2.0°C. Retention Time of Linagliptin was 1.98 and Linagliptin D4 was 1.97. The total chromatographic run time was 3.2 min.
MRM CONDITIONS
Parameters Q1 (amu) Q3 (amu) Dwell Time
(msec)
DP (volts)
CE (volts)
CXP (volts) EP
(volts)
Linagliptin 473.3 420.2 200 100 32 10 12
Linagliptin D4 477.4 424.2 200 100 32 10 12
Source/ Gas parameters
Parameters CUR
(psi)
GS1 (psi)
GS2 (psi)
IS (Volts)
CAD (psi)
TEMP (°C)
Source/Gas 40 45 40 5500 6 475
Preparation of calibration standards and quality control samples:
Standard stock solutions of Linagliptin and internal standard (Linagliptin D4) were prepared by dissolving their accurately weighed amounts in methanol to give a final concentration of 1 mg/mL. Individual working solutions of analyte were prepared by appropriate dilution of their stock solutions in 50% acetonitrile. All the solutions were stored in refrigerator at below 10ºC and were brought to room temperature before use. Working solution of internal standard (Linagliptin, 20 ng/mL) was prepared daily in 50% acetonitrile and was stored at room temperature.
Calibration standards and quality control (QC) samples were prepared by spiking blank plasma with the working solutions (5%) prepared from independent stock weighing’s. K2 EDTA anticoagulant blank plasma collected from healthy volunteers was screened individually and pooled before use. Calibration standards were prepared at concentrations of 99.532, 199.063, 398.127, 1029.005, 2058.010, 4410.022, 8085.040, 10045.049 pg/mL. Quality control samples were prepared at 99.532pg/mL (LLOQ QC), 287.11pg/mL
(LQC), 4116.020pg/mL (MQC) and
7350.036 pg/mL (HQC).
Sample Preparation:
Calibration standards, QC’s were processed using Ezypress Positive Pressure SPE Manifold by using 100 µL of Plasma Volume. For CC and QC spike 5 µL of each working solutions of Linagliptin into
190 µL of human plasma. Aliquot 100 µL of spiked plasma for CC’s and QC’s preparation.
Add 10 µL of internal standard to each tube except for blank plasma samples.
Add 10 µL of 50:50v/v MeoH: Water to blank plasma samples
Add 400 µL of 0.5% OPA solution to each tube and vortex.
Condition the Waters Oasis HLB 96 well plate 30 µm (10 mg) with 500µL of methanol followed by 500 µL of Milli Q water.
Load the samples onto the cartridge.
Wash the cartridge with 600 µL (two aliquots of 300 µL each) of Milli Q Water.
Elute the sample with 800 µL (two aliquots of 400 µL each) of methanol into 96 well collection plate.
Evaporate the eluent under a gentle stream of nitrogen using a TurboVap 96, at a temperature of approximately 50C.
Reconstitute the dried samples with 100 µL of mobile phase and vortex to mix.
Inject 10 L of the sample onto the LC-MS/MS system.
Method validation:
sensitivity, linearity, precision, accuracy, recovery, matrix effect, dilution integrity and stability. Each validation run was organized with a set of spiked standard samples, blank (with ISTD and without ISTD) and QC samples as per the validation parameter. Standard samples were analyzed at the beginning of the run and QC samples were distributed consistently throughout the validation runs.
Selectivity of the method toward
endogenous and exogenous components of plasma was evaluated in 6 different human plasma lots. The blank plasma lots were extracted (without addition of ISTD), and injected for LC–MS/MS detection. Later selectivity in each lot was evaluated by comparing the blank peak responses against the mean peak response observed in plasma spiked LLOQ sample (n=6).
Linearity of the method was assessed using four calibration curves analyzed on three different days. Each plot was associated with an eight point non-zero concentrations spread over the dynamic range. A linear least squares regression analysis with reciprocate of drug concentration as weighing factor (1/X2) was performed on peak area ratios versus analyte concentrations. Peak area ratios for plasma spiked calibration standards were proportional to the concentration of analytes over the stablished range.
Intra batch (within day) and inter batch (between day) precision and accuracy was evaluated at five distinct concentrations (LLOQ, LQC, MQC, HQC and ULOQ).
Precision and accuracy at each
concentration level was evaluated in
terms of %CV and relative error
respectively. The extraction recovery of Linagliptin was determined at LQC, MQC and HQC levels. The relative recoveries were evaluated by comparing the peak areas of extracted samples (spiked before extraction) with that of
un-extracted samples (blank extracts spiked after extraction).
The matrix effect was checked at low and high QC level using six different blank plasma lots (including one hemolytic and one lipemic lot). Matrix factor for analyte and internal standard was calculated in each lot by comparing the peak responses of post extraction samples (blank extracts spiked after extraction) against the peak responses of equivalent aqueous samples prepared in
mobile phase. Internal standard
normalized matrix factor in each lot was later evaluated by comparing the matrix factor of analyte and internal standard.
Stability of analytes in both aqueous solutions and in biological matrix was evaluated after subjecting to different conditions and temperatures that could encounter during regular analysis. Stability in plasma was evaluated in terms of freeze–thaw stability, bench top stability, long-term stability, and extracted sample stability. Freeze–thaw stability was evaluated after seven freeze (at -70⁰C) thaw (at room temperature) cycles. Bench top stability was assessed at room temperature and the long-term stability was evaluated at both -70⁰C and -70⁰C. Stability of extracted samples was determined before (dry extract stability at 1-10⁰C) and after reconstitution (in-injector stability at 10⁰C). Stability in whole blood was evaluated at room temperature. All the stability assessments were made at LQC and HQC level by comparing the stability samples against freshly prepared samples.
RESULTS AND DISCUSSION: Method development:
For consistent and reliable estimation of analytes it was necessary to give equal importance for optimization of extraction procedure along with chromatographic and mass spectrometric conditions. Analyte and ISTD were tuned in positive polarity mode using electro spray ionization technique. The Q1 and the MSMS scans were made in infusion mode and further compound and gas parameters were optimized in flow
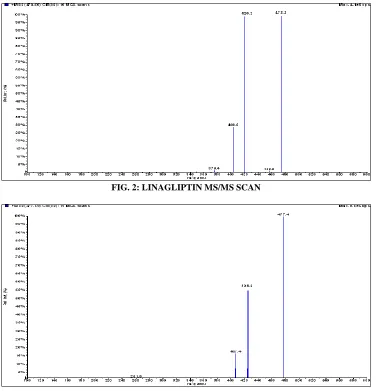
[image:5.612.120.496.215.606.2]injection analysis. The [M+H] peaks were observed at m/z of 473.3 and 477.4 for Linagliptin and Linagliptin D4 respectively. Most abundant product ions were found at m/z of 420.2 and 424.2 for both Linagliptin and Linagliptin D4 (Fig.2 and 3) by applying sufficient collision activated dissociation gas and collision energy. Increase in source temperature beyond 450ºC augmented the intensity. A 5% change in ion spray voltage and gas parameters did not affect the signal intensity.
FIG. 2: LINAGLIPTIN MS/MS SCAN
FIG. 3: LINAGLIPTIN D4 MS/MS SCAN In the optimization of chromatographic conditions,
isocratic mode was selected as no cross talk was observed between analytes and ISTD. To facilitate deprotonation no pH adjustments were made to the ammonium formate buffer. Use of methanol over acetonitrile in the mobile phase has shown significant improvement in the signal intensities. Replacement of milli-Q water with 10 mM ammonium formate buffer in mobile phase gave
good chromatographic peak shapes and further increase in the buffer concentration was resulted in loss of response. A flow rate of 0.8 mL/min was used to minimize the run time.
extraction initiated with individual HLB cartridges. Later on the method was shifted to 96 well plate format. Impact of different solutions and their concentration on recovery of analytes was monitored and the final optimized conditions are depicted in Section 2.6. During the optimization of chromatographic conditions and extraction procedure, more emphasis was given to improve the sensitivity and recovery. No significant matrix effects were observed with the proposed chromatographic and extraction conditions.
Selectivity:
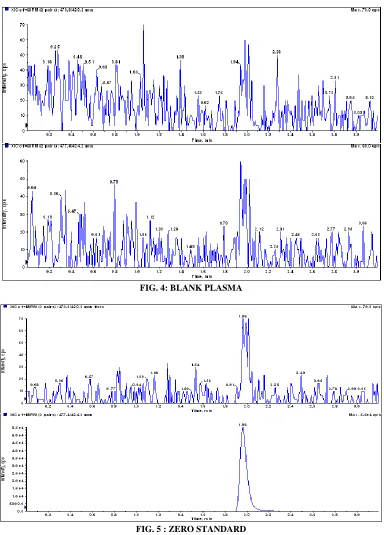
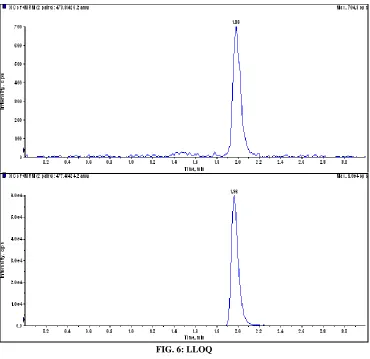
[image:6.612.115.499.215.750.2]Selectivity of the method in human K2 EDTA plasma was evaluated in six individual matrix lots along with one lipemic and one hemolytic lot. Peak responses in blank lots were compared against the response of spiked LLOQ and negligible interference was observed at the retention time of analytes and ISTD. Fig.4–6 demonstrate the selectivity of the method with the chromatograms of blank plasma without ISTD, blank plasma with ISTD and LLOQ sample respectively.
FIG. 4: BLANK PLASMA
FIG. 6: LLOQ Linearity and sensitivity:
The linearity of each calibration curve was determined by plotting the peak area ratio (y) of analytes to ISTD versus the nominal concentration (x) of analyte. Calibration
curves were linear from 99.532 to
10045.049 pg/mL with r values more than 0.9995. The r values, slopes and intercepts were calculated from three intra and inter day calibration curves using weighted (1/X2) quadratic regression analysis. The
observed mean back calculated
concentrations with accuracy (% Nominal) and precision (%CV) are presented in
Table 1. The lower limit of quantitation
[image:7.612.40.579.605.725.2](LLOQ) for determination of analytes was found to be 99.532pg/mL. At LLOQ (n = 6) accuracy (% Nominal) was 102.7% with a %CV of 5.3%. The lower limit of quantitation (LLOQ) for determination of analyte was found to be 99.532pg/mL. At LLOQ (n=6) level the %Nominal was 105.9 with a %CV of 7.9%.
TABLE 1: SUMMARY OF CALIBRATION STANDARDS
Analyte Nominal
(pg/mL) Mean (pg/mL) %CV % Nominal
Linagliptin
99.532 98.7313 2.0 99.2
199.063 204.0993 3.7 102.5
398.127 390.9240 1.9 98.2
1029.005 1029.0170 2.0 100.0
2058.010 2051.7297 1.3 99.7
4410.022 4403.8263 1.8 99.9
8085.040 8233.0727 2.2 101.8 10045.049 9913.9397 0.8 98.7 % CV, percent coefficient of variation
Precision and accuracy:
Precision and accuracy was evaluated using three intra and inter day precision and accuracy runs, with each batch consisting of six replicates of quality control samples at four concentration levels (LLOQ, LQC, MQC and HQC). The intra
batch precision was between 2.0 to 3.8 % with % Nominal between 94.3 to 100.4. The inter batch precision was between 2.9 to 5.3 % with % Nominal between 95.2 to 102.7 Results of precision and accuracy are
presented in Table 2.
TABLE 2: INTRA BATCH AND INTER BATCH PRECISION AND ACCURACY
QC level
Nominal conc. (pg/mL)
Intra Batch a Inter Batchb
Mean Conc Found (pg/mL)
%
CV % Nominal
Mean Conc Found (pg/mL)
%
CV % Nominal
LLOQQC 99.532 99.9177 2 100.4 102.1849 5.3 102.7
LQC 287.111 273.937 3.8 95.4 273.4329 3.6 95.2
MQC 4116.020 3881.0903 2.4 94.3 4026.412 4.7 97.8
HQC 7350.036 7000.6905 2.4 95.2 7111.6436 2.9 96.8
% CV, percent coefficient of variation. Conc., Concentration a 6 replicates at each concentration
b 18 replicates at each concentration
Matrix effect:
Co-eluting matrix components can
suppress or enhance the ion- ization but might not result in a detectable response in matrix blanks due to selectivity of the MS detection, however they can affect the precision and accuracy of the assay. Therefore the potential for variable matrix
related ion suppression was evaluated in six independent sources (containing one hemolytic and one lipemic lot) of human plasma, by calculating the IS normalized matrix factor. The mean IS normalized matrix factor was ranged between 0. 9287 and 1.0011 with a % CV of 4.2 to 11.1 as shown in Table 3.
TABLE 3: MATRIX EFFECT
Lot #
LQC HQC
MF of Analyte
MF of ISTD
ISTD Normalized Factor
MF of Analyte
MF of ISTD
ISTD Normalized Factor
1 0.980 0.920 1.066 0.859 0.887 0.968
2 0.886 0.908 0.975 0.905 0.873 1.037
3 0.814 0.993 0.820 0.889 0.928 0.958
4 0.967 0.953 1.015 0.968 0.949 1.020
5 0.818 0.946 0.865 0.851 0.879 0.967
6 0.784 0.942 0.832 0.947 0.896 1.057
Mean
-
0.9287
-
1.0011
SD 0.10349 0.04191
% CV 11.1 4.2
N 6 6
MF: Matrix Factor
Extraction recovery and dilution integrity:
The extraction recovery of analytes from
EDTA plasma was determined by
comparing the peak responses of plasma samples (n = 6) spiked before extraction with that of plasma samples spiked after
Dilution integrity experiment was carried out at 3 times the ULOQ concentration. After 1/5, 1/10 and 1/20 dilution the mean back calculated concentration for dilution
QC samples was within 85–115% of nominal value with a %CV of ≤5.2 as shown in Table 5.
TABLE 4: RECOVERY
Analyte A B % Recovery Mean Recovery % CV
Linagliptin LQC 14672.7 20977.5 69.9 73.3 4.9
MQC 100749.7 138210.5 72.9
HQC 141685.0 183738.7 77.1
Linagliptin d6 39782.7 52151.6 76.3 - -
B: Mean Peak response of un Extracted Samples A: Mean Peak response of Extracted Samples
TABLE 5: DILUTION INTEGRITY
Dilution Factora % Nominal % CV
1/5 94.8 5.1
1/10 96.5 5.2
1/20 88.2 5.0
a: Six replicates at each dilution factor
Stability:
Stability evaluations were performed in both aqueous and matrix based samples. The stock solutions were stable for a period of 6 h at room temperature and for17 days at 1-10⁰C. Stock dilutions in 50% acetonitrile were stable up to 6 h 45 min at room temperature. Stability evaluations in matrix were performed against freshly spiked calibration standards using freshly
prepared quality control samples
(comparison samples). The analyte was
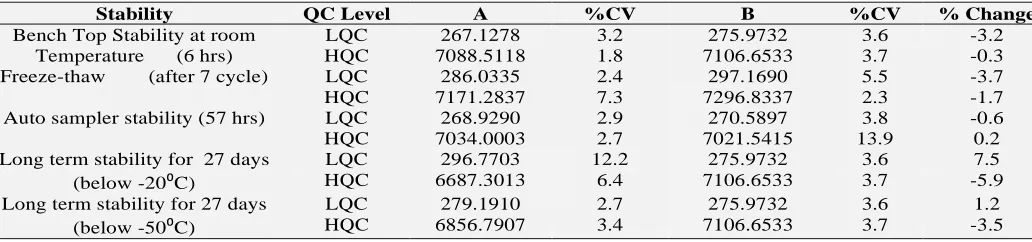
[image:9.612.47.563.502.623.2]stable up to 6 h on bench top at room temperature and over 6 freeze-thaw cycles. The processed samples were stable up to 57 h in auto sampler at 10⁰C. Reinjection reproducibility is done for 60 h. The long-term matrix stability was evaluated at both-20⁰C and -50⁰C over a period of 27 days. No significant degradation of analytes was observed over the stability duration and conditions. The stability results presented in Table 6 were within85-115%.
TABLE 6: STABILITY DATA
CONCLUSION: A rapid, sensitive, high
throughput and accurate liquid
chromatography with electro spray
ionization tandem mass spectrometry
method was developed for determination of Linagliptin in human plasma with short chromatographic run time of 3.0 min. The method offers high selectivity with a LOQ
of 99.532pg/mL, which is 0.1ng/mL. The extraction method utilizes a low sample volume of 100µL and shown consistent and reproducible recoveries for analyte and ISTD with minimum plasma interference and matrix effect. The validated method can be successfully used to a clinical and tox studies. Use of Linagliptin d4 as an
Stability QC Level A %CV B %CV % Change
Bench Top Stability at room Temperature (6 hrs)
LQC 267.1278 3.2 275.9732 3.6 -3.2
HQC 7088.5118 1.8 7106.6533 3.7 -0.3
Freeze-thaw (after 7 cycle) LQC 286.0335 2.4 297.1690 5.5 -3.7
HQC 7171.2837 7.3 7296.8337 2.3 -1.7
Auto sampler stability (57 hrs) LQC 268.9290 2.9 270.5897 3.8 -0.6
HQC 7034.0003 2.7 7021.5415 13.9 0.2
Long term stability for 27 days (below -20⁰C)
LQC 296.7703 12.2 275.9732 3.6 7.5
HQC 6687.3013 6.4 7106.6533 3.7 -5.9
Long term stability for 27 days (below -50⁰C)
LQC 279.1910 2.7 275.9732 3.6 1.2
ISTD will not compromise the accuracy of analytical results as this is the deuterated compound of analyte. The high throughput method can reduces overall processing time and allowing to process and analyze more than 180 samples in single time.
REFERENCES:
1. Four Phase III Trials Confirm Benefits of BI’s Oral, Once-Daily Type 2 Diabetes Therapy. Genetic Engineering & Biotechnology News. 28 June 2010.
2. M. Archana, N. Sriram, MD. Gayasuddin: Method development and validation of Rp-Hplc method for determination of new antidiabetic agent linagliptin in bulk and in pharmaceutical formulation. IJMCA 2013; 3:1-5. 3. Lakshmi B, Reddy TV: A novel RP – HPLC Method for
the quantification of Linagliptin in formulations. J Atoms and Molecules, 2012; 2(2): 155-164.
4. Lakshman Raju Baduguetal., A: Validated Rp-Hplc Method For The Determination Of Linagliptin. Am. J. PharmTech Res. 2012; 2(4): 2249-338.
5. Kavitha. K.Y, Geetha. G, Hariprasad: Development and validation of stability indicating RP-HPLC method for the simultaneous estimation of linagliptin and metformin in pure and Pharmaceutical dosage form. Journal of Chemical and Pharmaceutical Research, 2013; 5(1):230-235. 6. Spreitzer H. Neue Wirkstoffe - BI-1356.Österreichische
Apothekerzeitung, 918, 2008.
7. World Health Organization. Fact Sheet No. 312: What is Diabetes? 2011.
8. FDA Approves Type 2 Diabetes Drug from Boehringer Ingelheim and Lilly. 3 May 2011
9. Janet B. McGill: Linagliptin for type 2 diabetes mellitus: a review of the pivotal clinical trials. Ther Adv Endocrinol Metab. 2012; 3(4): 113–124
10. Wang Y, Serradell N, Rosa, E Castaner, R BI-1356. Drugs of the Future, 33(6), 2008; 473-477.
11. US FDA. Guideline for industry: Bioanalytical Method Validation, May 2001
All © 2013 are reserved by International Journal of Pharmaceutical Sciences and Research. This Journal licensed under a Creative Commons Attribution-NonCommercial-ShareAlike 3.0 Unported License.
This article can be downloaded to ANDROID OS based mobile. Scan QR Code using Code/Bar Scanner from your mobile. (Scanners are available on Google Playstore)
How to cite this article: