IJPSR (2015), Vol. 6, Issue 8 (Research Article)
Received on 27 January, 2015; received in revised form, 12 March, 2015; accepted, 11 May, 2015; published 01 August, 2015
IMPROVING THE PERFORMANCE OF PHARMACEUTICAL TABLET PRODUCTION USING SIX SIGMA METHODOLOGY (MODULATION ON DIGESTIVE ENZYME TABLET)
El-Menhawy A.1, Mohamed N. M. 1, Arafa H. A. 1, and Abd Elmonem A. R *2
Arab Academy for Science and Technology and Maritime Transport1, Productivity and Quality Institute, Cairo, Egypt
Department of Pharmaceutics and Industrial Pharmacy 2, Faculty of Pharmacy, Misr University for Science and Technology, 6 October, Giza, Egypt
ABSTRACT:Each company is expected to develop specifications for their products to
be accommodated with theinspection guide of pharmaceutical quality control. After product analysis for (X) pharmaceutical company it was noticed that 84.5% of defects were attributed to tablet department while 14.1% and 1.4% for ampoule and syrup departments respectively so it was valuable to solve the tablet department problems. Data was collected for three months for two types of tablets which were analgesic tablet (AT) and digestive enzyme tablet (D.E.T). D.E.T was chosen for further study due to its high percent of defect. By using six sigma methodology to analyze the collected data it was found that the major problem was in tablet microbiological test 85.9% rather than the physical problem 14.1%. D.E.T was subjected to study the variables affecting the bacterial count like raw material, process environment and microbiological analysis accuracy. It was found 66.7 of the problem caused by the variation in process environment. By using factorial design for three variables it revealed that the cleaning and disinfection methods were the most affecting factor that caused the total variation in the overall process. Seven remedies for cleaning were studied and each remedy was rated for each criterion using a special scaling system. It was noticed that the manual cleaning was the most effective method since it lowered the bacterial count of the coating solution to 285 cfu/ml and affected on sigma level to be 4.2 σ which exceeded the target (not more than 500 cfu /ml). Six Sigma methodology is a promising method for improving the pharmaceutical tablet production and achievement its quality control.
INTRODUCTION: Quality within all industries is important, but within the pharmaceutical industry, it is essential. Because lives are at stake, quality, when it comes to creating and manufacturing medicines for individuals, is necessary1 since drugs worldwide used either through prescription or as over the counter medication2. Since 2002, FDA began an initiative to address cGMP for the 21st century3.
QUICK RESPONSE CODE
DOI:
10.13040/IJPSR.0975-8232.6(8).3580-93
Article can be accessed online on: www.ijpsr.com
DOI link: http://dx.doi.org/10.13040/IJPSR.0975-8232.6(8).3580-93
cGMP focuses on manufacturing as a mean to produce a safe and effective products for the patient 4. The practice of industrial hygiene focuses upon the implementation of workplace safety solutions and control of workplace health risks and stressors by highly trained and experienced professionals skilled in the science and art of hazard anticipation, recognitions, evaluation and control within the workplace, the surrounding environment, and community5.
For drug products, specifications usually consist of test methods and acceptance criteria for assay, impurities, pH, dissolution, moisture, and microbial limits, depending on the dosage forms.
Keywords:
Digestive Enzyme Tablet, Quality control, Six sigma, Performance, Tablet production, Coating solution,
Manual cleaning, bacterial count
Correspondence to Author: Rehab A. Abd Elmonem
Assistant Professor of Pharmaceutics and Industrial Pharmacy, Department of Pharmaceutics and Industrial Pharmacy, Faculty of Pharmacy, Misr university for science and technology (MUST), 6 October, Giza, Egypt.
They are usually proposed by the manufacturers and subject to the regulatory approval for use6. This effort involved taking new looks at both the regulatory and industrial systems for insuring drug quality7. Six Sigma as a measurement standard in product variation can be traced back to the1920's when Walter Shewhart showed that three sigma from the mean is the point where a process requires correction8. Six Sigma Projects are based on the DMAIC model. The DMAIC model is the generic model of six sigma methodology. It is an acronym that stands for; Define, Measure, Analyze, Improve and Control. Sometimes this model includes recognize as an awareness item to the model. Each of the components addresses a different aspect of the overall improvement and breakthrough strategy9.
Six sigma is a statistical concept which helps us to define the problems systematically, provides tools to measure and analyze the influential factors, identifies the improvements that can be implemented easily and ensure that the changes which have been made, are kept alive through a control process and maintains the gains over the time. It is a known fact that in a process with six sigma capability, process variation is not reduces more than 3.4 defects per million opportunities10. Six Sigma has evolved over time. It's more than just a quality system like TQM or ISO. It's a way of doing business. As Geoff Tennant describes in his book Six Sigma: SPC and TQM in Manufacturing and Services: "Six Sigma is many things, and it would perhaps be easier to list all the things that Six Sigma quality is not. Six Sigma can be seen as: a vision; a philosophy; a symbol; a metric; a goal; a methodology." We couldn't agree more11.
The goals of Six Sigma for improving customer satisfaction relay on accelerating process cycle times and time-to-market, reducing defects, controlling variation and improving predictability, reducing costs – without "unintended consequences", and improving end-to-end process management and measurement12.
The pharmaceutical market in Egypt It started around 1940 when the Misr Company of Pharmaceutical Industries was founded. In the 1980’s and 1990’s, the Egyptian market was over
flooded by a huge amount of private sector pharmaceutical companies.
According to the report of IMS Health (2006), the pharmaceutical organizations in Egypt fall into three categories:
Public sector categories, the Drug Holding Company (D.H.C.), which have their roots in the first national pharmaceutical Industry
Local private sector companies.
Transnational private corporations.
According IMS the pharmaceutical market, in 2006, consists of around 47 pharmaceutical companies, of which 8 are publicly owned. The Egyptian ministry of Investment speak about 30 private and 8 public pharmaceutical companies, source; IMS Health, unpublished Statistical report, March 2007GlaxoSmithKline has the largest market share, an estimated 7.5%, followed by Novartis,6.7% and Sanofi-Aventis which possesses nowadays an estimated 6.3% of the Egyptian pharmaceutical market, due to the international merger of Sanofi and Aventis in August 2004. Sanofi-Aventis is now both the world largest and Egypt’s third largest pharmaceutical company and it also ranks number 1 in Europe.
Egypt's exports of pharmaceuticals have grown steadily in recent years, topping USD 270 million in FY2011/2012Compared to USD 238 million in FY 2006/2007. Investments in Egypt's pharmaceutical industry currently stand at EGP 26 billion, with the industry employing a total of 39,500 professional staff and production workers. Egypt has the largest drug manufacturing base in the MENA region accounting for around 30% of the regional market.
Large multinationals as Glaxo Smith Kline (GSK) is the leading company in the Egyptian market with 9% of the market share. Sanofi-Aventis and Novartis, Pfizer, Servier, and Bristol- Myers are also among the top multinational manufacturers in the market. Holdipharma have 1700 types of medicine, 42.1% of them are sold in cheap prices, with LE 1.3bn. annual losses because of its low prices the total capital of Holdipharma and its affiliates is about LE 2bn, with a cumulative growth rate over the last five years 50%. Egyptian pharmaceutical exports in 2008 reaching US $ 120.4 million. Imports have reaching US $ 1018.4 million in 200814.
MATERIALS AND METHODS: Materials: produced by (X) company:
Ampoules: sample = 60,000 ampoule/batch.
Tablets: sample = 3000 tablet/batch.
Syrup: sample = 1500 bottles/batch.
Methods:
1. Classification of the company
pharmaceutical product formulations
Pharmaceutical products were classified into:
Sterile products:
It is the pharmaceutical dosage form that contains therapeutic agent and must be free of microorganism. It includes ampoule production only.
Non Sterile Products:
It is the pharmaceutical dosage form that contain therapeutic agent that have microbial loading. It includes tablet and syrup production. 2.Problem analysis:
Samples are pulled from different sections of production (Ampoule – Syrup - Tablets). Samples were drawn from batches to analyze. Result of analysis indicated batch rejection or acceptance according to the specification limit.
3. Data collection and analysis before applying six sigma on tablet department (For Three Months). Two types of tablets were subjected to study their collected data. The first type was analgesic (A.T) tablet and the other was digestive enzyme tablet
(D.E.T). Data for both of them were collected and analyzed.
4. Applying six sigma methodology on D.E.T collected data.
Six Sigma projects enhance technological innovation of the firms; however, they are beneficial for firms in stable environments15. So this study aims to increase the internal customer satisfaction by identify the main causes of out of specification. The suggested reason was the variation in the Bacterial count of Digestive enzyme tablet (D.E.T) which also caused dramatic effects on the tablet production process due to bacterial count got out of specification. That was reported through internal customer (quality control microbiology). Focus on the processes using six sigma methodology was done to achieve the customers’ expectations. The application of six sigma includes the following16:
Define Phase:
This phase deals with defining processes, key customer requirements, and process “owners”11
. At this phase three issues were studied which were:
Identify Customer Critical to quality.
Develop Project Charter.
SIPOC Analysis.
Measure Phase:
This phase considered as measuring performance against customer requirements and key performance indicators11. It consists of three main steps:
Critical to Quality Characteristics.
Define Performance Standard.
Measure System Analysis.
Analyze Phase:
This phase was related to Analyze data to enhance measures and refine process management mechanisms11. This phase consists of three main steps:
Establish Process Capability.
Process Performance.
Improve Phase:
The main steps of the improve phase were:
Generation of Ideas.
Rating of ideas.
Design of experiment.
Improvements recommendation. Control Phase:
Controlling process performance was done by monitoring process inputs, process operation, and process outputs, and responding quickly to problems and process variations11. This phase contained the following:
Define and Validate Measurements.
Determine Process Capability.
Implement Process Control.
5. Implementing Integrated Approach of Six-Sigma at tablet coating solution.
6. Manual cleaning.
RESULT AND DISCUSSION:
Company products were classified into sterile and non sterile. The sterile product was ampoule and the non sterile subdivided into tablet and syrup. Table 1 showed the problem analysis of the products for one month production.
TABLE 1: PROBLEM BATCH ANALYSIS
Departments Number of items/batch
Samples/ batch
Number of batches
Number of items non conform
Number of batches non conform
Problem sorting
Ampoule 600,000
Ampoules
60,000 Ampoules
15 Batches
1,000 Ampoules
--- Physical
Tablets 30,000
Tablets
3,000 Tablets
30 Batches
6,000 Tablets
5 Batches
Microbiology
Syrup 15,000
Bottles
1,500 Bottles
15 Batches
100 Bottles
1 Batches
Microbiology
FIG.1: PARETO CHART DEPARTMENTS DEFECTS ANALYSIS
As shown from Fig.1 84.5% of the defects were attributed to tablet department that's considered the biggest problem rather than the other departments. Ampoule and syrup departments defect ratios were 14.1 and 1.4% respectively. The previous data showed that the major problem was related to tablet department. The sorting of tablet department
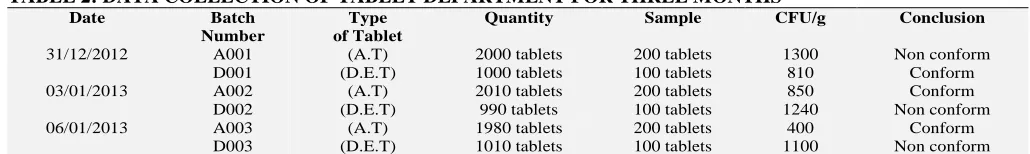
data revealed that 14.1% of the tablet defect was related to physical problem and 85.9% was related to microbiological problem so the main issue for further study was the defect related to microbiological reason. Data was collected for three months for both of D.E.T and A.T for further analysis. As shown in Table 2 the microbiology defect and nonconformity for the digestive enzyme tablet was higher than the analgesic tablet.
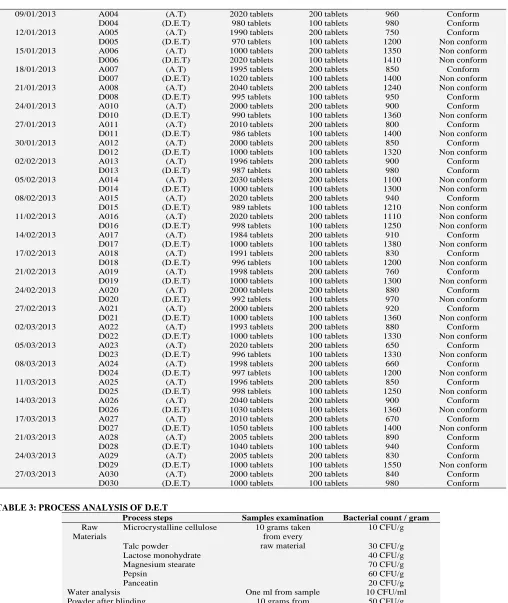
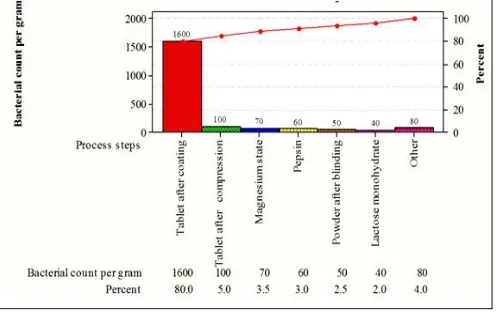
[image:4.612.50.565.677.754.2]Digestive enzyme tablet was taken for further study. Process analysis for digestive enzyme tablet was done to recognize the reasons of the microbiological defect. Table 3 and Fig.2 showed that the main reason for the highly bacterial count was the coating solution since it had 80% of the total bacterial count. So we had to solve the problem of the coating process to improve the tablet process.
TABLE 2: DATA COLLECTION OF TABLET DEPARTMENT FOR THREE MONTHS
Date Batch
Number
Type of Tablet
Quantity Sample CFU/g Conclusion
31/12/2012 A001 (A.T) 2000 tablets 200 tablets 1300 Non conform
D001 (D.E.T) 1000 tablets 100 tablets 810 Conform
03/01/2013 A002 (A.T) 2010 tablets 200 tablets 850 Conform
D002 (D.E.T) 990 tablets 100 tablets 1240 Non conform
06/01/2013 A003 (A.T) 1980 tablets 200 tablets 400 Conform
09/01/2013 A004 (A.T) 2020 tablets 200 tablets 960 Conform
D004 (D.E.T) 980 tablets 100 tablets 980 Conform
12/01/2013 A005 (A.T) 1990 tablets 200 tablets 750 Conform
D005 (D.E.T) 970 tablets 100 tablets 1200 Non conform
15/01/2013 A006 (A.T) 1000 tablets 200 tablets 1350 Non conform
D006 (D.E.T) 2020 tablets 100 tablets 1410 Non conform
18/01/2013 A007 (A.T) 1995 tablets 200 tablets 850 Conform
D007 (D.E.T) 1020 tablets 100 tablets 1400 Non conform
21/01/2013 A008 (A.T) 2040 tablets 200 tablets 1240 Non conform
D008 (D.E.T) 995 tablets 100 tablets 950 Conform
24/01/2013 A010 (A.T) 2000 tablets 200 tablets 900 Conform
D010 (D.E.T) 990 tablets 100 tablets 1360 Non conform
27/01/2013 A011 (A.T) 2010 tablets 200 tablets 800 Conform
D011 (D.E.T) 986 tablets 100 tablets 1400 Non conform
30/01/2013 A012 (A.T) 2000 tablets 200 tablets 850 Conform
D012 (D.E.T) 1000 tablets 100 tablets 1320 Non conform
02/02/2013 A013 (A.T) 1996 tablets 200 tablets 900 Conform
D013 (D.E.T) 987 tablets 100 tablets 980 Conform
05/02/2013 A014 (A.T) 2030 tablets 200 tablets 1100 Non conform
D014 (D.E.T) 1000 tablets 100 tablets 1300 Non conform
08/02/2013 A015 (A.T) 2020 tablets 200 tablets 940 Conform
D015 (D.E.T) 989 tablets 100 tablets 1210 Non conform
11/02/2013 A016 (A.T) 2020 tablets 200 tablets 1110 Non conform
D016 (D.E.T) 998 tablets 100 tablets 1250 Non conform
14/02/2013 A017 (A.T) 1984 tablets 200 tablets 910 Conform
D017 (D.E.T) 1000 tablets 100 tablets 1380 Non conform
17/02/2013 A018 (A.T) 1991 tablets 200 tablets 830 Conform
D018 (D.E.T) 996 tablets 100 tablets 1200 Non conform
21/02/2013 A019 (A.T) 1998 tablets 200 tablets 760 Conform
D019 (D.E.T) 1000 tablets 100 tablets 1300 Non conform
24/02/2013 A020 (A.T) 2000 tablets 200 tablets 880 Conform
D020 (D.E.T) 992 tablets 100 tablets 970 Non conform
27/02/2013 A021 (A.T) 2000 tablets 200 tablets 920 Conform
D021 (D.E.T) 1000 tablets 100 tablets 1360 Non conform
02/03/2013 A022 (A.T) 1993 tablets 200 tablets 880 Conform
D022 (D.E.T) 1000 tablets 100 tablets 1330 Non conform
05/03/2013 A023 (A.T) 2020 tablets 200 tablets 650 Conform
D023 (D.E.T) 996 tablets 100 tablets 1330 Non conform
08/03/2013 A024 (A.T) 1998 tablets 200 tablets 660 Conform
D024 (D.E.T) 997 tablets 100 tablets 1200 Non conform
11/03/2013 A025 (A.T) 1996 tablets 200 tablets 850 Conform
D025 (D.E.T) 998 tablets 100 tablets 1250 Non conform
14/03/2013 A026 (A.T) 2040 tablets 200 tablets 900 Conform
D026 (D.E.T) 1030 tablets 100 tablets 1360 Non conform
17/03/2013 A027 (A.T) 2010 tablets 200 tablets 670 Conform
D027 (D.E.T) 1050 tablets 100 tablets 1400 Non conform
21/03/2013 A028 (A.T) 2005 tablets 200 tablets 890 Conform
D028 (D.E.T) 1040 tablets 100 tablets 940 Conform
24/03/2013 A029 (A.T) 2005 tablets 200 tablets 830 Conform
D029 (D.E.T) 1000 tablets 100 tablets 1550 Non conform
27/03/2013 A030 (A.T) 2000 tablets 200 tablets 840 Conform
[image:5.612.58.566.47.650.2]D030 (D.E.T) 1000 tablets 100 tablets 980 Conform
TABLE 3: PROCESS ANALYSIS OF D.E.T
Process steps Samples examination Bacterial count / gram
Raw Materials
Microcrystalline cellulose 10 grams taken
from every raw material
10 CFU/g
Talc powder Lactose monohydrate
30 CFU/g 40 CFU/g
Magnesium stearate 70 CFU/g
Pepsin 60 CFU/g
Panceatin 20 CFU/g
Water analysis One ml from sample 10 CFU/ml
Powder after blinding 10 grams from
different location
50 CFU/g
Tablet after compression 100 CFU/g
Tablet after coating 1600 CFU/g
Six Sigma fundamental phases (define, measure, analyze, improve and control) applied on the problem of D.E.T in tablet production line through defining the scope and goals of improvement, measuring the process and analyze the problem.
FIG.2: PARETO CHART FOR PROCESS ANALYSIS OF TABLET
TABLE 4: PROJECT TIME PLAN
Phase 2013
1 2 3 4 5 6 7 8 9 10 11 12
Define Measure Analysis Improve Control
Table 4 showed the project time frame for the five phases. The define phase concerned with identify the customer. Customer was classified into:
i)Internal Customer, quality control microbiologist who was responsible for microbiological analysis at sterile product drug as ampoule and non-sterile drug as syrup and tablet (D.E.T), (A.T).
ii) External Customer, Ministry of Health, public hospitals, private hospitals, and medical centers. Customer critical to quality (CTQ) was the internal customer for three variables which were: i) Raw material, which revealed that the microbiological analysis of raw materials was required to meet specification of analysis, raw materials that were internal process.
ii) Process environment, which was proceeded during the manufacturing production areas have ability to causes contamination of (D.E.T).
iii) Microbiological analysis accuracy, which reported that all microbiological tests must be under sterile aseptic conditions (sterilized equipment, laminar air flow, microbiologist free from infection pathogen). Technical process flow chart was prepared by dividing the production
process into four phases as the following: raw material, compression, coating, and blistering and packaging. After a deeply look through the detailed process steps a process drill down tree was developed as shown in Fig.3.
FIG.3: TABLET (D.E.T) PRODUCTION PROCESS DRILL DOWN TREE
[image:6.612.318.565.130.246.2]The project leader selected the team indicated the business case, mentioned the problem statement, indicated the goal statement, indicated the project scope, and put the project time plan for each phase to implement six sigma projects as shown in Table 5.
TABLE 5: PROJECT CHARACTER Project Character
Project Leader : Team Member:
The researcher. Quality control
microbiology team leader. Production members.
Quality assurance member. Business Case:
To eliminate the defect in the (D.E.T) process.
Problem Statement: Goal Statement:
Reduce the bacterial count of digestive enzyme tablet (D.E.T) that lead to causes
customer satisfaction of internal customer to give safe
drug to patient.
Reduce the bacterial count of (D.E.T) to be not more than 1000 cfu/g by the determine the root causes of the variability
of (D.E.T) which will lead to achieve after eight
months.
The team was selected to represent the main branches affecting the (D.E.T) production on the selected tablet. The following individuals were responsible for the production process of (D.E.T) with high quality and were chosen according to their awareness and responsibility of work in each of the four processes of the (D.E.T) production process.
[image:6.612.313.571.384.572.2]microbiological lab for the company.
Production Shift Leader: Responsible for distributing workload among the workshop and tablet production in the company.
Planning & Scheduling Team Leader: Ensure that the projects achieve their goals on schedule.
Supply Manager: Responsible for ordering and follows up of all departments.
A SIPOC Process Definition helps the Process Owner and those working on the process to agree the boundaries of what they will be working on. It provides a structured way to discuss the process and get consensus on what it involves before rushing off and drawing process maps17.
So the SIPOC diagram was prepared to provide a summary of the key factors of the process (D.E.T). The SIPOC simply was identified to ensure that selected employees in this project were aware with the problem parts as shown in Fig 4.
Suppl i ers Inputs Process Outputs Customers
APZ pharma.co
Raw materi al s: (Mi crocrystal l i ne cel l ul ose-Tal c
powder-Lactose monohydrate-Magnesi um stearate-Pepsi n-Li
pase-protease-Amyl ase)
Dei oni zed water
Process Descri pti on:
Di gesti ve enzyme tabl et (D.E.T) producti on process.
(D.E.T) tabl et package
Internal customer mi crobi ol ogy
l aboratory Process map:
Wei ght raw materi al s
Si evi ng raw materi al s at russel si eve
Mi xi ng by v-shaped
bl ender
Mi l l i ng at apex mi l l
Granul ate i nto gl att oven
Compressi on by machi ne
spray Coati ng sol uti on
Tabl et Bl i steri ng
by bl i ster machi ne
Packagi ng stri ps contai ni ng
[image:7.612.107.510.237.425.2]tabl ets
FIG.4: SIPOC ANALYSIS
The team focused on how to reach the main defects in the (D.E.T) production process to determine root causes of (D.E.T). The measure phase consisted of three main steps which are critical to quality, define performance standard, and measure system analysis. The main factors
effecting the tablet composition and bacterial count variation from microbiological point of view was coating solution which measured by CFU/g. The team studied the data collected from September 2012 to October 2012.
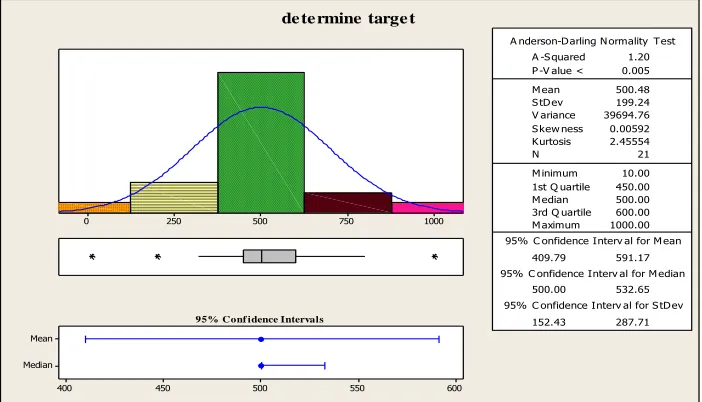
1000 750
500 250
0
Median Mean
600 550
500 450
400
1st Q uartile 450.00 M edian 500.00 3rd Q uartile 600.00 M aximum 1000.00
409.79 591.17
500.00 532.65
152.43 287.71 A -S quared 1.20 P -V alue < 0.005
M ean 500.48
S tDev 199.24 V ariance 39694.76 S kew ness 0.00592 Kurtosis 2.45554
N 21
M inimum 10.00 A nderson-Darling N ormality Test
95% C onfidence Interv al for M ean
95% C onfidence Interv al for M edian
95% C onfidence Interv al for S tDev
95% Conf idence Intervals
[image:7.612.134.485.536.737.2]de te rmine targe t
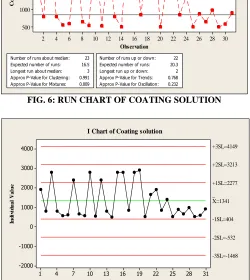
As shown in Fig.5 the median was centered in the IQR box. The confidence intervals for the precipitated data indicated that 95% confident that: The mean was 500.48; standard deviation was 199.24 which revealed that on average, the values of data tended to differ from the mean by ±199.24. Q1 was 450, Q3 was 600 and the IQR was 150. The maximum value was 1000, minimum value was 10 and the range was 990 so the lower specification limit LSL would be 10 cfu/g, and upper specification limit would be 1000 cfu/g, target would be 500 cfu/ml, and as the standard deviation of coating solution of the (D.E.T) feed according to the company quality control requirement was 500 cfu/ml to keep the bacterial count of (D.E.T) at safety limits. The defect was defined as the value of the bacteria of (D.E.T) process that had to be more than 1000 cfu/g for the selected tablet productions. Run Chart and individual control chart were done as shown in Fig. 6, 7.
30 28 26 24 22 20 18 16 14 12 10 8 6 4 2 3000 2500 2000 1500 1000 500 Observation C o a ti n g s o lu ti o n
Number of runs about median: 23
Expected number of runs: 16.5
Longest run about median: 3
Approx P-Value for Clustering: 0.991
Approx P-Value for Mixtures: 0.009
Number of runs up or down: 22
Expected number of runs: 20.3
Longest run up or down: 2
Approx P-Value for Trends: 0.768
Approx P-Value for Oscillation: 0.232
Run Chart of Coating solution
FIG. 6: RUN CHART OF COATING SOLUTION
31 28 25 22 19 16 13 10 7 4 1 4000 3000 2000 1000 0 -1000 -2000 Observation In d iv id u a l V a lu e _ X=1341 +3SL=4149 -3SL=-1468 +2SL=3213 -2SL=-532 +1SL=2277 -1SL=404
I Chart of Coating solution
FIG.7: I CHART OF COATING SOLUTION
As shown in Fig. 6, 7 the average of the Standard deviation of bacterial count of (D.E.T) during the measure period was 1341which was out of the company quality control reference limits (standard deviation of bacterial count was 500cfu/ml) which gave an indication for high variation on (D.E.T). Regarding to the analysis phase in term of establish process capability since there was process instability so there was no need to study the capability of the process, ppm is equal to 387096, so sigma levels 1.77 that's give yield 60.85%. The process performance showed a gap between the current state for the standard deviation of coating solution (512) and the target from the study (500) which is less than the specification of the company (not more than 1000). Identification of the variation sources was obtained by Study the measured values of standard deviation of coating solution during the period April to June 2013, and he found that 12 measured values from 31 are out of limit, Meeting with the team member and brainstorming take place with the selected company team to review the problems and factors that may be affect the variability of the kiln feed during taking the samples.
Frequency 8 3 1
Percent 66.7 25.0 8.3
Cum % 66.7 91.7 100.0
Category process environment Raw materials Micro analysis accuracy 12 10 8 6 4 2 0 100 80 60 40 20 0 F r e q u e n c y P e rc e n t 1 3 8
causes that effect on bacterial count of coating solution
FIG.8: CAUSES THAT AFFECT THE BACTERIAL COUNT OF COATING SOLUTION
[image:8.612.317.564.429.598.2] [image:8.612.53.303.444.724.2]step of all process in manufacturing areas of (D.E.T) affected on bacterial count. Methods of analysis used to ensure that contamination of the manufacturing process is kept under control, with frequency of environmental analysis. Sterile petri dishes containing (T.S.A) media were added on production areas (compression, coating solution preparation, and packaging area) to evaluate air contamination. Swabs were taken from the machinery parts and walls before and after cleaning and sterilization to assess cleaning and disinfection method and evaluation of personnel Gown.Finger print was used to evaluate personnel
[image:9.612.149.469.250.542.2]hygiene through applying personnel fingers on sterile petri dish containing (T.S.A) media. Machine and equipment were very important factors in contamination control because it's direct contact with drug in every step of processes, so through cleaning and disinfection and control of air supply with gown and hygiene control could lead to decrease bacterial count. Environment was include deionized water system that are used in process and cleaning, and air supplementation which was direct proportional on bacterial count in machine and equipment and keep personnel hygiene with disinfection.
FIG.9: CAUSE-EFFECT DIAGRAM OF ENVIRONMENT PROCESS
Improvement phase of (D.E.T) production line were done by generation of ideas as shown in Fig. 9. One of the three vital factors which was necessary and vital to be eliminated (air contamination), the other two factors are personnel gown & hygiene, and parameters that need to be increased or decreased (increase technicians experience and reduce the time spent in documentations recording).
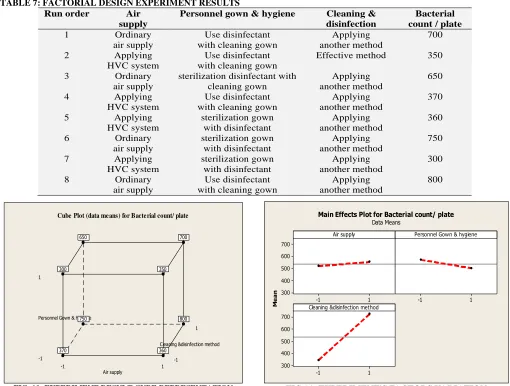
A design of experiments with two levels, full factorial design was performed to test the significance of the suggested vital factors and the interaction between them. Three factors (Changing the training method, increase technicians experience and reduce the time spent in documentations recording) are put into experiment with two possible levels for each factor, as in Table 6.
TABLE 6: FACTORS LEVELS
Factor Level 1 (-1) Level 2 (1)
Air supply Ordinary air supply Applying HVAC system
Personnel gown & hygiene Use disinfectant with cleaning gown Sterilization gown with disinfectant
The level of each factor had to be-identified in order to know the actual meaning of each factor and level before applying the experiment. Air supply divided into two levels, the first level is the air contamination, which means that, uncontrollable bacterial count in tablet manufacturing. The second level is Applying HVAC system, which means that, air will prevent aerosol contamination by bacterial spores, and mold these can be achieve through applying HVAC system in tablet manufacturing. Obviously, the second level is the proper level in the first factor. Personnel Gown & Hygiene divided into two levels; the first level is uncontrolled personnel gown & hygiene, which means that, the personnel gown & hygiene holds a number of microbes that may interference of tablet through direct contact.
The second level is a personnel control gown & hygiene, which mean that reduces the microbial
load on Gown and prevents bad behavior of personnel's. Obviously, the second level is the proper level in the second factor. Cleaning and disinfection method divided into two levels, the first level is the unregulated cleaning and disinfection , which means that cleaning is prevent product integrity, remove dust , any waste can be carried microorganisms, disinfect are used to kill microorganisms in environment and on personnel's obviously, the second level is the proper level in the third factor.
Experiments had performed in the (D.E.T) production of coating solution and microbiological samples collected from these areas and transferred to microbiology laboratory to be examined by plate count method, all testes were happened under sterile equipment's and under laminar air flow. Experiment results were as shown in Table 7 below.
TABLE 7: FACTORIAL DESIGN EXPERIMENT RESULTS Run order Air
supply
Personnel gown & hygiene Cleaning & disinfection
Bacterial count / plate
1 Ordinary
air supply
Use disinfectant with cleaning gown
Applying another method
700
2 Applying
HVC system
Use disinfectant with cleaning gown
Effective method 350
3 Ordinary
air supply
sterilization disinfectant with cleaning gown
Applying another method
650
4 Applying
HVC system
Use disinfectant with cleaning gown
Applying another method
370
5 Applying
HVC system
sterilization gown with disinfectant
Applying another method
360
6 Ordinary
air supply
sterilization gown with disinfectant
Applying another method
750
7 Applying
HVC system
sterilization gown with disinfectant
Applying another method
300
8 Ordinary
air supply
Use disinfectant with cleaning gown
Applying another method
800
1
-1 1
-1
1 -1
Cleaning &disinfection method Personnel Gown & hygiene
Air supply
700
800 750
650
350
360 370
300
Cube Plot (data means) for Bacterial count/ plate
FIG. 10: EXPERIMENT RESULT CUBE REPRESENTATION
1 -1
700
600
500
400
300
1 -1
1 -1
700
600
500
400
300
Air supply
M
e
a
n
Personnel Gown & hygiene
Cleaning &disinfection method
Main Effects Plot for Bacterial count/ plate
[image:10.612.54.564.357.743.2]Data Means
As illustrated in Fig. 10, 11 the cleaning & disinfection method was the most affecting factor that caused the total variation in the overall process.
Improvement Methodology (Cleaning and disinfection method):
Disinfection is a process that reduces the number of pathogenic microorganism with an inanimate
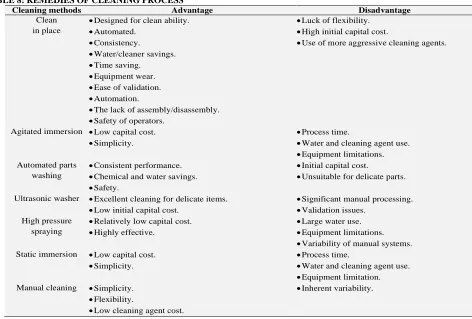
[image:11.612.70.542.194.513.2]object to a level, which is not harmful to health, It is generally more reliable than chemical processes, leaves no residues, is nontoxic, shows lack of emergence of resistance, and the process is automated and validated, similar to the process of sterilization. Several remedies for cleaning process were studied as shown in Table 8.
TABLE 8: REMEDIES OF CLEANING PROCESS
Cleaning methods Advantage Disadvantage
Clean in place
Designed for clean ability.
Automated.
Consistency.
Water/cleaner savings.
Time saving.
Equipment wear.
Ease of validation.
Automation.
The lack of assembly/disassembly.
Safety of operators.
Luck of flexibility.
High initial capital cost.
Use of more aggressive cleaning agents.
Agitated immersion Low capital cost.
Simplicity.
Process time.
Water and cleaning agent use.
Equipment limitations.
Automated parts washing
Consistent performance.
Chemical and water savings.
Safety.
Initial capital cost.
Unsuitable for delicate parts.
Ultrasonic washer Excellent cleaning for delicate items.
Low initial capital cost.
Significant manual processing.
Validation issues.
High pressure spraying
Relatively low capital cost.
Highly effective.
Large water use.
Equipment limitations.
Variability of manual systems.
Static immersion Low capital cost.
Simplicity.
Process time.
Water and cleaning agent use.
Equipment limitation.
Manual cleaning Simplicity.
Flexibility.
Low cleaning agent cost.
Inherent variability.
As shown in previous table the seventh remedy (manual cleaning) was the best solution as it has a solution for all problems, but with some of competition with remedy one especially that the (cleaning in place) in terms of will reduce process contamination, easy to implement, so the team also approved the first remedy. Selection between the two remedies was done by using selection matrix
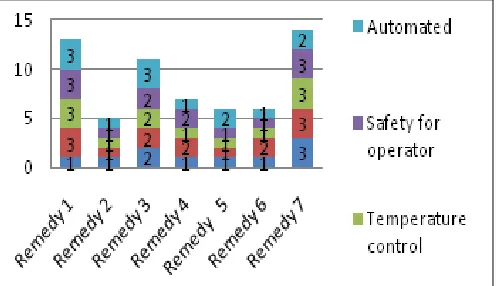
Table 9. In remedy selection matrix, each remedy had been rated for each criteria using 1-2-3 scale.
Bad remedy at this criterion.
Not bad and not good remedy at this criterion.
[image:11.612.63.565.654.751.2] Good remedy at this criterion.
TABLE 9: REMEDY SELECTION MATRIX
Criterion Remedy 1 Remedy 2 Remedy 3 Remedy 4 Remedy 5 Remedy 6 Remedy 7
Clean in place
Agitated immersion
Automated parts washing
Ultrasonic washers
High pressure spraying
Static Manual
cleaning
Cost 1 1 2 1 1 1 3
Microbial contamination control 3 1 3 2 1 2 3
Temperature control 3 1 2 1 1 1 3
Safety for operator 3 1 2 2 1 1 3
Automated 3 1 3 1 2 1 2
FIG.12: REMEDY SELECTION MATRIX
As shown from Fig. 12 the most suitable cleaning method was manual cleaning.
Control Phase.
[image:12.612.41.577.236.598.2]This phase explains the implementation of Six-Sigma control phase. A measurement bacterial count had been developed, implemented and carried out on a three months to measure standard deviation of bacterial count at (D.E.T) at all process. The bacterial count relied on the formation of the (D.E.T).
TABLE 10: CONTROL PHASE MEASUREMENT RESULTS Date Microcrystal
line
Take powder
Lactose monohydrate
Pepsin Pancreatine Coating solution
σ
1 Sep. 13 320 300 40 60 345 300 227.5
3 Sep. 13 410 380 45 65 160 300 226.6666667
6 Sep. 13 305 230 50 75 70 350 180
9 Sep. 13 115 20 60 80 100 200 95.8333333
12 Sep. 13 125 10 70 85 120 100 85
15 Sep. 13 335 15 30 40 120 200 123.3333333
18 Sep. 13 45 30 40 345 200 100 126.6666667
21 Sep. 13 30 320 60 360 345 300 235.8333333
24 Sep. 13 325 330 30 330 60 350 237.5
27 Sep. 13 55 40 220 100 70 260 124.1666667
30 Sep. 13 65 50 40 40 80 380 109.1666667
3 Oct. 13 75 30 45 30 90 280 91.6666667
6 Oct. 13 10 10 60 35 60 180 59.1666667
9 Oct. 13 25 15 170 340 70 300 153.3333333
12 Oct. 13 45 330 315 45 75 360 70
15 Oct. 13 185 120 15 360 85 410 195.8333333
18 Oct. 13 50 25 25 30 90 200 70
21 Oct. 13 35 30 35 20 200 260 96.6666667
24 Oct. 13 40 45 40 10 30 300 77.5
27 Oct. 13 30 80 45 405 40 200 133.3333333
30 Oct. 13 40 100 65 40 100 100 74.1666667
2 Nov. 13 45 25 100 60 120 210 93.3333333
5 Nov. 13 60 85 80 65 150 300 123.3333333
8 Nov. 13 470 30 445 70 170 320 250.8333333
11 Nov. 13 85 35 335 280 180 290 200.8333333
14 Nov. 13 90 245 240 75 400 310 226.6666667
17 Nov. 13 135 260 125 130 200 350 200
20 Nov. 13 40 65 420 480 100 400 250.8333333
23 Nov. 13 245 475 100 20 340 410 265
26 Nov. 13 300 400 230 400 380 410 353.3333333
29 Nov. 13 155 385 310 240 260 400 291.6666667
Average 138.3870968 145.645161 125.3225806 152.0967742 155.1612903 284.8387097 166.9086022
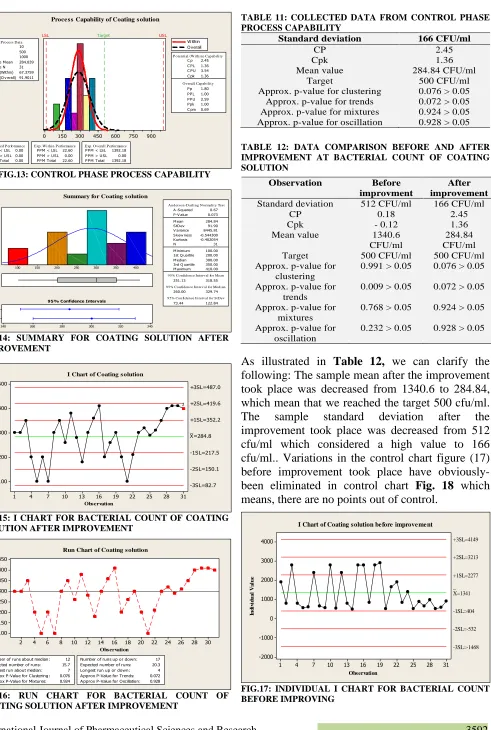
Process capability, I Chart for individual and Run Chart with statistical summary for (31 samples) for coating solution , using the data collected in the control phase from the Table 10 were done to assure the control phase process capability as shown in Fig.13, 14, 15, 16.
Table 11 showed that the Cp value 2.45 and the Cpk value 1.36 which indicated that, the process of bacterial count at coating solution is stable and
900 750 600 450 300 150 0
LSL Target USL
LSL 10
Target 500
U SL 1000
Sample M ean 284.839 Sample N 31 StDev (Within) 67.3759 StDev (O v erall) 91.9011
P rocess Data
C p 2.45 C P L 1.36 C P U 3.54 C pk 1.36
P p 1.80 P P L 1.00 P P U 2.59 P pk 1.00 C pm 0.69 Overall Capability P otential (Within) Capability
P P M < LSL 0.00 P P M > U SL 0.00 P P M Total 0.00 Observed P erformance
P P M < LSL 22.60 P P M > U SL 0.00 P P M Total 22.60 Exp. Within P erformance
P P M < LSL 1392.18 P P M > U SL 0.00 P P M Total 1392.18 Exp. Overall P erformance
Within Overall Proce ss Capability of Coating solution
FIG.13: CONTROL PHASE PROCESS CAPABILITY
400 350 300 250 200 150 100 Median Mean 340 320 300 280 260 240
1st Q uartile 200.00 M edian 300.00 3rd Q uartile 350.00 M aximum 410.00
251.13 318.55
260.00 329.74
73.44 122.84 A -S quared 0.67 P -V alue 0.073 M ean 284.84 S tDev 91.90 V ariance 8445.81 S kew ness -0.544300 Kurtosis -0.402054
N 31
M inimum 100.00 Anderson-Darling Normality Test
95% Confidence Interval for Mean
95% Confidence Interval for Median
95% Confidence Interval for StDev 95% Confidence Intervals
Summary for Coating s olution
FIG.14: SUMMARY FOR COATING SOLUTION AFTER IMPROVEMENT 31 28 25 22 19 16 13 10 7 4 1 500 400 300 200 100 Observation In di vi du al V al u e _ X=284.8 +3SL=487.0 -3SL=82.7 +2SL=419.6 -2SL=150.1 +1SL=352.2 -1SL=217.5 2
I Chart of Coating solution
FIG.15: I CHART FOR BACTERIAL COUNT OF COATING SOLUTION AFTER IMPROVEMENT
30 28 26 24 22 20 18 16 14 12 10 8 6 4 2 450 400 350 300 250 200 150 100 Observation C oa ti n g s ol u ti on
Number of runs about median: 12 Expected number of runs: 15.7 Longest run about median: 7 Approx P-Value for Clustering: 0.076 Approx P-Value for Mixtures: 0.924
Number of runs up or down: 17 Expected number of runs: 20.3 Longest run up or down: 4 Approx P-Value for Trends: 0.072 Approx P-Value for Oscillation: 0.928
Run Chart of Coating solution
FIG.16: RUN CHART FOR BACTERIAL COUNT OF COATING SOLUTION AFTER IMPROVEMENT
TABLE 11: COLLECTED DATA FROM CONTROL PHASE PROCESS CAPABILITY
Standard deviation 166 CFU/ml
CP 2.45
Cpk 1.36
Mean value 284.84 CFU/ml
Target 500 CFU/ml
Approx. p-value for clustering 0.076 > 0.05
Approx. p-value for trends 0.072 > 0.05
Approx. p-value for mixtures 0.924 > 0.05
Approx. p-value for oscillation 0.928 > 0.05
TABLE 12: DATA COMPARISON BEFORE AND AFTER IMPROVEMENT AT BACTERIAL COUNT OF COATING SOLUTION
As illustrated in Table 12, we can clarify the following: The sample mean after the improvement took place was decreased from 1340.6 to 284.84, which mean that we reached the target 500 cfu/ml. The sample standard deviation after the improvement took place was decreased from 512 cfu/ml which considered a high value to 166 cfu/ml.. Variations in the control chart figure (17) before improvement took place have obviously-been eliminated in control chart Fig. 18 which means, there are no points out of control.
31 28 25 22 19 16 13 10 7 4 1 4000 3000 2000 1000 0 -1000 -2000 Observation In d iv id u a l V a lu e _ X=1341 +3SL=4149 -3SL=-1468 +2SL=3213 -2SL=-532 +1SL=2277 -1SL=404
I Chart of Coating solution before improvement
FIG.17: INDIVIDUAL I CHART FOR BACTERIAL COUNT BEFORE IMPROVING
Observation Before improvment
After improvement
Standard deviation 512 CFU/ml 166 CFU/ml
CP 0.18 2.45
Cpk - 0.12 1.36
Mean value 1340.6
CFU/ml
284.84 CFU/ml
Target 500 CFU/ml 500 CFU/ml
Approx. p-value for clustering
0.991 > 0.05 0.076 > 0.05
Approx. p-value for trends
0.009 > 0.05 0.072 > 0.05
Approx. p-value for mixtures
0.768 > 0.05 0.924 > 0.05
Approx. p-value for oscillation
[image:13.612.74.565.44.774.2] [image:13.612.315.570.221.388.2] [image:13.612.55.569.545.728.2] [image:13.612.312.565.559.722.2]31 28 25 22 19 16 13 10 7 4 1 500
400
300
200
100
Observation
In
d
iv
id
u
a
l
V
a
lu
e
_ X=284.8 +3SL=487.0
-3SL=82.7 +2SL=419.6
-2SL=150.1 +1SL=352.2
-1SL=217.5
2
I Chart of Coating solution after improvement
FIG.18: INDIVIDUAL I CHART FOR BACTERIAL COUNT AFTER IMPROVING
The approximate P values for Mixtures were-increased to be higher than 0.05 after improvement took place.
CONCLUSION: After identifying, the root causes of the bacterial count of coating solution, the Systematic use of the Six-Sigma Methodology through the research, ensured savings in terms of money and give safety (D.E.T) for patient.
ACKNOWLEDGMENT: We are so grateful to the staff members of Misr University for Science & Technology and Arab Academy for Science and Technology, for their kind support.
REFERENCES:
1. Six sigma in Pharmaceutical Manufacturing Industry, Pharma mirror, leading on line pharma magazine, ISSN2219 76-3X, 2013.
2. Nagla Ahmed El Nabarawy, Rehab A. Abd Elmonem and
Hadel A. Abo Enin: Development of economic
transdermal patches containing lornoxicam for treatment of acute and chronic inflammatory models in albino rats (a preclinical study). International journal for pharmaceutical sciences and research 2014; 5.
3. J. Woodcock: The concept of pharmaceutical quality. American Pharmaceutical Review 2004; 7: 10–15. 4. Larson, K.: FDA to prescribe new drug manufacturing
standards. 2006.
5. Katarina Pavlovic and Vojislav Božanic: Lean and six sigma concepts application in pharmaceutical industry. International Journal for Quality research 2012; 6(1): 6. B. Greg: Six Sigma for Managers. McGraw-Hill, New
York, 2002.
7. D.L. Dahlstrom, S. Nikfar, A.A. Malekirad, and A.F. Behboudi: Reference Module in Biomedical Sciences Encyclopedia of Toxicology. Industrial Hygiene, Third Edition, 2014; 1032–1035.
8. Reham M. Haleem, Maissa Y. Salem, Faten A. Fatahallah, Laila E. Abdelfattah, Quality in the pharmaceutical industry – A literature review, Saudi Pharmaceutical Journal, 2013.
9. Xiaoyu Donga, Yi Tsonga and Meiyu Shena: Recent Developments in Statistical Approaches for Chemistry and Manufacturing Control (CMC) and Quality-by-Design (QbD) Statistical Considerations in Setting Product Specifications. Journal of Biopharmaceutical Statistics 2015; 25(2): 280-294.
10. Sharma O.P., Gupta V., Rathore G.S., Saini N.K., and Sachdeva K.: Six sigma in pharmaceutical industry and regulatory affairs a review. Journal of Natura Conscientia 2011; 2(1): 273-293.
11. http://healthcare.isixsigma.com/library/content.
12. www.sixsigmaway.com.
13. http://www.gafi.gov.eg/content/invsectorsdocs/Pharmaceu ticals%20value%20proposition.pdf: Invest in Egypt 2013. 14. Alexbank, Economic research Division, Pharmaceutical
Industry in Egypt 2010.
15. Mahour Mellat Parast: The effect of Six Sigma projects on innovation and firm performance. International Journal of Project Management 2011; 29 (1): 45–55.
16. David V. Chand: Observational Study Using the Tools of Lean Six Sigma to Improve the Efficiency of the Resident Rounding Process. Journal of Graduate Medical Education 2011.
17. www.improvement-skills.co.uk, Improvement Skills
Consulting Ltd, 2008.
All © 2013 are reserved by International Journal of Pharmaceutical Sciences and Research. This Journal licensed under a Creative Commons Attribution-NonCommercial-ShareAlike 3.0 Unported License.
This article can be downloaded to ANDROID OS based mobile. Scan QR Code using Code/Bar Scanner from your mobile. (Scanners are available on Google
Playstore)
How to cite this article: