IJPSR (2014), Vol. 5, Issue 11 (Research Article)
Received on 19 April, 2014; received in revised form, 03 July, 2014; accepted, 31 July, 2014; published 01 November, 2014
DEVELOPMENT AND VALIDATION OF ANALYTICAL METHOD FOR SIMULTANEOUS ESTIMATION OF MIGLITOL AND METFORMIN HYDROCHLORIDE IN TABLET DOSAGE FORM.
P. Nilam *, P. Pinkal and S. Khushbu
Department of Quality Assurance, Parul Institute of Pharmacy and Research, Parul Trust Limda, Ta. Waghodia, Dist. Vadodara 391760, Gujarat, India
ABSTRACT: A simple, rapid and precise stability indicating reverse phase high performance liquid chromatographic method has been developed for simultaneous estimation of Miglitol and Metformine Hydrochloride in their tablet dosage form. Chromatography was performed on a Phenomenex ODS C18 (250 X 4.6 mm) 5m column using Water: Methanol (50:50, v/v) pH: 4 mixture as a mobile phase. The detection was carried out at 235 nm with a flow rate of 1.0 mL/min. The retention times were 4.807 and 3.273 minutes for Miglitol and Metformine Hydrochloride, respectively. The linearity of the method was excellent over a concentration range 2.5 to 7.5μg/mL for Miglitol and 25 to 75μg/mL for Metformine Hydrochloride. The correlation coefficient was 0.997 and 0.999 for Miglitol and Metformine Hydrochloride, respectively. The limit of detection was 0.6607μg/mL and 1.740μg/mL for Miglitol and Metformine Hydrochloride, respectively. The limit of quantitation was 2.0021μg/mL and 5.2736μg/mL for Miglitol and Metformine Hydrochloride, respectively. The relative standard deviation values for repeatability, intraday precision and interday precision studies were less than 2 % and % recovery was between 98 % to 102 % for both drugs.
INTRODUCTION: Miglitol (MIG) is chemically (2R, 3R, 4R, 5S)-1-(2-hydroxyethyl)-2-(hydroxy methyl) piperidine-3, 4, 5-triol an oral anti-diabetic drug. It reversibly inhibits membrane-bound intestinal alpha-glucosidehydrolyze enzyme which hydrolyzes oligosaccharides and disaccharides to glucose and other monosaccharides in the brush border of the small intestine. In diabetic patients, this enzyme inhibition results in delayed glucose absorption and lowering of postprandial. Metformin (MET) is chemically N, N-dimethylimidodicarbonimidicdiamide.
QUICK RESPONSE CODE
DOI:
10.13040/IJPSR.0975-8232.5(11).4820-24
Article can be accessed online on:
www.ijpsr.com
DOI link: http://dx.doi.org/10.13040/IJPSR.0975-8232.5(11).4820-24
It is abiguanide class of oral anti-diabetic drugs. It improves hyperglycemia primarily through its suppression of hepatic glucose production and activates AMP-activated protein kinase. It also increases insulin sensitivity, fatty acid oxidation, peripheral glucose uptake and decreases absorption of glucose from the gastrointestinal tract.
Literature review revealed that several spectroscopic and chromatographic methods have been reported for estimation of Miglitol alone and in combination with other drugs also for Metformin Hydrochloride alone.
However, no method is reported for simultaneous estimation of these two drugs by HPLC in combined dosage form
MATERIALS AND METHODS: Chemicals and reagents:
Keywords:
Metformine Hydrochloride, Miglitol, RP-HPLC method
Correspondence to Author:
Nilam Patel
Department of Quality Assurance, Parul Institute of Pharmacy and Research, Parul Trust Limda, Ta. Waghodia, Dist. Vadodara 391760, Gujarat, India
Miglitol and Metformin in the form of gift samples were kindly supplied by Glenmark. Mumbai and zydus cadila Ahmedabad respectively. A combination of Miglitol (50 mg) and Metformin (500 mg) in tablet formulation was procured from
local pharmacy (Mignar 50-MF Glenmark Ltd).
N OH
OH
OH
[image:2.612.56.292.137.448.2]OH HO
FIGURE 1: STRUCTURE OF MIGLITOL
N
N
H
NH
2NH
NH
FIGURE 2: STRUCTURE OF METORMIN
HYDROCHLORIDE
Instrument and chromatographic condition:
For the Chromatographic analysis, Shimadzu HPLC system was used that was equipped with a UV detector. The separation was achieved on RP C18 column {125 x 4.6 mm, 5 micron particle size} using KH2PO4 water: methanol (50:50 v/v) pH4 as mobile phase. The pH of mobile phase was adjusted to 5 with OPA. The flow rate was 1.0 ml/min.
Preparation of Standard Stock Solution:
Accurately weighed 50 mg of Metformin HCl and 5 mg of Miglitol were transferred into 100 ml volumetric flask, to which 50 mL of Methanol was added and sonicated for 15 min, dissolved completely and diluted up to the mark with Methanol to give a stock solution containing 500 µg/mL of Metformin HCl & 50 µg/mL of Miglitol.
Preparation of Standard Working Solution:
Working solution was prepared by taking 1 ml of above stock solution into 10 ml volumetric flask and diluting it up to the mark with Methanol to get the final working solution containing 50 µg/mL of Metformin HCl & 5 µg/mL of Miglitol.
Method Validation:
The proposed method was validated in compliance with ICH guidelines for system suitability, linearity, accuracy, precision, specificity, robustness parameters by the following procedures.
System suitability:
Six replicates of solution containing 50 µg/mL of Metformin Hydrochloride and 5 µg/mL of Miglitol were analysed. % RSD of Peak area was calculated.
TABLE 1: SYSTEM SUITABILITY RESULTS FOR METFORMIN HYDROCHLORIDE AND MIGLITOL
Injection No. Peak Area
MET MIG
1 2695.278 619.291
2 2681.583 620.531
3 2706.074 609.293
4 2711.476 623.023
5 2697.918 619.908
6 2703.337 621.173
Mean 2699.277 618.86
SD 10.4155 4.8638
% RSD 0.385 0.7
Linearity:
Linearity of developed RP-HPLC method was studied by obtaining calibration curves of MET and MIG, ranging from 25-75 μg/mL for MET and 2.5-7.5 μg/mL for MIG. Table 2 shows the linearity data of MET and MIG. The linearity regression co-efficient (r2) values were found to be 0.999 and 0.997 for MET and MIG. Each Linearity equation obtained for MET and MIG were y = 54.24x – 29.87, and y = 121.4x + 0.993 respectively. Figure 3 and 4 shows calibration curves for MET and MIG respectively. High level of correlation coefficient indicates good linearity.
TABLE 2: LINEARITY DATA OF METFORMIN
HYDROCHLORIDE AND MIGLITOL
MET MIG
Con. μg/ml Peak area Con. μg/ml Peak area
25 1340.464 2.5 307.931
37.5 1979.133 3.75 454.708
50 2706.05 5.0 621.797
62.5 3332.042 6.25 725.655
[image:2.612.326.553.306.451.2] [image:2.612.318.567.678.752.2]FIGURE 4: CALIBRATION CURVES FOR MIG
FIGURE 3: CALIBRATION CURVES FOR MET
Accuracy:
The accuracy of the developed method was evaluated in triplicates by recovery studies at three different concentration levels of 80%, 100 %, and 120% for MET, MIG respectively. Known amounts of standard drug concentrations were added to the sample and peak area was determined.
The mean percentage recovery values are shown in
[image:3.612.49.300.51.359.2]Table 3. The mean recovery of the drugs was found to be in the range of 98- 102% indicating a high degree of accuracy for the developed method.
TABLE 3: ACCURACY RESULTS
Drug Level
Amt of Std taken (µg)
Amt of Std Recovered (µg)
Mean % Recovery
MET
80 45 44.75 99.75
100 50 49.80 99.70
120 55 59.46 99.67
MIG
80 4.5 4.40 99.98
100 5 4.90 99.83
120 5.5 5.41 99.91
Precision:
The precision was measured by intraday and interday. The % RSD of MET, MIG was calculated. The calculated values of % RSD for
MET and MIG are mentioned in Table 4 & 5. The results indicated a high degree of repeatability.
TABLE 4: INTRADAY PRECISION DATA FOR METFORMIN HYDROCHLORIDE AND MIGLITOL
Drug Target
conc.
Peak Area
Average SD %RSD
(µg/ml)
MET 25 131.506 1327.71 14.18 1.068161
25 1333.83
25 1337.82
MIG 2.5 305.778 612.97 0.964 0.315007
2.5 305.545
2.5 307.32
MET 50 2665.062 4026.22 18.67 0.695355
50 2692.62
50 2700.682
MIG 5 617.433 923.5223 10.54 1.720982
5 600.926
5 620.559
MET 75 3998.035 4026.226 25.15141 0.624689
75 4034.278
75 4046.366
MIG 7.5 925.121 923.5223 7.210172 0.780725
7.5 915.647
7.5 929.799
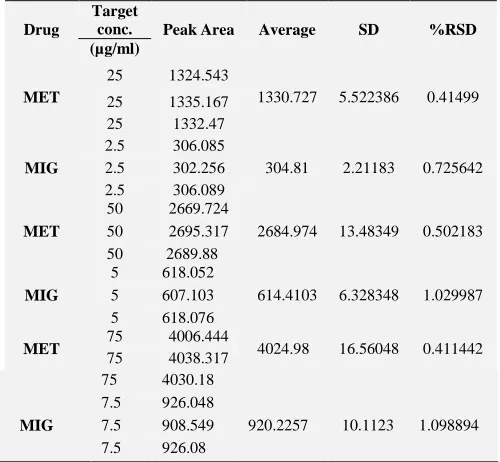
TABLE 5: INTERDAY PRECISION DATA FOR METFORMIN HYDROCHLORIDE AND MIGLITOL
Drug
Target
conc. Peak Area Average SD %RSD
(µg/ml)
MET
25 1324.543
1330.727 5.522386 0.41499
25 1335.167
25 1332.47
MIG
2.5 306.085
304.81 2.21183 0.725642
2.5 302.256
2.5 306.089
MET
50 2669.724
2684.974 13.48349 0.502183
50 2695.317
50 2689.88
MIG
5 618.052
614.4103 6.328348 1.029987
5 607.103
5 618.076
MET 75 4006.444 4024.98 16.56048 0.411442
75 4038.317
75 4030.18
MIG
7.5 926.048
920.2257 10.1123 1.098894
7.5 908.549
7.5 926.08
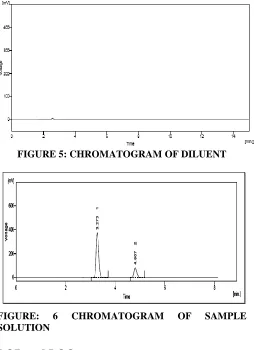
Specificity:
[image:3.612.314.563.112.383.2] [image:3.612.311.561.416.647.2] [image:3.612.59.284.574.688.2]MET 3.273 min and MIG 4.807 min. so, proposed method is specific in nature
FIGURE 5: CHROMATOGRAM OF DILUENT
FIGURE: 6 CHROMATOGRAM OF SAMPLE
SOLUTION
LOD and LOQ:
The LOD and LOQ were calculated from following equation:
LOD = 3.3 × (SD/Slope) LOQ = 10 × (SD/Slope)
Where, SD = Standard deviation of the Y- intercepts of the 5 calibration curves.
Slope = Mean slope of the 5 calibration curves. The results obtained are shown in Table 6.
TABLE 6: LOD AND LOQ FOR METFORMIN HYDROCHLORIDE AND MIGLITOL
Drug LOD LOQ
MET 1.7403 5.2736
MIG 0.6607 2.0021
Robustness:
To evaluate the robustness of the developed RP-HPLC method, small deliberate variations in the optimized parameters were made in chromatographic conditions like of pH, flow rate and wavelength.
[image:4.612.319.559.167.402.2]The effect of change in pH, flow rate and wavelength of detection on retention time and tailing factor were examined. The values obtained are mentioned in Table 7. The method was found to be unaffected by the small changes like ± pH, ± 0.1 ml/min in flow-rate of mobile phase and ± 1 nm in detection wavelength.
TABLE 7: RESULTS OF ROBUSTNESS
Parameters varied
Drug name
System suitability parameters (n=3)
Mean Peak Area ± %RSD
Tailing factor± %RSD
Resolution ± %RSD
pH 4.1 MET 2582.92±0.61 1.290±0.132 7.167
±0.211
MIG 590.73±1.64 1.283±0.234
pH 3.9 MET 2773.54±0.91 1.266
±0.687
7.153±0.168
MIG 635.08±1.13 1.284±0.743
At Wavelength 336
MET 2634.70±0.93 1.308±0.624 7.113±0.168
MIG 602.35±1.38 1.284±0.483
At Wavelength 334
MET 2767.80±0.75 1.277±0.458 7.167±0.239
MIG 634.94±0.91 1.305±0.639
At flow rate 1.1ml/min
MET 2635.75±1.09 1.290±0.172 7.134±0.327
MIG 604.64±1.02 1.279±0.234
At flow rate 0.9ml/min
MET 2797.68±0.88 1.286±0.216 7.140±0.571
MIG 641.27±1.02 1.310±0.389
RESULT AND DISCUSSION:
Optimized chromatography condition:
Chromatographic conditions were screened for mobile phase composition, mobile phase proportion, pH and flow rate Finally, mobile phase of Water: Methanol (pH 4) in the ratio of 50:50 v/v was optimized to give symmetric peak with short runtime at UV detection wavelength of 235 nm and flow rate at 1.0 mL/min was found to be appropriate with adequate separation between the two drugs. Chromatogram of MET, MIG at optimized chromatographic condition was recorded, the runtime was 4 min and the retention times of MET, MIG were found to be 3.273 and 4.807 min.
Assay:
with mobile phase. The above solution was filtered through whatman filter paper (0.45μ). 1 ml of above solution was taken and transferred to 10 ml volumetric flask. Volume was made up to the mark with the mobile phase to give a solution containing 50μg/mL of Metformin Hydrochloride and 5μg/mL of Miglitol.
From the peak area obtained for MET, MIG, the amount of the drug in the sample was calculated and was found to be 101.9% for MET, and 95.9% for MIG.
CONCLUSION: The proposed HPLC method was found to be economical, simple, sensitive, accurate, precise, specific and robust and can be used for the routine quality control analysis of MET, MIG in bulk as well as in tablet formulation.
ACKNOWLEDGEMENT: The Authors are thankful to Glenmark. Mumbai and zydus cadila Ahmedabad for providing gift samples of MET and MIG.
REFERENCES:
1. Http://www.drugbank.com/Miglitol/ 2. Http://www.drugbank.com/Metformin/
3. Shrivastva B, Baghel US and Sahu M: Stability indicating RP-HPLC method for estimation of miglitol in bulk and tablets. Indian J. Pharm. Science. 2010; 72(6): 781-784. 4. Chittora NC, Shrivastava A and Jain A: New RP-HPLC
method of miglitol in tablet dosage form including forced degradation studies and estimation in spiked rabbit plasma. J. Young Pharmacists. 2009; 1(4): 364-370.
5. The British Pharmacopoeia 2009, 6th Edn, Vol-2 Published by The Stationary office on behalf of the Medicines and Healthcare products Regulatory Agency. 1319-1320. 6. The United States Pharmacopoeia 2009, 27th Edn, Vol-3,
Published by the US Pharmacopoeial Convention. 2905-2906
7. The Indian Pharmacopoeia, 2014, 7th Edn Vol-2, Published by the Indian Pharmacopoeia Commission, Ghaziabad. 2186-2187.
8. Juvvigunta R, Reddy GN, Dhanalakshmi D and Ramesh B: A new analytical method development and validation for simultaneous estimation of sitagliptin and metformin hydrochloride in tablet dosage form by RP-HPLC. International J. Pharma Sciences. 2013; 3(5): 360-364.
9. Nayeem N and Alekya G: RP-HPLC method development
and validation of metformin and vidagliptin in bulk and pharmaceutical dosage form and their bio-analytical studies. American J. PharmaTech Research. 2013; 3(4): 358-369.
10. Patel SR, Karba PV, Kimbahune RV, Markad R and Nargund LVG: Development and validation of analytical method for quantitative estimation of miglitol and metformin in combined dosage form. J. Applied Pharma. Science. 2012; 2(6): 227-229.
All © 2014 are reserved by International Journal of Pharmaceutical Sciences and Research. This Journal licensed under a Creative Commons Attribution-NonCommercial-ShareAlike 3.0 Unported License.
This article can be downloaded to ANDROID OS based mobile. Scan QR Code using Code/Bar Scanner from your mobile. (Scanners are available on Google Playstore)
How to cite this article: