The Effects of Structure Orientation on the Growth of Fe
2B Boride
by Multi-Phase-Field Simulation
Raden Dadan Ramdan
1;*, Tomohiro Takaki
2, Kisaragi Yashiro
1and Yoshihiro Tomita
31
Graduate School of Engineering, Kobe University, Kobe 657-8501, Japan
2Graduate School of Science and Technology, Kyoto Institute of Technology, Kyoto 606-8585, Japan 3Department of Mechanical Engineering, Fukui University of Technology, Fukui 910-8505, Japan
A morphological evolution of the growth of Fe2B boride on steel substrate has been investigated using two dimensional (2D)
multi-phase-field (MPF) simulations. In order to evaluate competitive growth between boride seeds during the coating process, variations on boride seed orientation have been implemented. In addition, in order to have anisotropy growth of boride, anisotropy of interfacial energy is considered on the evaluation of phase-field evolution. It was observed that boride seed with structure orientation of 90shows a preferential growth as compared with the growth of boride seeds at other orientations. On the other hand, competitive growth between boride seeds at different crystal orientations can also be observed, where boride seeds approaching a preferential orientation angle grow faster and suppress the growth of boride seeds at the lower orientation angle. Both of these present observations agree with previous experimental observations that boride seeds tend to grow perpendicular to the substrate surface and the growth of boride seeds in this direction suppress growth in other directions. Additionally, it was observed that the preferential growth of boride is independent of the initial size of the boride seed. [doi:10.2320/matertrans.M2009227]
(Received June 30, 2009; Accepted October 9, 2009; Published December 25, 2009)
Keywords: boronizing, Fe2B boride, steel, multi-phase-field method, microstructure
1. Introduction
Boronizing has been recognized as one of the most conventional methods of surface hardening.1) Compared with other surface hardening processes, such as nitriding and carburizing, boronizing consistently outperforms these two processes. Compared with carburized or nitrided steels, the iron boride formed exhibits substantially higher hardness (1600–2000 HVs), whereas the first two products can reach a hardness of 650–900 HVs.2) In particular, boronized steel exhibits excellent resistance to a variety of tribological wear mechanisms, as well as oxidation mechanism.3–5)There are two types of boride products, FeB and Fe2B boride. The first
structure is considered to be harder than the latter structure, however it is more brittle. Therefore, normally having a single Fe2B boride in the structure is more preferable than the
presence of dual phase of boride. Regarding its outstanding characteristics, this process has been widely implemented in the broad area, and the most recent application of this process is in the biomedical field, as reported by Jeliset al.6)
It has been well understood that material properties are governed by their microstructural characteristics. They also depend on the growth behaviour during the transformation process. In the case of boride growth, it is considered that the morphology of boride structure significantly influences the adhesion bonding between boride layer and the substrate.7–10) The interaction between the substrate and boride during the growth process is also considered to determine the kind of morphology of boride structure. It was reported that Fe2B
boride layers produced by the conventional boronizing process to have a strong (0 0 1) growth texture11)and grow perpendicular to the surface substrate.12) The growth of boride along this direction is faster than in other directions, which is considered the preferential direction for boride
growth, and suppression of the growth of boride structure in other directions is considered to occur by the growth of boride in this direction.13)Therefore in order to confirm this important phenomenon, systematic study on this morpho-logical evolution is necessary.
Numerical study by phase-field method is expected to help our better understanding of the morphological growth of boride structure. This method has proven to be useful for investigating pattern formations during phase transformation, such as in the solidification process,14–17) solid-state trans-formation,18–20) coarsening and grain-growth,21–23) and sur-face diffusion.24,25) Compared with other numerical ap-proaches, such as dynamic continuum simulation or Monte carlo method, phasef-field simulation is thought to be easier since this method can simulate complicated morphological evolution without tracking the interface or surface, which normally cause mathematically difficulties. In the present study, multi-phase-field (MPF) method has been employed in order to perform the morphological evolution of single Fe2B
boride with the focus on the competitive growth between boride seeds with different crystal orientation. By using the MPF method, simulation on the growth of multiple grains can be done, and by setting artificially different orientation on each boride seed, we can expect competitive growth between each boride grain that has a different crystal orientation. In addition, anisotropy of interfacial energy is also introduced, thereby we can expect anisotropy growth of boride seed as was observed in experimental works.8,12) To the author’s knowledge, the present work is a volunteer for numerical works that evaluate the morphological evolution of Fe2B
boride. Previous numerical works on boride layer growth have focused on kinetic growth using the mass balance equation as the basic model.3,13)Here, the kinetic growth of boride layer merely depends on the kinetic diffusion of boron without considering the interfacial properties of Fe2B boride,
such as interfacial energy, thickness and mobility, which are very important in determine the mobility of the growth of
*Graduate Student, Kobe University. Present address: Institute of
this structure. In the present work, phase-field model for the growth of boride phase is derived from Ginzburg-Landau free energy functional that considers the free energy value from thermo-chemical database and related physical parameters, such as interfacial energy and thickness of the corresponding material. Several important parameters such as the coefficient of free-energy driving force, diffusivity of boron, activation energy and diffusion flux of boron were taken from our previous work.26)
2. Phase-field Model
In order to construct a multi-phase-field model for Fe2B
boride evolution, it is considered that a system contains N different phase field variables,1; 2; 3;. . .N, where each
phase-field is associated with the local density of a different phase or grain. The free energy functional of this system is given by the following equation,27)
F¼ Z V XN ¼1 XN ¼þ1 a 2
2 r rþW !
þfc
" #
dV;
ð1Þ where,aandWare the gradient coefficient and the height of double well potential between-th and-th grains, on the other hand fc is the free energy density in the grains. The phase field, , takes a value of 1 inside the -th grain, 0 inside other grains, and0< <1at grain boundary. Each of these phase-field variables are connected by the following constraint,
XN
¼1
¼1: ð2Þ
We then define the step function,, with¼1if0< < 1and¼0elsewhere. Using this step function, the number of locally present phasenis expressed as
n¼X
N
¼1
ðx;tÞ: ð3Þ
Henceforth,Nin the equations 1 and 2 will be substituted by nin the eq. (3).
In addition, in order to create anisotropy growth of Fe2B
boride, anisotropy is introduced by using anisotropy function for the gradient coefficient, aij. The gradient coefficient is
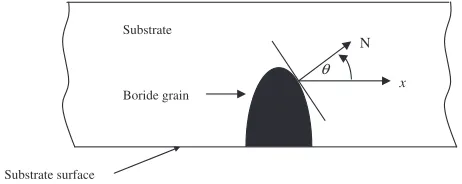
expressed as a function of, whereis the anti-clock wise interface orientation between x-axis and surface normal of boride as illustrated in the Fig. 1. The gradient coefficient that include the anisotropy function is then defined as
aijðÞ ¼
a
aij
1þu½1þucosfðoÞg; ð4Þ
whereaaijis constant related to grain boundary thickness and
grain boundary energy,0 is the crystal orientation of each
grain/phase,uis the strength of anisotropy andis the mode of anisotropy.
Taking into consideration the anisotropy of interfacial energy as aij¼aijðÞ, the evaluation of phase-field time
evolution is obtained explicitly as
@ @t ¼
Xn
j¼1
Mij
n
Xn
k¼1
ðk6¼i6¼jÞ
ðWikWjkÞkþ
Xn
k¼1
ðk6¼i6¼jÞ @
@x
ða2ika2jkÞ
2 @k @x ( ) þ @ @y
ða2ika2jkÞ
2 @k @y ( ) " # þ X n
k¼1
ðk6¼i6¼jÞ @ @x aik
@aik
@ @ @i;x
rirk
ajk
@ajk
@ @ @j;x
rjrk
þ
@
@y aik
@aik
@ @
@i;y
rirk
ajk
@ajk
@ @
@j;y
rjrk
2 6 6 6 4 3 7 7 7 5 þ8 ffiffiffiffiffiffiffiffi ij
p Gij 2 6 6 6 6 6 6 6 6 6 6 6 6 6 6 4 3 7 7 7 7 7 7 7 7 7 7 7 7 7 7 5
; ð5Þ
wherei, j andk are the local grain numbers from 1 ton at a numerical grid point, and subscriptð Þ;x andð Þ;yrefer to
derivation to x andy-axis. Here, the last term on the right hand side is the phenomenological thermodynamic driving force, where the magnitude of the driving force, Gij, is
given by the optimum free energy approach from our previous works.26)The free energy driving force is defined as GðXB;TÞ ¼GFe2B
m ðXB;TÞ GmðXB;TÞ. G
Fe2B
m and Gm
represent molar free energy of Fe2B and austenite, whereas
XB andT represent molar fraction and temperature respec-tively. Here, we use the molar fraction, (XB), term for the concentration value of boron, and it will be used for all
calculations involving boron concentration in the present works. In addition, as in our previous works,GFe2B
m andGm
are approached with the assumption that free energy has a parabolic relationship with concentration and their minimum free energy is similar with the free energy provided by the thermo-chemical database (SGTE database). The free energy of austenite and Fe2B boride in the present works are then
approached with the following equations26)
Gm¼GAVþ3:2106ð0:1XBÞ2; ð6Þ
GFe2B
m ¼3:810
6ðX
B0:33Þ2þoGFe2B; ð7Þ
N x θ Boride grain Substrate surface Substrate
Fig. 1 Boride and substrate system with the defined interface orientation of boride.
[image:2.595.311.542.73.165.2]where oGFe2B and GAV are the reference energy terms for
Fe2B and austenite, and are obtained from the optimization of
SGTE database value by Van Rompaeyet al.28) In addition, Wij, aaij and M
ij are energy barrier height,
reference value of gradient coefficient and mobility of phase-field respectively, and are related to the material parameters as follow29)
Wij¼
4 ij
; aaij¼ 2
ffiffiffiffiffiffiffiffiffi 2 ij
p
; Mij¼
2
8Mij; ð8Þ
whereis the grain boundary thickness, and ijandMijare
the grain boundary energy and mobility betweeni-th andj-th grains.
On the other hand, in order to provide the diffusion evolution of boron atoms during the growth of Fe2B boride
from austenite phase, we employ diffusion equation in a multi-phase system proposed by Tiaden et al.30) The total boron concentration is defined as a linear function of the local boron concentration, b
i , weighted by the phase-field
varia-bles,i. The local boron concentration is boron concentration
in each grain, where it may refers to boron concentration of Fe2B or Austenite. Initial boron concentration in Fe2B is set
at 0.33 molar fraction of boron, which is a stoichiometric compound of Fe2B. On the other hand, initial boron
concentration in austenite phase is set at 0.0035 molar fraction of boron. The total boron concentration is written as,
b¼X
N
i¼1
ibi ; ð9Þ
where the subscripts i and denote the number of grains (i¼1;. . .;N) and the phase (¼Fe2B or ) respectively.
Hereafter, since we consider 2 phases conditions, Fe2B and
austenite phases, the term of bulk phase corresponds to both of these phases. On the other hand boron concentration value here refers to molar fraction of boron (XB), as was previously described.
The diffusion equation for total boron concentration is expressed by the sum of diffusion fluxes of boron atoms in the individual grains as
@b
@t ¼ r:
XN
i¼1
iDbrb
i
!
; ð10Þ
whereDb is denoted as the diffusion coefficient of boron in the bulk and is given byDb ¼DboexpðQ=RTÞ, with
Dob is the pre-exponential factor of diffusivity in the bulk phase,Qis the activation energy in the bulkphase, andR andT are the gas constant and temperature respectively.
By having eqs. (5) and (10), we provide a system of coupled differential equations to calculate the evolution of phase-field variable and boron concentration with location and time which can describe the kinetic growth from austenite to Fe2B phase.
3. Numerical Algorithm to Solve MPF Equations
The usage of eq. (5) in the present study indicates that we do not have to solve eq. (5) on the grid point withn¼1and it is sufficient to save the values of notN butnphase fields. In addition, as is explained in the Ref. 29), the following algorithm is applied to solve eq. (5) very efficiently,
(1) Solve eq. (5) fornphase fields.
(2) During (1), if i at previous time step is zero and the
calculated incrementihas a minus value,i-th phase field
is put away from the phase field group on the grid point. And, steps (1) and (2) are repeated until all phase fields that satisfy the above condition are removed.
(3) The phase fields are rearranged in the order of largest to smallest. Phase fields from the largest until n-th are recorded. Here,nis a predefined maximum number of the recorded phase field.
(4) The phase fields are replaced by
i ¼i=P n
j¼1jso as
to satisfyPn
i¼1i ¼1.
(5) If a phase field is not saved at a grid point of (l,m) and its value at grid points of (l1, m1), or the nearest four neighbors, is not zero, the phase field is added to the phase field group on the grid (l,m).
The above algorithm is taken from Kimet al.31)and the iteration in steps (1) and (2) is added by Takaki et al.29)in order to achieve higher accuracy.
4. Numerical Conditions
The two-dimensional simulation is performed for the growth of Fe2B boride from austenite phase. The
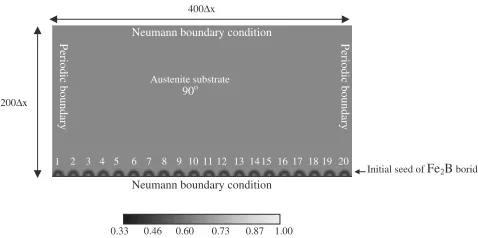
computa-tional domain size is400x200x, wherexis the grid size, which is set at 0.05mm. Initially 20 seeds of Fe2B boride
with different orientations are nucleated at the bottom side of the computational domain, as shown in the Fig. 2. Here, the bottom side is set as the substrate surface, where boron atoms diffuse and form the boride layer. Based on this description, the Neumann boundary condition is applied at the top and bottom of computational domain, while the gradient value is derived from the flux (J) of boron entering the surface, J¼ D@b=@y. where D is diffusivity of boron in Fe2B,
1:191013m2/s,26) and @b=@y is the average of surface concentration gradient. On the other hand, periodic boundary conditions are applied at the both left and right side of computational domain, representing that the computational domain used here is a small part of the boride-austenite steel substrate system.
In the Fig. 2, each boride seed is given a number from 1 to 20. Each boride seed number refers to a different orientation value given in the Table 1. By applying different orientation values of boride, it is expected to observe competitive growth between these boride seeds. Here, the austenite substrate orientation is set at crystal orientation of 90 degree.
400∆x
200∆x
Initial seed of Fe2B boride
Austenite substrate
1 2 4 5 6 7 8 9 10 11 12 13 14 15 16 17 18 19 20 Neumann boundary condition
Neumann boundary condition
Periodic boundary
Periodic boundary
90o
0.33 0.60 0.87
3
0.46 0.73 1.00
Fig. 2 Initial Fe2B borides colony with its number distribution of crystal
[image:3.595.306.545.639.758.2]On the other hand, other parameter’s conditions are as follows, the interface thickness,¼10x; interface energy, ¼1J/m2; and time increment,t¼0:0656s. In addition grain boundary mobility (M), is defined as M¼ M0expðQ=RTÞ, whereM0 is pre-exponential factor and is
set at 5105m2/Ns, Qis activation energy and is set at
2:56106J/mol,26) R is gas constant at 8.314 m3PaK1
mol1 and T is temperature at 1323 K. The value of
pre-exponential factor for diffusivity in both austenite and Fe2B
boride, as well as their activation energy for the calculation of eq. (10), were taken from our previous works26)based on the reference values provided by Keddam.32) These parameters were set at 4:4108m2/s and 1:13106m2/s for
pre-exponential diffusivity in boride and austenite, and 1:51 105and8:15104J/mol for activation energy in boride and austenite. Anisotropy strength, u, is set at 0.3 whereas the anisotropy mode, , is set at 2, representing two-fold symmetry. Experimentally, it was observed that, due to the tendency of Fe2B crystals to grow along a direction of
minimum resistance perpendicular to the external surface,8) boride structures prefer to have morphology in the form of a columnar shape with ‘toothing’ characteristics on the tips.7–10)As this type of structure has two-fold symmetry, the present simulation work also uses two-fold symmetry for the calculation of eq. (4), in order to obtain the appropriate approach for simulating this type of shape structure.
5. Numerical Results
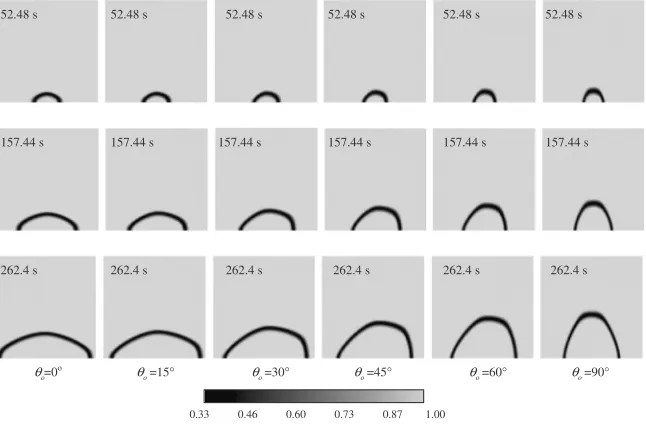
In order to understand boride seed characteristics that grows at different crystal orientations, Fig. 3 shows the growth of single seed of boride, which having different crystal orientation. Here, substrate orientation is set at 90 degrees and computational domain at 100x100x. We can observe from this figure that in general the tip interface shows a thicker interface as compared with the side interface. The variations of the interface width can be explained with the facts that the interface width varies with orientation and is proportional to the anisotropy function.33)On the other hand, boride seed with a crystal orientation of 90 degrees grows perpendicular to the substrate surface and shows faster growth at this direction compared with other seeds. In addition, as the crystal orientation approaches 90 degrees faster growth is observed. According to these facts, we can expect that boride seeds at a crystal orientation of 90 degrees will provide better directions for the growth of boride. This condition also agrees with previous experimental facts that boride grains tend to grow perpendicular to the substrate, which is considered giving the minimum resistance for crystal growth.16)
[image:4.595.47.291.95.199.2]Figure 4 shows the growth of multiple-seeds of boride with the initial condition as is described in the Fig. 2 and Table 1. We can observe that competitive growth of boride seeds with different crystal orientations occur. Boride seeds with higher orientation and approaching 90 degrees or perpendicular to the substrate grow higher and suppress the growth of its neighbors, which having a lower orientation angle. As is the case of boride seeds number 1, 2, 3, 4 and 5, which have an orientation angle of 24.88, 79.30, 20.69, 38.33 and 69.67 degree respectively. It can be observed, that boride seeds number 2 and 5 grow fast compared with their neighbor and suppress the growth of boride grain with lower orientation angles. This condition agrees with previous results for the growth of single boride seed, that boride seeds with orientation angles approaching 90 degrees grow fast
Table 1 Related number of boride seeds from Fig. 2 and their orientation angle.
No
Boride seeds orientation
(degree) No
Boride seeds orientation
(degree) No
Boride seeds orientation
(degree) No
Boride seeds orientation
(degree)
1 24.88 6 57.26 11 75.97 16 0.16
2 79.30 7 1.32 12 70.70 17 19.40
3 20.69 8 46.70 13 89.99 18 44.81
4 38.33 9 83.82 14 52.85 19 85.10
5 69.67 10 9.45 15 9.16 20 51.83
52.48 s
157.44 s
262.4 s
52.48 s
157.44 s
262.4 s
52.48 s
157.44 s
262.4 s
52.48 s
157.44 s
262.4 s
52.48 s
157.44 s
262.4 s
52.48 s
157.44 s
262.4 s
θο=0o θο =15° θο =30° θο =45° θο =60° θο =90°
0.33 0.46 0.60 0.73 0.87 1.00
Fig. 3 The growth of single boride seeds with different crystal orientation (the grey scale shows distribution of phase-field).
[image:4.595.138.461.557.769.2]compared with lower orientation angle. Real Fe2B boride
growth as observed in the experimental works,12,34)structures might grow at a different crystal plane. And it was observed, Fe2B boride that grow on the (001) crystal plane, which is
perpendicular to the substrate, grow faster than the other crystal planes and suppress the growth of Fe2B boride on
other crystal planes. Therefore the present crystal orientation refers to the growth of Fe2B boride seeds at different crystal
planes in the real material, and by using this approach we can capture competitive growth of boride seeds with different crystal orientations, which is observed in the experimental observation.
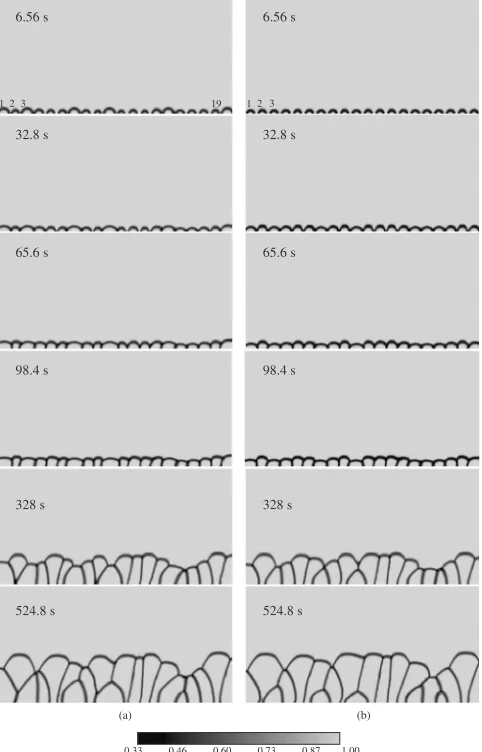
Figure 5 shows the time slice for the growth of multiple-seeds of boride, while Fig. 5(a) shows variation of initial boride seed size. Figure 5(b) uses homogeneous initial size of boride similar with the condition in the Fig. 4. Here, we consider that different sizes of boride seeds might have different surface curvature and thus have a chance to influence interfacial directions. Therefore, we should try to evaluate whether variations of initial size of boride seeds have significant influences on their growth, which have different crystal orientation. To perform this evaluation, the distribution orientation of boride seeds for Fig. 5(a) and (b) is similar to the previous condition in the Fig. 4, and in the case of Fig. 5(b), the initial seed size is also similar to Fig. 4. In Fig. 5(a), several boride seeds with higher orientation angles are set at smaller sizes compared with its neighbor, i.e. in the case of boride seeds number 2 and 19 which have smaller sizes compared with its neighbor. It can be observed in the Fig. 5(a), that the bigger seeds with lower orientation angles can ‘compete’ against the smaller but higher orientation boride seeds only at the initial stage, i.e. in the case of boride seeds number 2 and its neighbors up to 65.6 seconds. After this time, boride seed 2 starts to grow higher and suppress the growth of its neighbors. On the other hand in the Fig. 5(b), we can observe that boride seed number 2 starts to surpass the growth of its neighbor earlier than in Fig. 5(a). In addition, looking at the final boride layer produced by the two cases, we can only observe small differences in morphologies between the two cases. By having these facts, we may consider that the condition of initial boride seeds size might affect kinetic growth only at the early stages, whereas the later stage shows similar result in both cases, and the growth is dependent on the crystal orientation of each boride seed. Therefore, in general we can conclude conditions for initial
boride seeds size do not significantly influence preferential growth, where the bigger seeds at lower orientation angles can not suppress the growth of smaller boride seeds with higher orientation angles.
Unfortunately, compared with experimental observation of Fe2B boride that shows sharp structure of this phase,12)the
present works has not been able to capture a sharp boride 65.6 s 196.8 s 328 s 459.2 s
590.4 s 721.6 s 852.8 s 984 s
1 2 3 4 5 2
3 4
5 1
2
3 4
5
1
2
3 4 5
1
0.33 0.46 0.60 0.73 0.87 1.00
Fig. 4 The growth of multiple-seed of boride with different crystal orientation (the grey scale shows distribution of phase-field).
(a) (b)
6.56 s
32.8 s
65.6 s
98.4 s
328 s
524.8 s
6.56 s
32.8 s
65.6 s
98.4 s
328 s
524.8 s
1 3 19 1
0.33 0.46 0.60 0.73 0.87 1.00 3
2 2
[image:5.595.93.504.72.212.2] [image:5.595.307.548.255.631.2]structure. Therefore, it will be our homework in the future to simulate sharper structures of boride, while maintaining boride growth as it is observed in experimental works.
6. Conclusions
Multi-phase-field simulations for the study of the growth of Fe2B boride on the steel substrate have been well
performed with the main focus on the effect of structure orientation on the morphological growth of Fe2B boride.
In order to obtain an appropriate growth of this structure, a consideration on the anisotropy dependence of interfacial energy is taken into account in the phase-field evolution model and variations of boride seeds with different orienta-tions have also been taken into consideration. It is observed that a single Fe2B boride, which grows perpendicular to
the substrate, shows preferential growth and is in a good agreement with previous experimental observations. In addition, competitive growth between Fe2B seed at different
orientation angles can be observed, where boride seeds with orientation angles approaching preferential direction grow higher and suppress their neighbors with lower orientation angles. On the other hand, it was also observed that preferential growth direction for boride seeds is independent of the initial sizes. It is necessary for the future works to simulate a sharper structure of boride in order to simulate the more appropriate morphology of Fe2B boride layers.
Acknowledgment
Thanks are given to the Ministry of Education, Culture, Sports, Science and Technology Japan, for supporting the present research.
REFERENCES
1) W. Ficht: Mater. Design2(1981) 276–286.
2) B. Venkataraman and G. Sundararajan: Surf. Coat. Tech.73(1995) 177–184.
3) K. H. Habig and R. C. Fisher: Tribol. Int.14(1981) 209–215. 4) W. Ficht: Heat Treat. Met.10(1983) 79–80.
5) P. Jain and G. Sundararajan: Surf. Coat. Tech.149(2002) 21–26.
6) E. Jelis: Bioeng. Conf., 2005, Proc. IEEE 31st Annual Northeast (2005) pp. 193–194.
7) O. Ozdemira, M. Ustab, C. Bindala and A. H. Ucisik: Vacuum80
(2006) 1391–1395.
8) Uslu, H. Comert, M. Ipek, O. Ozdemir and C. Bindal: Mater. Design28
(2007) 55–61.
9) C. Meric, S. Sahin, B. Backir and N. S. Koksal: Mater. Design27
(2006) 751–757.
10) I. C. Elikyureka, B. Baksana, O. Torunb and R. Gu¨rler: Intermetall.14
(2006) 136–141.
11) J. H. Mass, G. H. Bastin, F. J. J. Vanloo and R. Metselaar: J. Appl. Cryst.17(1984) 103.
12) C. Badini and D. Mazza: J. Mater. Sci.23(1988) 3061–3066. 13) C. H. Xu, W. Gao and Y. L. Yang: J. Mater. Proc. Tech.108(2001)
349–355.
14) D. M. Anderson, G. B. McFadden and A. A. Wheeler: Ann. Rev. Fluid Mech.30(1998) 139–165.
15) A. A. Wheeler, W. J. Boettinger and G. B. McFadden: Phys. Rev. A45
(1992) 7424–7439.
16) B. Bottger, U. Grafe, D. Ma and S. G. Fries: Mater. Sci. Tech.16(2000) 1425–1428.
17) I. Loginova, G. Amberg and J. A˚ gren: Acta Mater.49(2001) 573–581. 18) A. Onuki: J. Japan Soc. Japan58(1989) 3065–3069.
19) D. Y. Li and L. Q. Chen: J. Phase Equilib.19(1998) 523–528. 20) J. W. Cahn, S. C. Han and G. B. McFadden: J. Stat. Phys.95(1999)
1337–1360.
21) D. Fan, S. P. Chen, L. Q. Chen and P. W. Voorhees: Acta Mater.50
(2002) 1895–1907.
22) C. Sagui, D. Orlikowski, A. Somoza and C. Roland: Phys. Rev. E58
(1998) 569–577.
23) I. Steinbach, F. Pezzolla, B. Nestler, M. Seeßelberg, R. Prieler, G. J. Schmitz and J. L. L. Rezende: Physica D94(1996) 135–147. 24) F. Leonard and R. C. Desai: Phys. Rev. B58(1998) 8277–8288. 25) H. P. Leo and W. C. Johnson: Acta Mater.49(2001) 1771–1787. 26) R. D. Ramdan, T. Takaki and Y. Tomita: Mater. Trans. 49(2008)
2625–2631.
27) I. Steinbach and F. Pezzolla: Physica D134(1999) 385–393. 28) T. V. Rompaey, K. C. Hari Kumar and P. Wollants: J. Alloy. Compd.
334(2002) 173–181.
29) T. Takaki, T. Hirouchi, Y. Hisakuni, A. Yamanaka and Y. Tomita: Mater. Trans.49(2008) 2559–2565.
30) J. Tiaden, B. Nestler, H. J. Diepers and I. Steinbach.: Physica D115
(1998) 73–86.
31) S. G. Kim, D. I. Kim, W. T. Kim and Y. B. Park: Phys. Rev. E74
(2006) 601–605.
32) M. Keddam: Appl. Surf. Sci.236(2004) 451–455.
33) G. B. McFadden, A. A. Wheeler, R. J. Braun, S. R. Coriell and R. F. Sekerka: Phys. Rev. E48(1993) 2016–2024.
34) C. H. Xu, J. K. Xi and W. Gao: Scr. Mater.34(1996) 455–461.