5061
AN OPTIMIZATION OF PERTURB AND OBSERVE MPPT
ALGORITHM BASED ON FUZZY LOGIC FOR PV SYSTEM
1O. LAGDANI, 1M.TRIHI, 2B.BOSSOUFI
1Department of Physics, Theoretical and Applied Physics Laboratory, University Hassan II Aïn Chock Faculty of Sciences, Casablanca, Morocco.
2 LISTA Laboratory, Faculty of Sciences Dhar El Mahraz, University Sidi Mohammed Ben Abdellah, Fez, Morocco.
E-mail: 1[email protected] ,
ABSTRACT
Several approaches of the MPPT techniques have been used in distinct ways. In this work, a new adaptive P&O algorithm with variable step size has been studied and implemented using fuzzy logic controller. The proposed method is evaluated to optimize maximum power point tracking (MPPT) performance of photovoltaic (PV) systems and it has been simulated using MATLAB/Simulink environment and compared to the conventional P&O algorithm under different insolation.
Keywords: Photovoltaic (PV), Maximum Power Point Tracking (MPPT), Perturb and Observe (P&O),
Variable step-size, Modified Perturb and Observe (MP&O).
1. INTRODUCTION
In the present century, the world needs more energy resources to become independent of conventional sources, that can be achieved using photovoltaic energy (PV) to respond to this demand [1].
Photovoltaic generation systems are used to transform one of the most natural energy sources due to the continuous cost reduction, stable system, rapid technological progress, being maintenance and pollution free. They have shown a large potential unfulfilling the growing world's energy demand and have attracted much of interest from many scientists and engineers nowadays [2-3-4].
Many solar energy researches are focused to increase cell efficiency through manufacturing technologies, to improve energy quality and to optimize the production of photovoltaic energy injected into the electricity grid and also for extracting a maximum power called MPPT (Maximum Power Point Track) [5].
The main advantages of MPPT controllers used in PV systems are [6]:
➢ They supply more power, depending on temperature and weather conditions.
➢ They increase the voltage of the system by connecting PV modules in series, which
adds flexibility and reduces the wiring gauge.
➢ They offer a cost savings in the transmission wire required for the establishment of the photovoltaic system. Many MPP tracking (MPPT) methods have been developed and executed.
They differ in popularity, hardware implementation, complexity, convergence speed, sensors required, cost and in different aspects. In fact, that it has become very hard to adequately determine which method, recently proposed or existing, is most suitable for a given PV system [7], [8].
Various types of MPPT algorithm such as hill climbing, voltage feedback, current feedback, perturb and observation, incremental conductance, fuzzy logic, and neural network have been discussed [9].
5062
2. SOLAR ARRAY MODEL
A solar cell is the fundamental element of a solar panel which converts sunlight into electricity. [5].
A photovoltaic module is composed of multiple solar cells wired together in series to boost the voltage or in parallel to increase the current, each solar cell can be modeled by using a current source, a diode and two resistors named as Series Resistance (Rs) and Shunt Resistance (Rsh) [10].
[image:2.612.333.501.152.466.2]This model is called a single diode model of a solar cell. Two diode models can also be used, but only single diode modeling approach is considered here in Figure 1 [9].
Figure 1: Equivalent circuit model of PV cell
The characteristic equation of the equivalent solar cell circuit can be expressed by as following:
𝐼 𝐼 𝐼 𝑒 1
𝑉 𝐼 𝑅
𝑅
(1)
Where I is the current generated by the incident light, k is Boltzmann constant, m is the diode emission factor, q is the electron charge and I is the saturation current.
The output current and voltage of the solar cell is represented by I and V respectively [11].
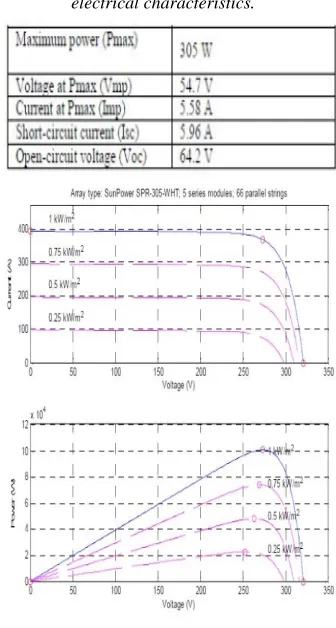
The PV module applied in this study uses 330 SunPower modules (SPR-305E-WHT-D) consists of five series strings of 66 cells each. This system is simulated for several values of irradiance (kW/m2). Its most important electrical specifications are represented in table 1[12].
Figure 2 illustrates I-V and P-V characteristics curves of the array under different values of irradiance at constant temperature 25°C [13].
In a Maximum Power Point Tracker (MPPT) a DC-DC converter is integrated between the PV arrays and load to reach maximum output power of PV system. The operating point of PV module is always at peak power by implementing different MPPT algorithms.
Different algorithms and a number of DC-DC converter topologies are used for maximize the output of the PV system [14].
3. THE PERTURB & OBSERVE (P&O)
METHOD WITH THE FIXED STEP-SIZE
Because of its simple structure, the Perturb and Observe (P&O) algorithm is widely used in MPPT methods. [15].
[image:2.612.87.296.287.438.2]It makes a decision that can increase or decrease of the solar array voltage by changing the duty cycle.
Figure 2: I-V and P-V characteristics of the Solar PV Array at 25°C Table 1:SunPower SPR-305-WHT PV array
[image:2.612.100.284.502.559.2]5063 If the operating point is on the left side of the MPP, by incrementing (decrementing) the voltage, the PV array’s output power increases (decreases). Whereas, incrementing (decrementing) the voltage decreases (increases) the PV power when the operating point is located on the right side of the MPP [16].
The step size ΔS is a very important parameter, it is the basis of the increase and decrease of the duty cycle.
If ΔS chosen is small, the system converges slowly towards the MPP and hence the desired duty cycle level is not reached. If ΔS is high, the system oscillates around the MPP [17].
Therefore, with fixed step-size, tracking the MPP does not present a satisfactory compromise between steady-state oscillation and dynamic-condition.
The choice of a step-size for the P&O algorithm has always been since it can significantly affect the global performance of the algorithm. Therefore, the proposed modified P&O MPPT algorithm with variable step-size improves the dynamics speed and eliminates the steady-state oscillations [16].
4. MODIFIED PERTURB & OBSERVE
(P&O) METHOD
The use of traditional P&O algorithm can’t satisfy simultaneously during the steady state both performance requirements in terms of fast dynamic response and high precision [18].
In case of rapid changes in irradiance, the P&O method may become unstable and the step-size affects strongly the tracking performance [19]. Indeed, if the step size is large, the oscillation around the peak point will increase during the steady state which will induce a considerable loss of power output.
The new method is applied to find a useful way that will improve the characteristics of both the dynamics and the performance of a stable state [18].
The proposed MPPT algorithm is based on the conventional P&O algorithm using a fuzzy logic controller to provide a variable step size to eliminate the limitations that are present in the implementation of the conventional P&O algorithm [20].
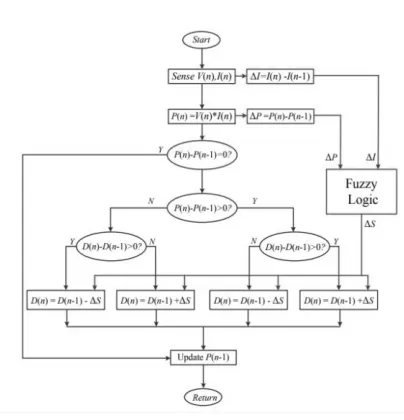
The flowchart and synoptic diagram of the modified P&O algorithm with variable step-size are shown respectively in Figure 3 and 4.
[image:3.612.321.523.130.340.2]
Figure 3: The proposed P&O algorithm with variable step-size
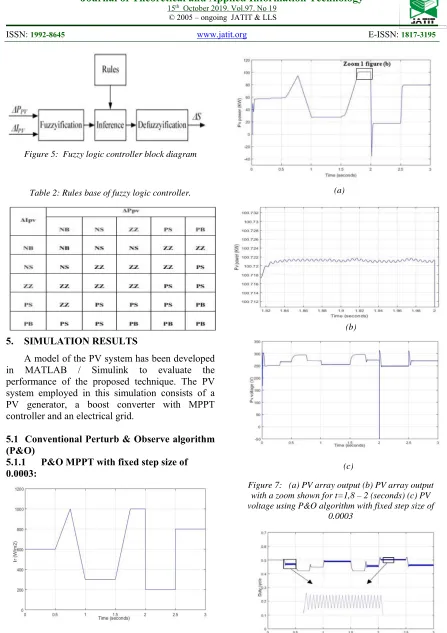
Among the most powerful control techniques is the Fuzzy Logic Controller (FLC), which can vary the step-size. Indeed, it is able to work with inaccurate inputs, without the need for a specific mathematical model. The fuzzy logic algorithm includes four different steps: fuzzification, rules (Table 2), inference and defuzzification [21], [22].
As can be seen in Figure 5, the input variables of the FLC are (ΔPpv) the variation of PV power and (ΔIpv) the variation of PV current, while the variable step-size (ΔS) is the output of the FLC [23].
[image:3.612.325.524.364.489.2]5064
[image:4.612.265.524.51.516.2]Figure 5: Fuzzy logic controller block diagram
Table 2: Rules base of fuzzy logic controller.
5. SIMULATION RESULTS
A model of the PV system has been developed in MATLAB / Simulink to evaluate the performance of the proposed technique. The PV system employed in this simulation consists of a PV generator, a boost converter with MPPT controller and an electrical grid.
5.1 Conventional Perturb & Observe algorithm (P&O)
[image:4.612.92.300.245.390.2]5.1.1 P&O MPPT with fixed step size of 0.0003:
Figure 6: Solar Irradiation
Figure 8: Solar Duty cycle waveform of P&O algorithm with fixed step size of 0.0003
(a)
(b)
(c)
Figure 7: (a) PV array output (b) PV array output with a zoom shown for t=1,8 – 2 (seconds) (c) PV voltage using P&O algorithm with fixed step size of
[image:4.612.342.519.575.687.2]5065
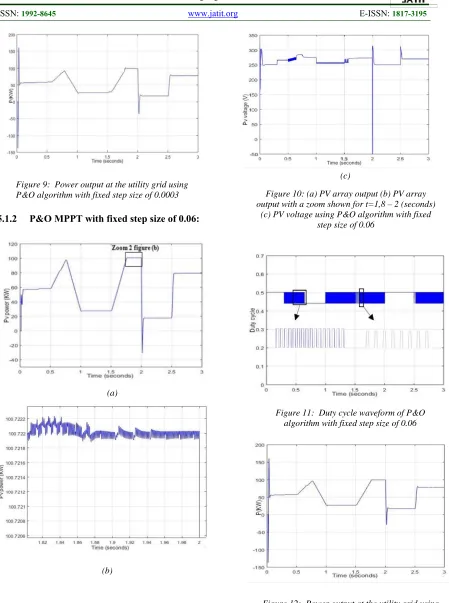
5.1.2 P&O MPPT with fixed step size of 0.06:
[image:5.612.93.542.65.668.2]Figure 9: Power output at the utility grid using P&O algorithm with fixed step size of 0.0003
Figure 11: Duty cycle waveform of P&O algorithm with fixed step size of 0.06 (a)
(b)
(c)
Figure 10: (a) PV array output (b) PV array output with a zoom shown for t=1,8 – 2 (seconds)
[image:5.612.95.304.305.633.2](c) PV voltage using P&O algorithm with fixed step size of 0.06
[image:5.612.344.540.319.478.2]5066
5.1.3 Comparative Study of Results
Time
MPPT t (seconds) 0.25 0.75 1.25 1.75 2.25 2.75
P&O with step-size = 0.0003
P (KW) 56.41 87.49 27.2 82.46 17.34 78.39
PV power
(KW) 57.13 89.63 27.58 85.5 17.67 79.4 PV voltage (V) 251.1 294.7 256 297.2 249.9 270
Duty cycle 0.5 0.42 0.48 0.42 0.49 0.45
P&O with step-size = 0.06
P (KW) 56.41 94.51 27.19 94.93 17.33 78.36 PV power
(KW)
57,13 97.07 27.57 98.33 17.66 79.4
PV voltage (V) 251.1 285.1 257.9 273.8 250.4 270.7
Duty cycle 0.5 0.44 0.44 0.5 0.5 0.44
Table 3 summarizes the results of the comparison between P & O MPPT technique for two distinct values of step size.
We notice that the algorithm with a fixed step size of 0.06 shows good dynamic performance but large value of oscillations in steady state and for step size of 0.0003, it takes a long time to reach the desired operating point and therefore the system reacts slowly to the change of solar irradiance.
5.2 Modified Perturb & Observe Algorithm (MP&O)
By comparing both figures 7 (a) and 10 (a), it is easy to see that the oscillation of the power output of the PV array is greater around MPP when the perturbation step size increases, and smaller when the step-size decreases.
A large step size causes fast dynamic responses. However, the oscillations are excessive in the steady state which results a low efficiency.
This situation is reversed when the MPPT is executed with a very small step size.
[image:6.612.92.520.265.468.2]So we could say that the P & O method depends on its step size.
[image:6.612.92.500.530.703.2]Table 3: Tracking performance comparison between P&O MPPT with fixed step size of 0.0003 and 0.06.
5067
6. CONCLUSION
In this paper, a Modified Perturb and Observe algorithm with a variable step-size based on fuzzy logic is implemented for a grid-connected PV system to ameliorate the efficiency of photovoltaic systems. This technique has been applied and compared with the traditional P & O algorithm using MATLAB / Simulink software.
It has been reported that the modified method can reach the maximum power point quickly and without oscillations compared to the traditional P & O method.
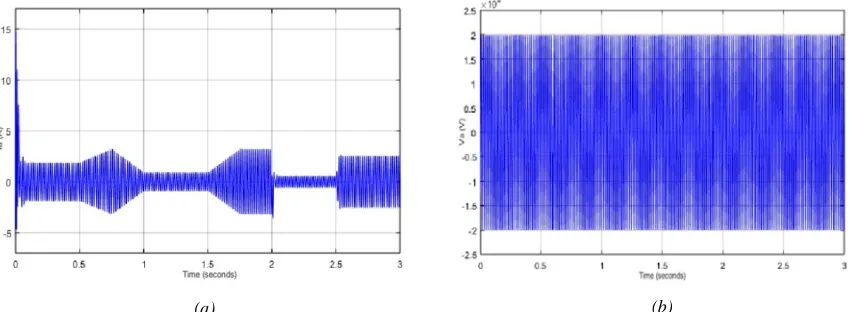
[image:7.612.89.518.61.247.2](a)
Figure 15: Curve of variation of the output (a) Current, (b) Voltage of the electrical network
The power output of the conventional and modified P&O algorithm has been compared in Figure 14.
The results show clearly that variable step-size MPPT gives a fast response with oscillation-free of both steady-state and transient condition.
As demonstrated in the zoom 2 of Figure 14 (b) the proposed P & O method follows the maximum power point faster than the conventional P & O method.
Figure 15 (a) and (b) shows respectively the current output and the voltage of the electrical network which is stable at all times. We can conclude that the proposed method is more suitable and effective for working with the PV system connected to the grid under climate changes.
[image:7.612.90.515.291.447.2]The performance of MPP tracking has a remarkable influence on the total PV efficiency of the photovoltaic system; With a rapid transient response and fewer oscillations, the amount of photovoltaic energy produced is increasing and vice versa, then the implementation of the proposed MPPT method is therefore desired to improve the yield.
Figure 14: Simulation results of modified and conventional perturbation and observation method: Power output at the utility grid
5068 The simulation results of these studies validate the effectiveness of the proposed MPPT algorithm, which improves both stability and the dynamic performances of the photovoltaic power system in all tested cases.
REFRENCES:
[1] V. Salas, E. Olías, A. Barrado, A.cLázaro, “Review of the maximum power point tracking algorithms for stand-alone photovoltaic systems”, Solar Energy Materials and Solar Cells, Vol. 90, Issue 11, pp. 1555–1578, 2006.
[2] A. Al-Diab, C. Sourkounis, “Variable step size P&O MPPT algorithm for PV systems”, Proceedings of the 12th International Conference on Optimization of Electrical and Electronic Equipment, 2010.
[3] N. A. Kamarzaman, C. W. Tan, “A comprehensive review of maximum power point tracking algorithms for photovoltaic systems”, Renewable and Sustainable Energy Reviews, Vol. 37, pp. 585–598, 2014.
[4] A. Jusoh, T. Sutikno, TK. Guan, S. Mekhilef, “A Review on favourable maximum power point tracking systems in solar energy application”, TELKOMNIKA (Telecommunication Computing Electronics and Control) Vol. 12, No. 1, pp. 6-22, March 2014.
[5] O. Ibrahim, N. Z. Yahaya, N. Saad, M. W. & Umar, “Matlab/Simulink model of solar PV array with Perturb and Observe MPPT for Maximizing PV array efficiency”, IEEE Conference on Energy Conversion, 2015. [6] C. R. Algarín, J. T. Giraldo & O.
R.odríguez Álvarez, “Fuzzy Logic Based
MPPT Controller for a PV
System”, Energies, MDPI, Open Access Journal, Vol. 10, Issue 12, pp. 1-18, December 2017.
[7] Trishan Esram, d Patrick L. Chapman, “Comparison of Photovoltaic Array Maximum Power Point Tracking Techniques”, IEEE Transactions On Energy Conversion, Vol. 22, No. 2, pp. 439-449, June 2007.
[8] R. El Gouri, M. Ben Brahim, L. Hlou, “A Comparative Study of MPPT Technical Based On Fuzzy Logic And Perturb Observe Algorithms for Photovoltaic Systems”, Journal of Theoretical and
Applied Information Technology, Vol. 58, No.2, pp. 336-346, 20th December 2013. [9] Hasan Mahamudul, Mekhilef Saad, and
Metselaar Ibrahim Henk, “Photovoltaic System Modeling with Fuzzy Logic Based Maximum Power Point Tracking Algorithm”, International Journal of Photoenergy, pp. 1-10, 2013.
[19] T Ikegami, T. Maezono, F. Nakanishi, Y. Yamagata, K. Ebihara, “Estimation of equivalent circuit parameters of PV module and its application to optimal operation of PV system”, Solar Energy Materials & Solar Cells, Vol. 67, Issues 1–4, pp. 389-395, 2001.
[11] M. Azzouzi, D. Popescu, M. Bouchahdane, “Modeling of Electrical Characteristics of Photovoltaic Cell”, Journal of Clean Energy Technologies, Vol. 4, No. 6, pp. 414-419, 2016.
[12] M. Lamnadi, M. Trihi, B. Bossoufi, A. Boulezhar, “Comparative study of IC, P&O and FLC method of MPPT algorithm for grid connected PV module”, Journal of Theoretical and Applied Information Technology, Vol. 89. No. 1, pp. 242- 253, 15th July 2016.
[13] A. Kumar, M. Kumar, Dattatraya H. Nagaraj, Amanpreet Singh, Jayanthi Prattapati, “Implementation of MPPT Algorithm for Grid Connected PV Module with IC and P&O Method”, International Journal of Electrical, Computer, Energetic, Electronic and Communication Engineering Vol. 8, No. 7, pp. 1201 – 1208, 2014.
[14] P. Kinjal, K. B. Shah, G. R. Patel, “Comparative analysis of P&O and INC MPPT algorithm for PV system”, Proceedings of the International Conference on Electrical, Electronics, Signals, Communication and Optimization 2015.
[15] Bennis Ghita, Karim Mohammed, Lagrioui Ahmed, Zinelaabidine Nada, Skik Noureddine, Elbaraka Ayoub, “Optimization and Modeling of a given PV System has a Single Phase Load”, Journal of Theoretical and Applied Information Technology, Vol. 86. No. 1, pp. 112-119, 10 th April 2016.
5069 Computing and Communications, Vol. 57, Issue. 2, 2016.
[17] K. Muthukumar, T.S. Anandhi, “Real Time Implementation of Variable Step Size Based P&O MPPT for PV Systems Based on dSPACE”, International Journal of Power Electronics and Drive System (IJPEDS) Vol. 7, No. 3, pp. 909-918, September 2016.
[18] M. A. Abdourraziq, M. Ouassaid, M. Maaroufi, S. Abdourraziq, “Modified P&O MPPT technique for photovoltaic systems”, Proceedings of the International Conference on Renewable Energy Research and Applications 2013.
[19] Yongheng Yang, F. Blaabjerg, “A modified P&O MPPT algorithm for single-phase PV systems based on deadbeat control”, Proceedings of the 6th IET International Conference on Power Electronics, Machines and Drives 2012.
[20] John Macaulay and Zhongfu Zhou, “A Fuzzy Logical-Based Variable Step Size P&O MPPT Algorithm for Photovoltaic System”, Energies, Vol. 11, Issue. 6, pp. 1-15, 2018.
[21] O. Bel Hadj Brahim Kechiche, B. Barkaoui, M. Hamza, H. Sammouda, “Simulation and comparison of P&O and fuzzy logic MPPT techniques at different irradiation conditions”, Proceedings of the International Conference on Green Energy Conversion Systems 2017.
[22] Anas El Filali, El Mehdi Laadissi and Malika Zazi, “Modeling and Simulation of Photovoltaic System Employing Perturb And Observe MPPT Algorithm and Fuzzy Logic Control”, Journal of Theoretical and Applied Information Technology, Vol. 89. No. 2, pp. 470-475, 31st July 2016.