Selection of a Suitable Wavelet for Cognitive
Memory Using Electroencephalograph Signal
S. Z. Mohd Tumari, R. Sudirman, A. H. Ahmad
INFOCOMM Research Alliances, Faculty of Electrical Engineering, Universiti Teknologi Malaysia, Johor Bahru, Malaysia Email: [email protected]
Received 2013
ABSTRACT
The aim of this study is to recognize the best and suitable wavelet family for analyzing cognitive memory using Elec-troencephalograph (EEG) signal. The participant was given some visual stimuli during the study phase, which were a sequence of pictures that had to be remembered to acquire the EEG signal. The Neurofax EEG 9200 was used to record the acquisition of cognitive memory at channel Fz. The raw EEG signals were analyzed using Wavelet Transform. A lot of mother wavelets can be used for analyzing the signal, but do not lose any information on the wavelet, some predic-tions must be made beforehand. The criteria of the EEG signal were narrowed down to the Daubechies, Symlets and Coiflets, and it is the final selection depending on their Mean Square Error (MSE). The best solution would have the least difference between the original and constructed signal. Results indicated that the Daubechies wavelet at a level of decomposition of 4 (db4) was the most suitable wavelet for pre-processing the raw EEG signal of cognitive memory. To conclude, choosing the suitable wavelet family is more important than relying on the MSE value alone to successfully perform a wavelet transformation.
Keywords: EEG; Wavelet Families; MSE; Visual Stimuli; Daubechies
1. Introduction
Working memory and short term memory storage are always related to each other, but the former can actually improves the exploration of other complex cognitive tasks more than the latter. These relationships emphasize more on the common processing demands of working memory and complex cognitive tasks rather than storage issues. Recent researches [1] in working memory include making a distinction between what have been developed to be recognized as simple or complex spans. Complex span tasks are to-be-remembered things interleaved with several outlines of disturbing task, for example, solving mathematics question and reading sentences [2]. Simple span tasks, on the other hand, are related to the combina-tion of both unloading primary memory and secondary memory, such as words and letters [3]. In this study, more attention is given to complex span activities.
2. Wavelet Algorithm
Wavelet algorithm provides a way of representing a time frequency in a certain sized variable window. It also transforms the Electroencephalograph (EEG) characteris-tics to allow further extraction and classification because these signals are non-stationary [4]. The advantages of using wavelet transformation are different from Fourier
transformation because this type of transformation can capture the transient features in a given signal and pro-vide the corresponding time frequency information. In this study, the Discrete Wavelet Transform (DWT) was chosen to decompose the signal through the means of low-pass and high-pass filtering into two components, which are the low and high frequency proportion, respec-tively, of the signal [5]. In real life problem, DWT is more suitable in area of biomedical applications. DWT determination examines the signal at different frequency bands with different resolutions by decomposing the signal into Approximation coefficients (cA) and detailed information (cD). In short, this algorithm gives precise analysis of frequency domain at low frequency and time domain at high frequency [6].
2.1. Types of Wavelet Families
such signal. The wavelet chosen has to be as close as possible to the analyzed signal to give a better recon-struction with fewer decomposition levels.
An orthogonal signal is important because [7]:
1) It conserves the energy of the signal throughout the wavelet transform so that no information will be lost.
2) It allows wavelet transformation that can extract high and low frequency details.
The finite impulse response (FIR) filter gives compact support that is very useful for transient signal analysis (non- stationary signal) [7] because its wavelets are smoother and can enhance the illustration of transients in the signal. Besides that, such compact support also allows the wavelet transform to efficiently characterize the signals that contain the features’ information.
Wavelet families such as Haar, Daubechies, Symlets, and Coiflets have sufficient properties to analyze signal acquisition. The Haar wavelet, in particular, is comprised of a Daubechies order of 1 (db1). In this study, since the reconstruction criterion was evaluated using a coefficient number that had to be more than two, the Haar wavelet was excluded from the list. The Morlet and Mexican Hat wavelet families were not included as well because they could not fully reveal the characteristics essential for biomedical areas [8,9]. To find the appropriate wavelet family for the EEG signal, several calculations had to be performed and this will be discussed further.
2.2. Choice of Level Decomposition
[image:2.595.347.538.183.334.2]To perform the required decomposition, the output sig-nals having half the frequency’s bandwidth from the original signal have to be down-sampled by 2 using the Nyquist rule [10]. According to this rule, an original sig-nal has a highest frequency of ω, this requires a sampling frequency of 2ω before it can be down-sampled to ω/2
Table 1. Types of wavelet families [6].
No Wavelet Families Descriptions
1 Morlet (mor1) This wavelet has no scaling function but is explicit.
2 Mexican Hat (mexh)
This wavelet has no scaling function and is derived from a function that is proportional to the second derivative function of Gaussian.
3 Meyer (meyr) Scaling function is defined in the frequency domain.
4 Haar (haar) Discontinuous and resembles a step function. Haar represent as Daubechies db1.
5 Daubechies (dbN) One of the brightest stars in the world of wavelet research.
6 Symlets (symN) This wavelet is modification to the db family.
7 Coiflets (coifN) Built by I. Daubechies that has 2N moments.
8 Splines biothorgonal wavelets (biorNr.Nd)
This wavelet needed two wavelets for signal and image reconstruction.
[11]. Without losing any information, the down-sampling of a time domain signal can be divided into two - low and high filtering. Down-sampling occurs when the original signal, x(n), passes through a half band high-pass filter,
g(n), (detail coefficient) and then a low-pass filter, h(n) (approximation coefficient) [12]. A one level of decom-position can be mathematically expressed as in Equation (1), (2) and (3) [13].
(1)
(2)
(3)
where yhigh[k] and ylow[k] are the outputs of the high-pass and low-pass filters after being sub-sampled by 2.
[image:2.595.59.289.536.722.2]In accordance to the theory presented above, the sev-enth level wavelet decomposition was selected since the frequency sampling used in this study was 500kHz. In this representation, the coefficients A1, D1, A2, D2, A3, D3, A4, D4, A5, D5, A6, D6, A7, and D7 were the fre-quency content from the original signal within the bands. The extracted wavelet coefficients provided a compact representation of different frequency ranges, as shown in Figure 1 and Table 2. Figure 1 shows that, original sig-nal content the length of frequency is 500 and from 500 lengths it will down sampling by 2. Low frequency con-tents length from 0 to 250 as name as approximation co-efficient (A1) and high frequency (250 to 500) as a de-tailed coefficient (D1). Then, A1 (low frequency) will continue down sampling by 2 which are A2 (0 to 63) and D2 (63 to 250). The processes of down sampling resolve interchange until the original signals find all the fre-quency ranges. Table 2 shows that the frequency ranges perform after 7 levels of decompositions. Wavelet trans-form coefficients between two levels of details were de-creased by 1 [14]. In particular, D4, D5, D6, and D7 had 62, 30, 15, and 7 coefficients respectively.
2.3. Choice of Wavelet Families
Table 2. Decomposition of EEG Signal into Different Fre-quency Bands (Fs = 500 Hz).
Frequency Range (Hz) Decomposition Level Frequency Band
250 - 500 D1 Noise
125 - 250 D2 Noise
63 -125 D3 Noise
31 - 63 D4 Gamma
16 - 31 D5 Beta
8 - 16 D6 Alpha
4 - 8 D7 Theta
0 - 4 A7 Delta
[image:3.595.310.539.125.342.2](4)
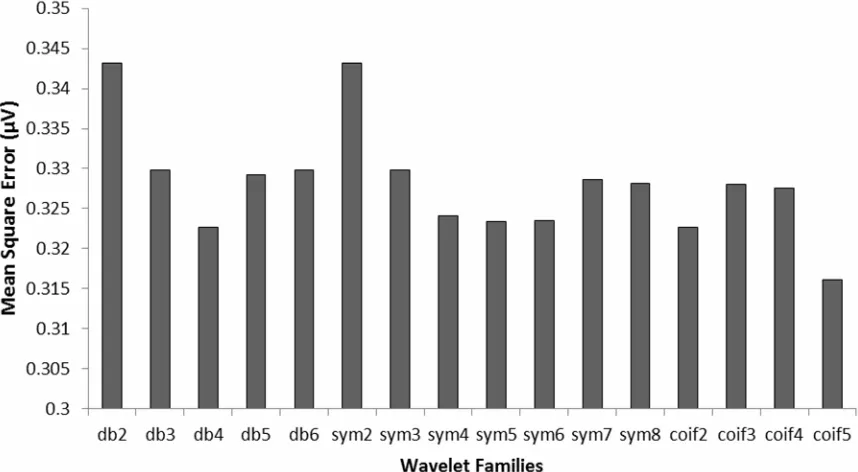
Figure 2 shows the comparison between wavelets in terms of mean square error. The results showed that db4 had a low MSE (0.32264 µV). Even though the MSE for
[image:3.595.306.540.126.339.2]coif5 (0.31606 µV) was lower, the difference between compressed and original signals were higher, so it was postulated that some information were missing. In a nut-shell, our results showed that the signals were within the Daubechies wavelet family, which means that the signals are regular orthogonal signals that have been compactly supported to give the smallest size.
Figure 1. Seventh Level Wavelet Decomposition with detail and approximation coefficients of signal.
[image:3.595.84.513.480.716.2]3. Methodology
3.1. Participant
Our preliminary study involved a child who was aca-demically the best in the class. This child loves to read, has no record of brain injury, is active in school, and is a prefect. The child was given some visual stimuli to in-vestigate the responses of the brain activity while re-membering the sequence of the pictures. The child was asked to relax for two minutes before the assessment started.
3.2. Assessment Tasks: Study Phase
At this stage, the child was asked to look through a few pictures shown on a computer’s screen. Figure 3 shows four sample pictures that were presented to the child. Every picture was displayed for 5 seconds and the whole sequence was repeated twice. After that, the examiner asked the child a few questions about the pictures and the child’s responses in this recognition test was recorded using the EEG machine.
4. Simulation
[image:4.595.307.540.147.413.2] [image:4.595.305.543.152.720.2]The raw EEG signals obtained from this study, unsur-prisingly, also contained artifacts or noises. These artifacts were then filtered off before further analysis. An important point to note is that EEG signals are frequently quantified based on their frequency domain characteristics. There-fore, in order to extract useful information from the EEG signals (mean, standard deviation and maximum value), Discrete Wavelet Transform had to be applied. This was to simplify and extract the information from different frequency bands (alpha, beta, delta, theta and gamma) by decomposing the signals into approximate coefficients and detailed information. The multi-resolution analysis was then performed with the Daubechies wavelet set at 4 (Db4) and the level of decomposition set at seven (cD7).
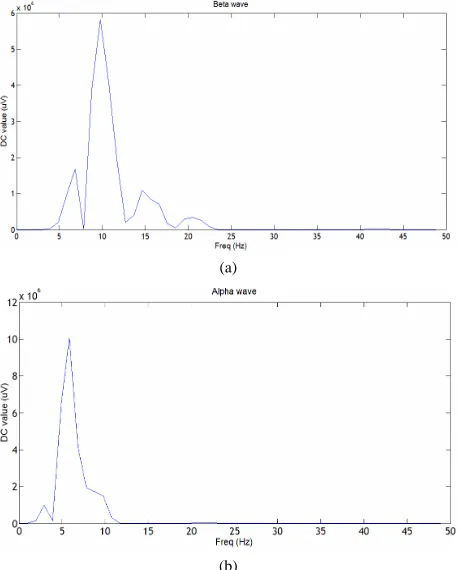
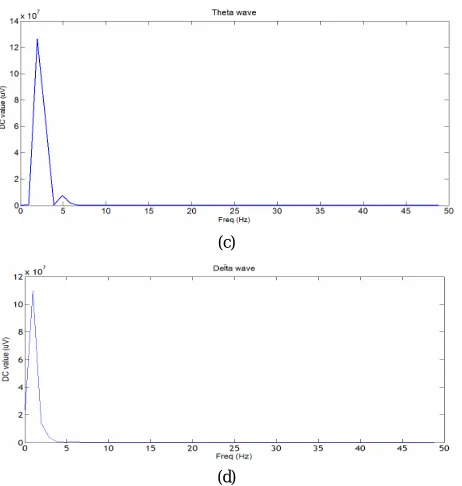
Figure 4 shows the information from sub-band 4 to 7 (gamma, beta, alpha, theta, delta) calculated for further analysis. The information was extracted during the as-sessment of the study phase. Then, based on the sub-band signal, the highest power spectrum distribution for each frequency determination was determined.
As shown in Figure 5 and summarized in Table 3, the Theta band (D7) had improved the child’s visual re-sponse and cognitive memory development. From the graph of channel Fz, the power spectrum density (PSD) at the theta band was the highest (127 V). This showed that the child, theoretically, was in a deep relaxation mood and was focusing on the task given.
5. Conclusion
Choosing the best wavelet is more crucial for a successful
[image:4.595.309.539.447.732.2]wavelet transform to avoid highly complex and lengthy level decomposition. This is even more important than relying on the value of MSE alone. In this study, our re-sults have shown that the db4 wavelet family is the best
Figure 3. Study phase.
Figure 4. Detail Coefficients of Sub-band 4 to 7 of EEG Signal at Channel Fz.
(a)
(c)
(d)
[image:5.595.59.290.81.324.2]Figure 5. (a) Beta (b) Alpha (c) Theta (d) Delta: Frequency Domain of EEG Signal for First Subject at Channel Fz.
Table 3. Description on parameter extraction of eeg signal for study phase: first subject.
Beta (D5)
Alpha (D6)
Theta (D7)
Delta (A7)
Mean 0.0289 0.3619 1.091 - 2.559
Standard Deviation 368.7 509.5 747.4 1183
Max Value 1703 2372 2054 2888
Median 146.3 320.5 438.3 856.9
PSD (µV) 5.82 0.101 0.013 0.011
Frequency (Hz) 9.77 5.86 1.95 0.98
for extracting the EEG signals into different frequency bands.
6. Acknowledgements
Our appreciation also goes to the Malaysia Ministry of Education, Johor Education Department, Zamalah Schol-arship and Universiti Teknologi Malaysia for permission, facilities and funding this project under QJ130000. 2623.09J28.
REFERENCES
[1] G. Neale and K. Tehan, “Age and Redintegration in Im-mediate Memory and Their Relationship to Task Diffi-culty,” Memory and Cognition, Vol. 8, No. 35, 2007, pp. 1940-1953.doi:10.3758/BF03192927
[2] N. Unsworth and R. W. Engle, “Simple and Complex Memory Spans and Their Relation to Fluid Abilities:
Evidence from List-Length Effects,” Journal of Memory
and Language, Vol. 54, No. 1, 2006, pp. 68-80.
doi:10.1016/j.jml.2005.06.003
[3] S. Lewandowsky, S. M. Geiger and D. B. Morrell, “Turning Simple Span into Complex Span: Time for De-cay or Interference from Distractors?” in Simple and
Complex Span, Australia , 2007, pp. 1-71.
[4] H. Adeli, Z. Zhou and N. Dadmehr, “Analysis of EEG Records in an Epileptic Patient using Wavelet Trans-form.,” Journal of Neuroscience Methods, Vol. 123, No. 1, 2003, pp. 69-87.doi:10.1016/S0165-0270(02)00340-0
[5] A. Roth, D. Roesch-Ely, S. Bender, M. Weisbrod and S. Kaiser, “Increased Event-Related Potential Latency and Amplitude Variability in Schizophrenia Detected Through Wavelet-based Single Trial Analysis,” Journal of the International Organization of Psychophysiology, Vol. 66, No. 3, 2007, pp. 244-254.
doi:10.1016/j.ijpsycho.2007.08.005
[6] J. M. Misiti, M. Misiti, Y. Oppenhum and G. Poggi, “Wavelet Toolbox: For Use With MATLAB,” 1st ed, The Mathworks, Incorporation, 1996, pp. 1-626.
[7] A. I. Megahed, A. Monem Moussa, H. B. Elrefaie and Y. M. Marghany, “Selection of a Suitable Mother Wavelet for Analyzing Power System Fault Transients,” 2008
IEEE Power and Energy Society General Meeting - Con-version and Delivery of Electrical Energy in the 21st Century, 2008, pp. 1-7.
[8] C. Bowman and A. C. Newell, “A Wavelet based Algo-rithm for Pattern Analysis,” Journal of Physica D, vol. 119, pp. 250-282, 1998.
doi:10.1016/S0167-2789(98)00039-6
[9] S. Lee, W.-S. Kang and K. Cho, “A Method of Mother Wavelet Function Learning for DWT -based Analysis us-ing EEG Signals 2,” IEEE, 2011, pp. 2-5.
[10] H. Ocak, “Automatic Detection of Epileptic Seizures in EEG using Discrete Wavelet Transform and Approximate Entropy,” Expert Systems with Applications, Vol. 36, No. 2, 2009, pp. 2027-2036.doi:10.1016/j.eswa.2007.12.065
[11] D. Sripathi, “CHAPTER 2: The Discrete Wavelet Trans-form,” 2003, pp. 6-15.
[12] M. O. Oliveira and A. S. Bretas, “Application of Discrete Wavelet Transform for Differential Protection of Power Transformers,” in Discrete Wavelet Transforms -
Bio-medical Applications, H. Oikkonen, Ed. Shanghai: In-Tech, 2008, pp. 349-367.
[13] R. Polikar, “The Story of Wavelets 1,” in Physics and
Modern Topics in Mechanical and Electrical Engineering, USA: Press, World Scientific and Eng, Society, 1999, pp. 192-197.
[14] A. C. Merzagora, S. Bunce, M. Izzetoglu and B. Onaral, “Wavelet Analysis for EEG Feature Extraction in Decep-tion DetecDecep-tion.,” IEEE Engineering in Medicine and
Bi-ology Society Conference, 2006, Vol. 1, pp. 2434-2437. [15] M. Antonini, “Mean Square Error Approximation for
[image:5.595.55.289.387.495.2]![Table 1. Types of wavelet families [6].](https://thumb-us.123doks.com/thumbv2/123dok_us/7806320.729610/2.595.347.538.183.334/table-types-of-wavelet-families.webp)