Nitrogen movement in coarse-textured soils and its
availability to maize (Zea mays L.) plant
John Mthandi1*, Fredrick C. Kahimba1, Andrew Tarimo1, Baanda A. Salim1, Maxon Lowole2
1
Department of Agricultural Engineering and Land Planning, Sokoine University of Agriculture, Morogoro, Tanzania; *
Corresponding Aut
2
Department of Crop Science, Bunda College of Agriculture, Lilongwe, Malawi
Received 25 May 2013; revised 25 June 2013; accepted 15 July 2013
Copyright © 2013 John Mthandi et al. This is an open access article distributed under the Creative Commons Attribution License, which permits unrestricted use, distribution, and reproduction in any medium, provided the original work is properly cited.
ABSTRACT
Nitrogen (N) is the most important determinant nutrient for plant growth and crop yield. Plants lacking N show stunted growth and yellowish leaves. Plant growth and crop yield usually in- crease when N is added. However, too much N leads to weak stems in grain crops (lodging) which result into low yield. The aim of the study was to delineate changes of N concentration, its direction of movement and its pattern of dispo- sition in the soil as influenced by amount of ap- plied water and nitrogen so as to reduce N losses and maximise its absorption by maize roots.The study was conducted during irrigation seasons of 2011 and 2012 at Nkango Irrigation Scheme, Malawi. The trials consisted of factorial arrangement in a Randomised Complete Block Design (RCBD). The factors were water and N and both were at four levels. The Triscan Sensor was used to measure total N concentration at different vertical and lateral points. The study inferred that changes of N concentration, its di- rection of movement and its pattern of disposi- tion in the soil are influenced by water flux and absorption rate of plants roots due to gradient created by absorption. The study noted that when N is in low supply, its movement towards maize roots is greatly influenced by diffusion. The study concluded that to maximise N absorp- tion by maize roots, the point of N application should be at 5 cm away from the planting station to minimise N losses through drifting away from the maize rooting zone.
Keywords:N Concentration; Water Flux;
Absorption Rate; Diffusion
1. INTRODUCTION
General
Nitrogen (N) is the most important determinant nutri- ent for plant growth and crop yield. [1] reported that N is the most limiting nutrient to crop production in most cases. Plants lacking N show stunted growth and yellow- ish leaves. Plant growth and crop yield usually increase when N is added. However, too much N leads to weak stems in grain crops (lodging), reduces quality in fruit such as peaches and apples, lowers sugar content in su- gar beets, and leads to an accumulation of nitrate in edi- ble foliage of plants. [2,3] reported that excessive N sup- ply in the soil stimulated excess pepper vegetative grow- th, which was detrimental to reproductive growth and re- sulted in a decrease in fruit yield. Identifying the most economic rate of N fertilizer is very important in high N demanding crops such as maize, to maximize profitabil- ity and reduce N losses to the environment [4]. However, determining how much N fertilizer is required by a maize crop is an imperfect science at its best [5]. This is be- cause as reported by [6] economic N fertilizer rate is variable and depends on many factors such as climatic conditions and crop management. The behaviour of N in the soil system is complex, yet an understanding of the basic N processes, is essential for a more efficient N management program [7]. Major N processes in the soil are: mineralization, immobilization, denitrification and nitrification, and leaching. The most efficient way is to understand processes that contribute to N losses in soil and how can mineralization and nitrification be har- nessed to improve N content in the soil.
pared to nitrate because of its adsorption in the Cation Exchange Capacity. However, losses of ammonium ni- trogen through leaching occur in coarse-textured soil with a low Exchange Capacity [9]. Leaching is major N loss mechanism in coarse textured soil. Therefore, proper understanding of N movement in coarse-textured soils can reduce N losses through leaching in the soil. This study aims at delineating vertical movement and disposi- tion pattern of nitrogen in the soil as influenced by amount of applied water and nitrogen. This understand- ing will ensure that applied water is maximising the dis- position of nitrogen within the rooting zone of the plants to facilitate its uptake and reduce losses. This study is further necessitated with the knowledge that 75% of ce- reals’ roots are concentrated in the upper soil layers of within 20 - 35 cm [10].
2. MATERIALS AND METHODS
2.1. Site Description
The research study was done at Nkango Irrigation Scheme in Kasungu district. Data were taken in three irrigation growing seasons of 26th September to 18th December, 2011; 1st June to 8th September, 2012; and 10st September to 5th December, 2012. Nkango Irrigation Scheme is an informal scheme which is owned and managed by the local communities and is situated at Latitude 12˚35' South and Longitudes 33˚31' East and is at 1186 m above sea level. The study area has a unimodal type of rainfall with rains between December and April. The mean annual rainfall is about 800 mm. The site lies within maize production zone of Malawi and has domi- nant soil type of coarse sandy loam. Smallholder farmers in the area practise irrigation and are conversant with water application regimes.
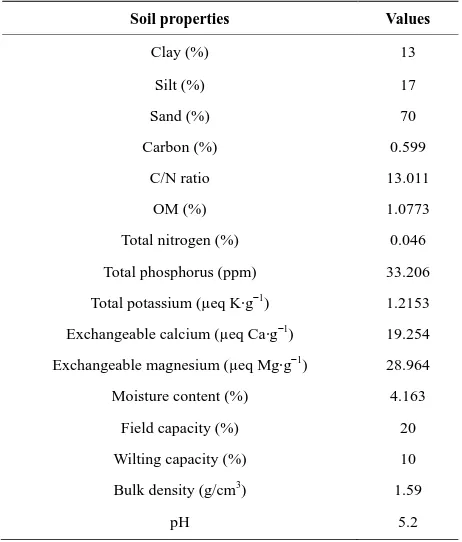
The soil of the plots is sandy loam with a low soil or- ganic matter and nutrient concentration as described in (Table 1). The Cation Exchange Capacity is low (50.00 - 80.00 µeq·g−1), and the pH decreased from acidic (5.2) to strongly acidic (4.7). The salinity of the soil was very low (1.7 mmhos/cm).
2.2. Experiemental Design
The plot size was 5 m by 5 m and ridges were spaced at 75 cm. The plots were separated from one another by a 2-metre boundary to avoid ‘sharing’ of responses, water and nitrogen (edge effects). Three maize seeds of hybrid maize (SC 407) were planted per hole at spacing of 25 cm. They were later on thinned to one seed per station 7 days after germination.
The trials consisted of factorial arrangement in a Randomised Complete Block Design (RCBD). The factors were water and nitrogen and both were at four levels. Water had four application regimes and these
Tab le 1. Characteristics of soil at the research site.
Soil properties Values
Clay (%) 13
Silt (%) 17
Sand (%) 70
Carbon (%) 0.599
C/N ratio 13.011
OM (%) 1.0773
Total nitrogen (%) 0.046
Total phosphorus (ppm) 33.206
Total potassium (µeq K∙g−1) 1.2153
Exchangeable calcium (µeq Ca∙g−1) 19.254
Exchangeable magnesium (µeq Mg∙g−1) 28.964
Moisture content (%) 4.163
Field capacity (%) 20
Wilting capacity (%) 10
Bulk density (g/cm3) 1.59
pH 5.2
were as follows: farmers’ practice regime; full (100%) water requirement regime (FWRR) of maize plant; 60% of FWRR; and 40% of FWRR. A full maize water re- quirement was determined by using the procedure des- cribed in FAO Paper 56 [11]. Nitrogen had four appli- cation regimes and these were as follows: The Typical Nitrogen Application Rate in the area (TNPRA) of 92 kg N/ha was used as a basis to determine other dosage levels in the study [12]. The nitrogen dosage levels were as follows: TNPRA, 92 kg N/ha; 125% of TNPRA, 115 kg N/ha; 75% of TNPRA, 69 kg N/ha; and 50% of TNPRA, 46 kg N/ha.
The fertlizer was applied two times, basal and top dressings, 21 and 51 days after planting respectively. At each application time, the following methods were used to achieve the nitrogen dosage levels [12]:
To acheive 50% of TNPRA, 46 kg N/ha, 2.8 g ferti- lizer scooped using one coke bottle top with inside lining was applied per station.
To achieve 75% of TNPRA, 69 kg N/ha, 4.2 g fertil- izer scooped using one coke bottle top without inside lining was applied on each station.
To achieve TNPRA, 92 kg N/ha: apply 5.6 g fertilizer that is 2 coke bottle tops per station without inside lining.
To achieve 125% of TNPRA, 115 kg N/ha: apply 8.4 g fertilizer using 3 coke bottle tops without inside lining.
2.3. Data Collection
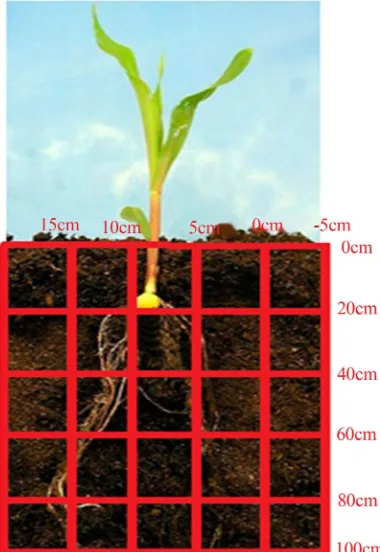
[image:2.595.308.539.101.372.2]Stepney, Australia), which has ability to monitor the direction and movement of nitrogen in the soil at the instant time of inserting the monitoring probe in the soil, was used to measure total nitrogen concentration at lat- eral distances. The measurement of the sensor is in Vo-lumetric Ion Concentration (VIC), but using scandali- zation equation the concentration of total nitrogen on each point was known. The lateral distances at which measurements were taken were as follows: at point of application (represented by 0 cm), at 5cm away from the plant (represented by −5 cm), at 5 cm towards the plant, 10 cm towards the plant (this point was maize planting station), and 15 cm (this point was 5 cm after planting station in the direction opposite from where N was ap- plied) as shown in Figure 1. The lateral distances were taken based on spreading and elongation pattern of lat- eral roots of maize plants. The lateral reading of nitrogen was respectively taken at five soil depths of 20, 40, 60, 80 and 100 cm. The soil depths were selected based on maize roots growth habits which extend down to 100 cm [13]. Confirmation of data was done through analyzing soil samples collected from the respective points. The soil profile was dug to a depth of 120 cm and horizon- tally using soil auger, soil samples were collected from the lateral points for laboratory analysis.
2.4. Data Analysis
The data presented in this paper were from treatments
Figure 1. Showing measurement points.
combination 60% of FWRR and 92 NKg/Ha because statistically the plots gave optimum yields compared to other plots. The GENSTAT software (VSNi, Hemel Hempstead, UK) was used for statistical analysis. The data are presented in graphical form to indicate compara- tive change of N concentration and direction of flow which was the main purpose of this study.
[image:3.595.76.266.440.716.2] [image:3.595.311.535.512.719.2]3. RESULTS AND DISCUSSION
Figure 2 presents the distribution of N concentration for different lateral distances of measurements. At 20 cm deep, the N concentration is highest at the point of N application (0 cm) followed by concentration at lateral distance of 5 cm towards the maize roots. It was ob- served that despite having the same lateral distance of 5 cm from the point of N application, N concentration was higher towards the maize roots than away from the maize roots. The N concentration at lateral distance of 10 cm from point of N application was lower than the proceed- ing distances of 5 cm, 0 cm and −5 cm. The N concentra- tion was the lowest at 15 cm. The behaviour of N at 20 cm deep suggests that the pulling effect by maize roots was influencing movement direction of nitrogen. At lat- eral distance of 10 cm, this is where maize seeds were planted and low N concentration suggests that at this point N was absorbed by the maize roots as maize roots will absorb nitrogen next to it. On 10th July, maize plants were 6 weeks old and during this period maize root sys- tem develop very rapidly and absorption of nitrogen is thus increased.
The N concentration decreased with depth i.e. concen- trations were high at 20 cm deep expect at lateral dis- tance of 15 cm and gradually decreased down to 100 cm. Considering lateral redistribution at particular depths, the
0.00 0.05 0.10 0.15 0.20 0.25 0.30
0 20 40 60 80 100 120
To
ta
l N
(%
)
Soil Depth (cm)
10 July N Vertical Distribution
15cm 10cm 5cm
0cm -5cm
N concentration suddenly decreased from 20 cm to 40 cm for the 10 cm line. This can be due to differences in soil porosity of the layer above 40 cm and below. The soils on planting stations were prepared to ensure that plant seed germination is not restricted but this prepara- tion increased soil pores such that movement of water and air was increased. However, beneath this “disturbed” layer, soil pores were small and as reported by [14] small pores in compacted soil layer may slow water percola- tion so that the overlying soil becomes waterlogged and poorly aerated which may facilitate rapid N loss through denitrification. The rapid decrease of total nitrogen con- centration on all measured points from the depth of 40 cm to 60 cm may be due to denitrification of nitrogen to gas. Excessive irrigation promotes nitrogen loss not only by promoting nitrate leaching from the plant root zone, but also by creating wet soil conditions that favour deni- trification.
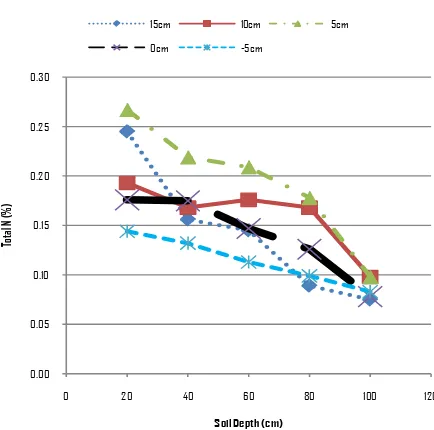
Figure 3 shows that at 20 cm deep the N concentration was highest at lateral distance of 5 cm (toward the maize roots), followed by concentration at 5 cm (away from the roots). The N concentration at the point of N application is lower than the two neighbouring measure points of 5 cm. The N concentration at lateral distance of 10 cm is again lower than the three preceding points while at 15 cm the concentration is the lowest. The trend of N move- ment direction indicates that N is moving towards the maize roots and at 10 cm, the maize roots is absorbing N hence low concentration.
The behaviour of N at the depth of 40 cm shows that N concentration is highest at 10 cm, while N concentra- tions at other measured points have rapidly decreased for example at 5 cm towards the plant roots, the concentra- tion changed from 0.2 at 20 cm deep to 0.09 at 40 cm deep. The trend of N decline suggests that plant uptake
0.00 0.05 0.10 0.15 0.20 0.25 0.30
0 20 40 60 80 100 120
To
ta
l N
(%)
Soil Depth (cm)
20 July N Vertical Distribution
15cm 10cm 5cm 0cm -5cm
Figure 3. N distribution on 20th July, 2012.
during this period was very high. The date of measure- ment of 20th July was Maize’s 50’sday after planting and [5] reported that maize enters in its rapid nutrient accu- mulation phase four to eight weeks. When N demand is high, the plant creates a negative gradient and nitrogen is attracted from the neighbouring areas to regions next to maize roots through diffusion process. [15] reported that if N concentration at the root surface is different from that in the bulk soil solution, nitrogen will move by dif- fusion from the zone of higher to lower concentration. As soil water content decreases, not only does the energy status of water change, but also hydraulic conductivity decreases logarithmically, restricting soil water flow to the root. The quantity of nutrient flowing with the water will also decline. However, when mass flow does not meet the plant’s nutrient demand, i.e., the amount ar- riveing at the root system is less than that required by the plant, the nutrient concentration in the rhizosphere is reduced relative to the soil solution outside the rhizo- sphere—a nutrient gradient develops. A plant experienc- ing a nutrient deficiency must have diffusive flow sup- plying a portion of that nutrient [16].
On 30 July, about 60 days after planting maize, the Figure 4 shows that at 20 cm deep the N concentration was highest at 5 cm (towards the maize roots) followed by concentration at 15 cm and then followed by concen- tration at 10 cm but on all five points the figures shows that N concentrations were generally higher than those measured on 20th July. The top dressing of Urea was done on 21st July which increased N concentrations. The N concentration at 15 cm appears to be increasing and this might be due to native nitrogen and applied mineral nitrogen that might have moved to this point due to water
0.00 0.05 0.10 0.15 0.20 0.25 0.30
0 20 40 60 80 100 120
To
tal N
(%)
Soil Depth (cm)
30 July N Vertical Distribution
15cm 10cm 5cm
[image:4.595.59.284.515.719.2]0cm -5cm
flux.
The N concentrations declined at 40 cm suggesting that absorption of nitrogen is very active. The transpira- tion of maize plant during this period (two months after planting) was very high because this period leaf surface area has increased and the roots have fully developed thereby increasing absorption of nitrogen. However, dur- ing the same period as indicated by Figure 5, the need of nitrogen by maize plants has also increased. Nitrogen supplied by water flux alone is not meeting demand of maize plant hence diffusion movement has come in to meet the demand. [17] reported that roots normally main- tain a capability to acquire N at a faster rate than can be supplied by the physical transport delivery, through main- taining low internal concentrations and active ion pumps.
The effect of diffusion has increased nitrogen concen- tration at lateral distance of 10 cm at 40 cm and 60 cm deep. The N concentrations on other points are lower than at 10 cm because nitrogen has been mobilised from these regions. The general trend of N concentrations ap- pears to be increasing downwards points suggesting that down movement of water due to gravitational force is influencing down movement of N concentrations from 20 cm deep to 40 cm, 60 cm and 80 cm deep.
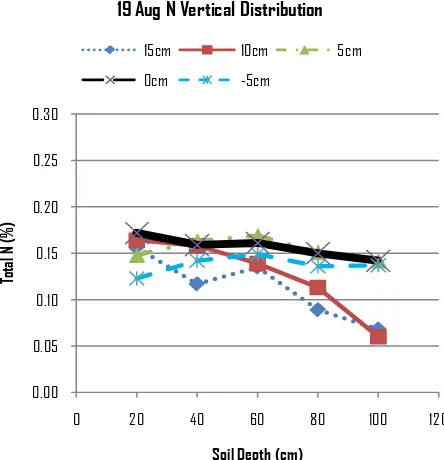
On 19th August, the Figure 6 shows that N concentra- tion on all points appears are more less the same, for example the line at 0 cm, 5 cm and −5 cm appears to be relatively flat. However, if compared with N concentra- tions measured on 9th August, it shows that at 40 cm deep the N concentration at 0 cm has decreased from 0.19 to 0.16, at 60 cm deep the N concentration at 0 cm has de- creased from 0.16 to 0.15, at 80 cm deep the N concen- tration at 0 cm has decreased from 0.18 to 0.14, while at 100 cm deep the N concentration at 0 cm has increased from 0.10 to 0.14. The trend suggests that there has been leaching where nitrogen has moved from top layers to underlying layers and beyond.
[image:5.595.312.534.86.316.2]Figures 7 and 8 show that N concentrations at all
Figure 5. N distribution on 9th August, 2012.
0.00 0.05 0.10 0.15 0.20 0.25 0.30
0 20 40 60 80 100 120
To
ta
l N
(%
)
Soil Depth (cm)
19 Aug N Vertical Distribution
15cm 10cm 5cm
0cm -5cm
[image:5.595.63.279.543.722.2]Figure 6. N distribution on 19th August, 2012.
Figure 7. N distribution on 29th August, 2012.
[image:5.595.311.535.547.721.2]points are almost uniform there are minimum differences of concentration at all points. However, the N concentra- tions from top layers of 20 cm, 40 cm and 60 cm have further declined while at lower layers of 80 cm and 100 cm. while this may be attributed to be mining of nitrogen by maize plants in the top layers, the increase of N con- centrations at lower layers may be due leaching that have moved nitrogen from top to down layers.
4. CONCLUSIONS
In this study, we infer that vertical movement of ni- trogen is influenced by water flux and direction of flow is greatly influenced by absorption rate of plants roots-due to gradient created by absorption. When supply of nitrogen is low due to high absorption of plants roots especially during the period when plants require large quantities of nitrogen, the lateral movement of nitrogen towards plant roots is greatly influenced by diffusion.
To maximise N absorption N should be applied at 5 cm away from the planting station. This will ensure that more N moves towards the maize roots due to hydraulic gradient created by the roots. But even if the N moves away from the plants roots, at 5 cm the N will still be within maize roots active zone so the chances of it being used by maize roots are very high.
5. ACKNOWLEDGEMENTS
The authors acknowledge the financial support from Alliance of Green Revolution in Africa (AGRA) and Troppenwasser Consulting Professionals (TCP).
REFERENCES
[1] Zhang, Q.T., Liu, K., Tan, S.C., Hong, P. J. and Warner, J. (2010) Evaluation of agronomic and economic effects of nitrogen and phosphorus additions to green pepper with drip fertigation. Agronomy Journal, 102, 1434-1440.
[2] Aliyu, L. (2000) Effects of organic and mineral fertilizers on growth, yield and composition of Pepper (capsicum annuum). Biological Agriculture and Horticulture, 18,
29-36
[3] Qawasmi, W., Mohammed, J.M., Najim, H. and Qubursi, R. (1999) Response to bell pepper grown inside plastic houses to nitrogen fertigation. Communications in Soil Science and Plant Analysis, 30, 2499-2509.
[4] Nyiraneza, J., N’Dayegamiye, A., Gasser, O.M., Giroux, M., Grenier, M., Landry, C. and Guertin, S. (2010) Soil and crop parameters related to corn nitrogen response in eastern Canada. Agronomy Journal, 102, 1478-1490.
[5] Holland, H.K. and Schepers, S.J. (2010) Derivation of a variable rate nitrogen application model for in-season fer- tilization of corn. Agronomy Journal, 102, 1415-1427.
[6] Al-Kaisi, M. and Kwaw-Mensah, D. (2007) Effect of tillage and nitrogen rate on corn yield and nitrogen and phosphorus uptake in a corn-soybean rotation. Agronomy
Journal, 99, 1548-1558.
[7] O’Leary, M., Rehm, G. and Schmitt, M. (2002) Under- standing nitrogen in soils.
[8] Iqbal, M.T. (2011) Nitrogen leaching from paddy field under different fertilization rates. Malaysian Journal of Soil Science, 15, 101-114.
[9] Schepers, J.S., Moravek, M.G. and Bishop, R. (1991) Im- pact of nitrogen and water management on ground water quality. In: Ritter, W.F., Ed., Irrigation and Drainage, American Society of Civil Engineers, New York, 641- 647.
[10] FOASTAT (2000) Maize.
[11] Allen, G.R., Pereira, S.L., Raes, D. and Smith, M. (1998) Crop evapotranspiration (guidelines for computing crop water requirements). FAO Irrigation and Drainage Paper No. 56, FAO—Food and Agriculture Organization of the United Nations, Rome.
[12] Ministry of Agriculture and Food Security (2011) Annual reports and notes. Lilongwe, Malawi.
[13] Gardenas, A., Hopmans, J.W., Hanson, B.R. and Simu- nek, J. (2005) Two-dimensional modeling of nitrate leach- ing for various fertigation scenarios under micro-irriga- tion. Agric. Water Manage, 74, 219-242.
[14] Brady, C.N. and Weil, R.R. (2008) The nature and prop- erties of soils. 14thEdition, Pearson Education, Inc., Up- per Saddle River.
[15] Comerford, B.N. (2005) Soil factors affecting nutrient bioavailability. In: Rad, H.B., Ed., Ecological Studies, Nutrient Acquisition by Plants. An Ecological Perspec- tive, Springer-Verlag, Berlin, Heidelberg 2005.
[16] Ourry, A., Gordon, A.J. and Macduff, J.H. (1997) Nitro- gen uptake and assimilation in roots and root modules. In: Foyer, C.H. and Quick, W.P., Eds., A Molecular Approach to Primary Metabolism in Higher Plants, Taylor and Francis, London, 237-254.
[17] Dickinson, E.R., Berry A.J., Bonan, G.B., Collatz, G,J., Field, B.C., Fung, I.Y., Goulden, M., Hoffmann, A.W., Jackson, B.R., Myneni, R., Sellers, J.P. and Shaikh, M. (2002) Nitrogen controls on climate model evapotran- spiration. American Meteorological Society. Journal of Climate, 15, 101-114.