Unipath and Multipath Reactive Routing
Protocol in MANET with Fixed Pause Time
and Varying Speed
Vandana Verma1, Prof. Shivendu Dubey2
Research Scholar, Department of Computer Science Engineering, Gyan Ganga Institute of Technology and Science,
Jabalpur [M.P] India1
Assistant Professor, Department of Computer Science Engineering, Gyan Ganga Institute of Technology and Science,
Jabalpur [M.P] India2
ABSTRACT: A Mobile Ad hoc Networks (MANET) represents a system of wireless mobile nodes that can freely and dynamically self-organize in to arbitrary and temporary network topologies, allowing people and devices to seamlessly communicate without any pre- existing communication architecture. One important aspect of mobile ad-hoc networks is the mobility of nodes in topological area, since any node can enter or leave the topological area at any time. This work is an attempt to create different speed mobility of nodes model and evaluate CBR traffic using a unipath reactive routing protocol, AODV, and a multipath reactive routing protocol, AOMDV. The Packet Delivery Ratio, Average End to End delay, Average Throughput, Normalized Routing Load and number of Drop packets in CBR traffic model with different mobility speed are measured using network simulator NS 2.35.
KEYWORDS: MANET, AODV, AOMDV, PDR, NRL, End-to-End Delay.
I. INTRODUCTION
Routing is a core problem in networks for sending data from one node to another. Wireless Ad Hoc networks are also called Mobile Ad Hoc multi-hop wireless networks is a collection of wireless mobile hosts forming a temporary network without the aid of any established infrastructure or centralized administration [1]. Mobile Ad Hoc Networks (MANETs) are characterized by a dynamic, multi-hop,rapid changing topology. Such networks are aimed to provide communication capabilities to areas where limited or no communication infrastructures exist.
MANET’s can also be deployed to allow the communication devices to form a dynamic and temporary network among them. A mobile Ad Hoc network (MANET) is receiving attention due to many potential military and civilian applications. MANETs have several salient characteristics [2]: 1) Dynamic topologies 2) Bandwidth-constrained links 3) Energy constrained operation 4) limited physical security. Therefore the routing protocols for wired networks cannot be directly used for wireless networks. Some of the possible uses of ad hoc networking include students using laptop computers to participate in an interactive lecture, business associates sharing information during a meeting, soldiers relaying information for situational awareness on the battlefield and emergency disaster relief personnel coordinating efforts after a hurricane or earthquake.
directly communicate to those nodes that are in radio range of each other, whereas others nodes need the help of intermediate nodes to route their packets. These networks are fully distributed, and can work at any place without the aid of any infrastructure. This property makes these networks highly robust.
II. DESCRIPTION OF MANET ROUTING PROTOCOLS
Description of routing protocols AODV and AOMDV in brief are as follows:
2.1. AODV (Ad-hoc On demand Distance Vector)
AODV[5][6] is a unipath reactive protocol, which performs Route Discovery using control messages route request (RREQ) and route reply (RREP) whenever a node wishes to send packets to destination. To control network wide broadcasts of RREQs, the source node uses an expanding ring search technique. The forward path sets up an intermediate node in its route table with a lifetime association RREP. When either destination or intermediate node using moves, a route error (RERR) is sent to the affected source node. When source node receives the (RERR), it can reinitiate route if the route is still needed. Neighborhood information is obtained from broadcast Hello packet. As AODV protocol is a flat routing protocol it does not need any central administrative system to handle the routing process. AODV tends to reduce the control traffic messages overhead at the cost of increased latency in finding new routes. The AODV has great advantage in having less overhead over simple protocols which need to keep the entire route from the source host to the destination host in their messages. The RREQ and RREP messages, which are responsible for the route discovery, do not increase significantly the overhead from these control messages. AODV reacts relatively quickly to the topological changes in the network and updating only the hosts that may be affected by the change, using the RRER message. The Hello messages, which are responsible for the route maintenance, are also limited so that they do not create unnecessary overhead in the network. The AODV protocol is a loop free and avoids the counting to infinity problem, which were typical to the classical distance vector routing protocols, by the usage of the sequence numbers [5].
2.2. AOMDV (Ad-hoc On demand Multipath Distance Vector)
AOMDV[7] is a multipath reactive protocol, uses the basic AODV route construction process. In this case, however, some extensions are made to create multiple loop-free, link-disjoint paths. The main idea in AOMDV is to compute multiple paths during route discovery. It consists of two components:
1. A route update rule to establish and maintain multiple loop-free paths at each node.
2. A distributed protocol to find link-disjoint paths.
In AOMDV each RREQ, respectively RREP arriving at a node potentially defines an alternate path to the source or destination. Just accepting all such copies will lead to the formation of routing loops. In order to eliminate any possibility of loops, the “advertised hopcount” is introduced. The advertised hopcount of a node i for a destination d
represents the maximum hopcount of the multiple paths for d available at i.
The protocol only accepts alternate routes with hopcount lower than the advertised hopcount, alternate routes with higher or the same hopcount are discarded. The advertised hopcount mechanism establishes multiple loop-free paths at every node.
III. PERFORMANCE METRICS
The following metrics are applied for protocol performance measurement. MANET working group for routing protocol suggested these metrics for evaluation [8]. The parameters considered are important in terms of measuring the performance of any routing protocol.
Average Throughput: The sum of the data packets generated by every source counted by k bit/s.
Packet Delivery Ratio: The ratio between the number of data packets originated by the "application layer" CBR sources and the number of data packets received by the CBR sink at the final destination [8].
Average End to End Delay: This includes all possible delays caused by buffering during routing discovery latency, queuing at the interface queue and retransmission delays at the MAC, propagation and transfer times.
Normalized Routing Load: The sum of the routing control messages such as RREQ, RREP, RRER, HELLO etc, counted by k bit/s.
IV. SIMULATION AND RESULT
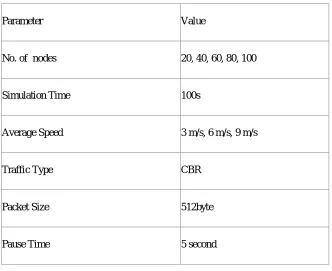
The network contains 20, 40, 60, 80 and 100 nodes randomly distributed in a 1500 m X 1000 m area, with speed of 3 m/s, 6 m/s and 9 m/s as basic scenario. The simulation time is 100s. The simulation is performed under Network Simulator NS 2.35.
Parameter Value
No. of nodes 20, 40, 60, 80, 100
Simulation Time 100s
Average Speed 3 m/s, 6 m/s, 9 m/s
Traffic Type CBR
Packet Size 512byte
Pause Time 5 second
Table 6.1: Basic Simulation Scenarios
The performance of unipath reactive routing protocol, AODV and multipath reactive routing protocol AOMDV with CBR traffic is measured over different mobility speed in an area of 1500m x 1000m. The results, which obtain are as follows:
Figure 6.1: Average Throughput Vs Number of Nodes with mobility speed of 3 m/s
Figure 6.2: Average Throughput Vs Number of Nodes with mobility speed of 6 m/s
20 40 60 80 100
AODV 26.46 47.87 51.88 66.65 76.73
AOMDV 25.83 43.98 50.84 62.22 76.7
0 10 20 30 40 50 60 70 80 90
A
ve
ra
ge
T
h
ro
u
gh
p
u
t [
in
kb
p
s]
Number of Nodes
Average Throughput Vs Number of Nodes with mobility speed 3 m/s
AODV
AOMDV
20 40 60 80 100
AODV 22.04 47.09 49.19 67.09 76.48
AOMDV 19.06 41.73 43.56 62.3 69.36
0 10 20 30 40 50 60 70 80 90
A
ve
ra
ge
T
h
ro
u
gh
p
u
t [
in
kb
p
s]
Number of Nodes
Average Throughput Vs Number of Nodes with mobility speed 6 m/s
AODV
Figure 6.3: Average Throughput Vs Number of Nodes with mobility speed of 9 m/s
Figure 6.1, figure 6.2 and figure 6.3 shows that the Average throughput of AODV is more than AOMDV with mobility speed of 3 m/s and 6 m/s with increasing number of nodes, while AOMDV perform well over the AODV with mobility speed of 9 m/s with increasing number of nodes. In all cases with mobility speed, both AODV and AOMDV show better performance with increasing number of nodes, in terms of Average Throughput.
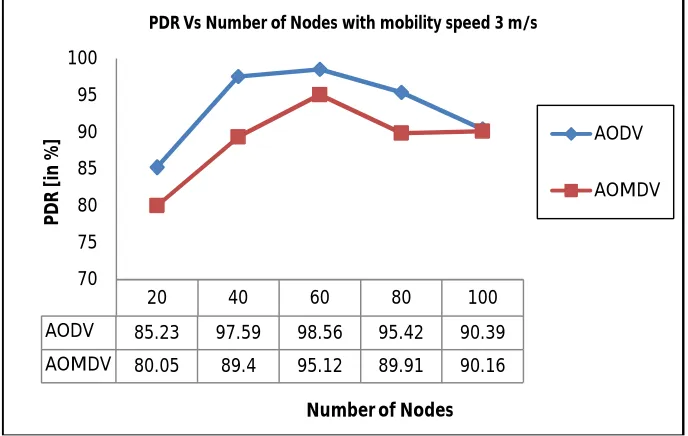
The Packet Delivery Ratio in CBR traffic for AODV and AOMDV with mobility speed of 3 m/s, 6 m/s and 9 m/s is shown in figure 6.4, figure 6.5 and figure 6.6.
Figure 6.4: Packet Delivery Ratio Vs Number of Nodes with mobility speed of 3 m/s
20 40 60 80 100
AODV 23.98 45.91 49.71 65.67 60.47
AOMDV 31.83 38.31 42.93 52.22 71.72
0 10 20 30 40 50 60 70 80
A
ve
ra
ge
T
h
ro
u
gh
p
u
t [
in
kb
p
s]
Number of Nodes
Average Throughput Vs Number of Nodes with mobility speed 9 m/s
AODV
AOMDV
20 40 60 80 100
AODV 85.23 97.59 98.56 95.42 90.39
AOMDV 80.05 89.4 95.12 89.91 90.16
70 75 80 85 90 95 100
P
D
R
[
in
%
]
Number of Nodes
PDR Vs Number of Nodes with mobility speed 3 m/s
AODV
Figure 6.5: Packet Delivery Ratio Vs Number of Nodes with mobility speed of 6 m/s
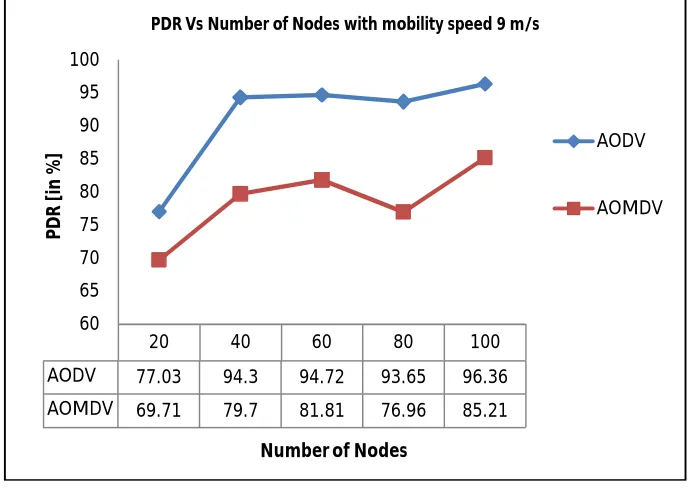
Figure 6.6: Packet Delivery Ratio Vs Number of Nodes with mobility speed of 9 m/s
Figure 6.4, figure 6.5 and figure 6.6 shows that the Packet Delivery Ratio of AODV is better than AOMDV with mobility speed of 3 m/s, 6 m/s and 9 m/s with increasing number of nodes. Both the protocols shows increasing PDR from 20 nodes to 60 nodes with all three mobility speed, but decreasing PDR from 60 nodes to 100 nodes with mobility speed of 3 m/s and 6 m/s, where as slightly increasing PDR from 60 nodes to 100 nodes with mobility speed of 9 m/s.
20 40 60 80 100
AODV 69.4 96.8 94.51 96.14 90.39
AOMDV 59.95 86.19 83.07 90.55 81.28
50 55 60 65 70 75 80 85 90 95 100
P
D
R
[
in
%
]
Number of Nodes
PDR Vs Number of Nodes with mobility speed 6 m/s
AODV
AOMDV
20 40 60 80 100
AODV 77.03 94.3 94.72 93.65 96.36
AOMDV 69.71 79.7 81.81 76.96 85.21
60 65 70 75 80 85 90 95 100
P
D
R
[
in
%
]
Number of Nodes
PDR Vs Number of Nodes with mobility speed 9 m/s
AODV
In all cases with mobility speed, both AODV and AOMDV show better performance from less to higher number of nodes, in terms of Packet Delivery Ratio.
The Average End-to-End Delay in CBR traffic for AODV and AOMDV with mobility speed of 3 m/s, 6 m/s and 9 m/s is shown in figure 6.7, figure 6.8 and figure 6.9.
Figure 6.7: Average End-to-End Delay Vs Number of Nodes with mobility speed of 3 m/s
Figure 6.8: Average End-to-End Delay Vs Number of Nodes with mobility speed of 6 m/s
20 40 60 80 100
AODV 86.12 34.29 36.45 113.14 206.64
AOMDV 15.79 31.69 30.01 47.71 49.88
0 50 100 150 200 250
A
ve
ra
ge
E
n
d
-t
o
-E
n
d
D
e
la
y
[i
n
m
s]
Number of Nodes
Average E2E Delay Vs Number of Nodes with mobility speed 3 m/s
AODV
AOMDV
20 40 60 80 100
AODV 107.12 45.72 111.32 72.38 198.13
AOMDV 48.58 38.52 24.37 33.37 53.37
0 50 100 150 200 250
A
ve
ra
ge
E
n
d
-t
o
-E
n
d
D
e
la
y
[i
n
m
s]
Number of Nodes
Average E2E Delay Vs Number of Nodes with mobility speed 6 m/s
AODV
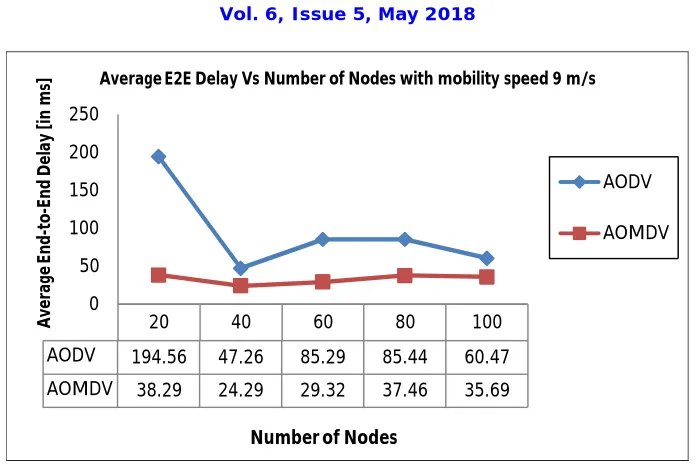
Figure 6.9: Average End-to-End Delay Vs Number of Nodes with mobility speed of 9 m/s
Figure 6.7, figure 6.8 and figure 6.9 shows that the AOMDV is better than AODV with mobility speed of 3 m/s, 6 m/s and 9 m/s with increasing number of nodes in terms of Average End-to-End Delay. In all three mobility speed the AOMDV shows slightly increment in Average End-to-End Delay with increasing number of nodes, while AODV shows rapid increment from 60 nodes to 100 nodes with mobility speed of 3 m/s and 6 m/s; and slight decrement from 60 nodes to 100 nodes with mobility speed of 9 m/s in terms of Average End-to-End Delay.
Number of Drop Packets in CBR traffic for AODV and AOMDV with mobility speed of 3 m/s, 6 m/s and 9 m/s is shown in figure 6.10, figure 6.11 and figure 6.12.
Figure 6.10: Number of Drop Packets Vs Number of Nodes with mobility speed of 3 m/s
20 40 60 80 100
AODV 194.56 47.26 85.29 85.44 60.47
AOMDV 38.29 24.29 29.32 37.46 35.69
0 50 100 150 200 250
Ave
ra
ge
E
n
d
-t
o
-E
n
d
D
e
la
y
[i
n
m
s]
Number of Nodes
Average E2E Delay Vs Number of Nodes with mobility speed 9 m/s
AODV
AOMDV
20 40 60 80 100
AODV 268 2391 5839 29434 99041
AOMDV 464 2821 7257 22057 45011
0 20000 40000 60000 80000 100000 120000
N
u
m
b
e
r
o
f
D
ro
p
P
ac
ke
ts
Number of Nodes
Number of Drop Packets Vs Number of Nodes with mobility speed 3 m/s
AODV
Figure 6.11: Number of Drop Packets Vs Number of Nodes with mobility speed of 6 m/s
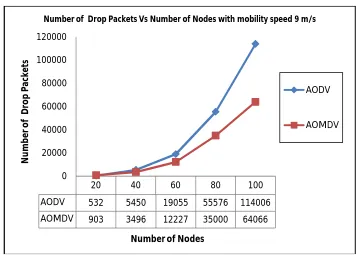
Figure 6.12: Number of Drop Packets Vs Number of Nodes with mobility speed of 9 m/s
Figure 6.10, figure 6.11 and figure 6.12 shows that the AOMDV is p er for m better than AODV with mobility speed of 3 m/s, 6 m/s and 9 m/s with increasing number of nodes in terms of number of Drop Packets. In both AODV and AOMDV number of Drop Packets slightly increases from 20 nodes to 60 nodes; but in AODV, number of Drop
20 40 60 80 100
AODV 568 3895 15676 38322 132217
AOMDV 917 3921 9328 24362 63810
0 20000 40000 60000 80000 100000 120000 140000
N
u
m
b
e
r o
f
D
ro
p
P
ac
ke
ts
Number of Nodes
Number of Drop Packets Vs Number of Nodes with mobility speed 6 m/s
AODV
AOMDV
20 40 60 80 100
AODV 532 5450 19055 55576 114006
AOMDV 903 3496 12227 35000 64066
0 20000 40000 60000 80000 100000 120000
N
u
m
b
e
r
o
f
D
ro
p
P
a
ck
e
ts
Number of Nodes
Number of Drop Packets Vs Number of Nodes with mobility speed 9 m/s
AODV
than AODV with higher number of nodes.
Normalized Routing Load in CBR traffic for AODV and AOMDV with mobility speed of 3 m/s, 6 m/s and 9 m/s is shown in figure 6.13, figure 6.14 and figure 6.15.
Figure 6.13: NRL Vs Number of Nodes with mobility speed of 3 m/s
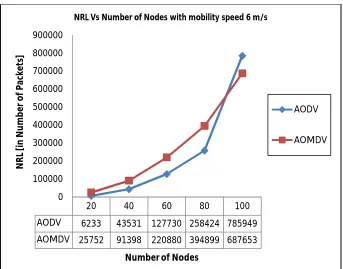
Figure 6.14: NRL Vs Number of Nodes with mobility speed of 6 m/s
20 40 60 80 100
AODV 4346 32701 58872 246110 575930
AOMDV 21441 82775 179939 360234 561540 0
100000 200000 300000 400000 500000 600000 700000
N
R
L
[i
n
N
u
m
b
er
o
f
P
a
ck
e
ts
]
Number of Nodes
NRL Vs Number of Nodes with mobility speed 3 m/s
AODV
AOMDV
20 40 60 80 100
AODV 6233 43531 127730 258424 785949
AOMDV 25752 91398 220880 394899 687653 0
100000 200000 300000 400000 500000 600000 700000 800000 900000
N
R
L
[i
n
N
u
m
b
e
r
o
f
P
ac
ke
ts
]
Number of Nodes
NRL Vs Number of Nodes with mobility speed 6 m/s
AODV
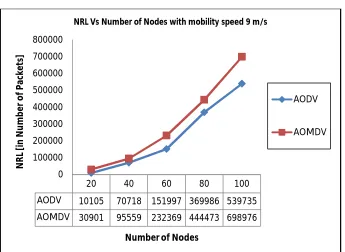
Figure 6.15: NRL Vs Number of Nodes with mobility speed of 9 m/s
Figure 6.13, figure 6.14 and figure 6.15 shows that the Normalized Routing Load of AODV is less than AOMDV with mobility speed of 3 m/s and 6 m/s with increasing number of nodes except 100 nodes, thus AODV perform better than AOMDV in these cases, while AODV perform clearly well over the AOMDV with mobility speed of 9 m/s with increasing number of nodes. It means AODV protocol performs well over the AOMDV protocol in all three mobility speed.
VI. CONCLUSION
From the above simulation results, we observe that in terms of Average Throughput performance with mobility speed of 3 m/s and 6 m/s, AODV perform well over the AOMDV, while AOMDV perform well over the AODV with mobility speed of 9 m/s with increasing number of nodes.
In all three mobility speed in terms of Packet Delivery Ratio and Normalized Routing Load; AODV perform well over the AOMDV with increasing number of nodes.
In case of Average End to End Delay and Number of Drop Packets; the AOMDV protocol performs well over the AODV protocol with increasing number of nodes in all three mobility speed.
In future we will try to evaluate and measure performance of various other MANET routing protocols with more mobility speed and large number of nodes under different traffic types.
REFERENCES
[1] Singh and Mandal, “Logistics Regression Based Reliability Analysis for Mobile Ad Hoc Network with Fixed Maximum Speed and Varying Pause Times”, in Jounral of Scientific and Industrial Research, Vol. 76, February, 2017, pp. 81-84.
[2] Safdar et. al., “Comparative Study of Routing Protocols in Mobile ADHOC Networks”, in International Journal of Computer Science Trends and Technology, Vol. 4, Issue 2, April, 2016, pp. 264-275.
[3] Natrajan and Mahadevan, “A Comparative Analysis and Perform Evaluation of TCP over MANET Routing Protocol”, in Jounral of Wireless Network and Microsystems, Vol. 4, No. 1-2, January-December, 2015, pp. 9-20.
[4] Sharma, Rizvi, Sharma, Malhan, Sharma, “Performance Evaluation of MANET Routing Protocols under CBR and FTP traffic classes”, International Jounral of Computer Technology and Application, Vol 2 (3), 2014.pp.392-400.
20 40 60 80 100
AODV 10105 70718 151997 369986 539735
AOMDV 30901 95559 232369 444473 698976 0
100000 200000 300000 400000 500000 600000 700000 800000
N
R
L
[i
n
N
u
m
b
e
r
o
f
P
ac
ke
ts
]
Number of Nodes
NRL Vs Number of Nodes with mobility speed 9 m/s
AODV
[5] Chavhan and Asole, “Comparative Analysis and Performance Evaluation of MANET Routing Protocols”, International Journal of Computer Science and Mobile Computing, Vol.3, Issue 12, December-2014, pp. 369-375.
[6] Dhenakaran and Parvathavarthini, “An Overview of Routing Protocols in Mobile Ad- hoc Network”, International Journal of Advance Research in Computer Science and Software Engineering, Vol.3, Issue 2, February 2013, pp.251-258
[7] Patil, V. C., Biradar, R. V., Mudholkar, R. R. and Sawant, S. R. “On-Demand Multipath Routing Protocols for Mobile Ad-Hoc Networks Issues and Comparison”, International Journal of Wireless Communication and Simulation 2 (2010) 21–38.
[8] Tracy Camp, Jeff Boleng and Vanessa Davies, “A Survey of Mobility Models for Ad Hoc Network Research”, special issue on Mobile Adhoc Networking: Resources, Trends and Applications, Vol. 2, No. 5, 2008, pp 483-502.