COMMISSION O F T H E E U R O P E A N C O M
MIVI W
L
¡Wi ¡i
CWJS ¡"ΊΑ\WMMtKÍI¡Kt!¡8
!*i ït'uai'nSW fliJ ΓΑ a ¡¡fitfUsfc»
lllKlflE
AUTORADIOGRAPHY AS A HELP
FOR ANALYSING THE DISTRIBUTION
OF OCACTIVE ISOTOPES
IN THE HUMAN B O D Y | | | L
AFTER AN AIR CONTAMINALO!
by
Ιώμύ
|f-4 ΦΑΙΗ
tf
the
Communities.
European C o g n i t i e ,
contractors nor any person acting on their behalf :
Make any warranty or representation, express or implied, with
respect to the accuracy, completeness, or usefulness of the
information contained in this document, or that the use of any
information, apparatus, method, or process disclosed in this
Assume any liability with respect to the use of, or for damages
resulting from the use of any information, apparatus, method
Λ„ _ „ „ „ „ „ „ Λ ; „ „ 1Λ„ „ , 1 j v . 4-V.4o / I n n i i T v i D T i f . ' î . i i K l W
IlSr
Uli
l l l X V X 1 1 1 Ct L J L U l l j <X\J\J(X1. 0 1 / U . O y JJLití U L A W U j \J*. ¿JA U V ^ k J U v * - i . u v * \ S h J W \ A
document may not infringe privately owned rights ; or
Assume any Hability with respect to the use of, or for
process disclosed in this document.
M
» I I I »jå™i?;!f
This report is on sale a t the addresses listed on cover pagi
ÉIÉII
. t « »
i l
page 4
at the price of F.Fr. 6.65 B.Fr. 70.— DM 4.40 It. Lire 750.— Fl. 4.30
l i
.Mp
When ordering, please quote the EUR number and the titl
which are indicated on the cover of each report
Mí
J
m
tor
* St£
■ '"il
¿¿ψ
imi
Printed by L. Vanmelle, Ghent
« Γ Ρ ' ItL* I rü i 1941r*if*' l i l ' * JL ' l U T V l t l H l M B n ' n S l k 7 * N ^ -MITMÍJI'l'I ■ T Ì Ì T Ì I M Ì V Mt* r* *
This document was reproduced on the basis of the best available copy.
EUR 4594 e
AUTORADIOGRAPHY AS A HELP FOR ANALYSING THE DISTRI BUTION OF α-ACTIVE ISOTOPES IN THE HUMAN BODY AFTER AN AIR CONTAMINATION by J.P. VAANE, E.M.M. de RAS and Chr. von BRANDENSTEIN
Commission of the European Communities
Joint Nuclear Research Centre — Karlsruhe Establishment (Germany) European Institute for Transuranium Elements
Luxembourg, February — 36 Pages — 9 Figures — B.Fr. 70,— According to the lung model of the I.C.R.P. the size distribution of the particles of an aerosol is an important parameter for calculating the distribution of radioactive dust in the respiratory tract.
This report gives a review and a short description of autoradiographic methods used to determine the distribution of α-active particles collected by dust filters, and an example of such a calculation after the release of α-activity into the respiratory air.
EUR 4594 e
AUTORADIOGRAPHY AS A HELP FOR ANALYSING THE DISTRI BUTION OF α-ACTIVE ISOTOPES IN THE HUMAN BODY AFTER AN AIR CONTAMINATION by J.P. VAANE, E.M.M. de RAS and Chr. von BRANDENSTEIN
Commission of the European Communities
Joint Nuclear Research Centre — Karlsruhe Establishment (Germany) European Institute for Transuranium Elements
Luxembourg, February — 36 Pages — 9 Figures — B.Fr. 70,— According to the lung model of the I.C.R.P. the size distribution of the particles of an aerosol is an important parameter for calculating the distribution of radioactive dust in the respiratory tract.
This report gives a review and a short description of autoradiographic methods used to determine the distribution of α-active particles collected by dust filters, and an example of such a calculation after the release of α-activity into the respiratory air.
EUR 4594 e
AUTORADIOGRAPHY AS A HELP FOR ANALYSING THE DISTRI BUTION OF α-ACTIVE ISOTOPES IN THE HUMAN BODY AFTER AN AIR CONTAMINATION by J.P. VAANE, E.M.M. de RAS and Chr. von BRANDENSTEIN
Commission of the European Communities
Joint Nuclear Research Centre — Karlsruhe Establishment (Germany) European Institute for Transuranium Elements
Luxembourg, February — 36 Pages — 9 Figures — B.Fr. 70,— According to the lung model of the I.C.R.P. the size distribution of the particles of an aerosol is an important parameter for calculating the distribution of radioactive dust in the respiratory tract.
EUR 4594e
COMMISSION OF THE EUROPEAN COMMUNITIES
AUTORADIOGRAPHY AS A HELP
FOR ANALYSING THE DISTRIBUTION
OF α-ACTIVE ISOTOPES
IN THE HUMAN BODY
AFTER AN AIR CONTAMINATION
by
J. P. VAANE, E.M.M. de RAS and Chr. von BRANDENSTEIN
1971
ABSTRACT
According to the lung model of the I.C.R.P. the size distribution of the particles of an aerosol is an important parameter for calculating the distribution of radioactive dust in the respiratory tract.
This report gives a review and a short description of autoradiographic methods used to determine the distribution of c-active particles collected by dust filters, and an example of such a calculation after the release of α-activity into the respiratory air.
KEYWORDS
RADIOAUTOGRAPHY DISTRIBUTION ALPHA PARTICLES BODY
AIR POLLUTION LUNGS
AEROSOLS
RESPIRATORY TRACT DUST
I N D E X
1.
Introduction
5
2.
Description of autoradiographical methods
β
2.1.
In General
β
2.2.
Xray film
7
2.3·
Nuclear track emulsions
9
2.3.1.
Stripping film method
10
2.3·2.
Nuclear track plates
12
2.3.3.
Calculation of the activity
12
2.3.4.
Limit of sensitivity
14
3.
Applications of autoradiographical methods in radiation
15
protection practice
3.1.
Introduction
15
3.2.
Properties of an aerosol
17
3.3.
Short description of the ICRP lung model
20
3.4.
Analysis of plutonium inhalation
21
Litterature
26
Tables
2Ö29
5
AUTORADIOGRAPHY AS A HELP FOR ANALYSING THE DISTRIBUTION OF o~ACTIVE
ISOTOPES IN THE HUMAN BODY AFTER AN AIR CONTAMINATION *)
1. Introduction
The fields for application of autoradiographical methods and
their techniques have been described in detail in the work of
A.W. Rogers /~lJ7 .
One application found for autoradiography in Radiation Protection
is the analysis of aerosol filter samples from controlled areas
in Nuclear Physics Centres, whereby the radioactivity and size of
individual particles of a radioactive aerosol can be measured by
autoradiographical methods / ~ 2 , 3_7· In the event of such an air
contamination in the respiratory compartments, the radioactive
deposits can be estimated with the help of the "Lung Model"
developed by the International Committee on Radiological
Protection (ICRP) ¿f\J7 · This model describes the deposition in
the respiratory tract as a function of the size distribution of
the particles and of their chemical and physical properties.
Dust samples in αradioactive laboratories are usually taken by
drawing air in through filters and particles present in the air
are then trapped on or between the fibres. The first measurement
of this type of captured radioactivity is usually made
electronically. However autoradiography of the filter can be
a thousand times as sensitive. The latter method is more time
consuming and more complicated but in return permits the size
and size distribution as well as activity of the particles to be
determined. Often radioactivity can only be detected by auto
radiography because of its greater sensitivity.
This report gives a review and short description of autoradio
graphic methods used to study α-radioactive particles collected
by dust filters. A method of calculating the distribution of
inhaled radioactive dust, using the I.C.R.P. Lung model is
described, for which the size distribution of the aerosol
particles investigated by autoradiography is an important
parameter.
An example of such a calculation after a release of «-activity
into the respiratory air is reported.
2. Description of Autoradiographical Methods
2.1. In general
The presence of radioactive particles on dust filter samples
can be investigated with X-ray and nuclear track emulsions.
After contact with the radioactive samples and development, the
films show blackening in the position in front of the radio
active particles. According to the type of film used the
activity of individual particles and the distribution over the
On X-ray films, in general, circular blackenings are formed,
whose intensity and size depend upon the radioactivity of the
particle and the exposure time. These blackenings are visible
without microscope, so the particle distribution on the filter
can be easily examined with this method. Under very good
conditions it is also possible to estimate the activity of
individual particles.
With nuclear track film the size of the silver halide crystals
and their concentration in the emulsion are at least an order
of ten bigger than with X-ray film, so that every ß and a
particle leaves a microscopically visible track when it passes
through the emulsion. With autoradiography of «-active filters,
which is described in this report, the tracks usually form a
star. From the number of tracks in a star the activity of
individual particles can be computed.
2.2. X-ray film
The construction of an autoradiograph with X-ray film requires
relatively little preparation: as the dust filter sample
generally consists of thin weak layers of material such as
glass-fibre, it is first mounted on cardboard and for exposure
brought into direct contact with the film. Highly contaminated _2 filters are surrounded with a thin Mylarfoil (0.9 mg.cm ) to
prevent contamination of the photographic materials. The
optimum exposure time is chosen to be adequate for the
activity present on the filter, and is determined for a
particular filter sample - if necessary, from the results of a
hours to several weeks. If there are radioactive particles
present their distribution becomes visible as blackenings after
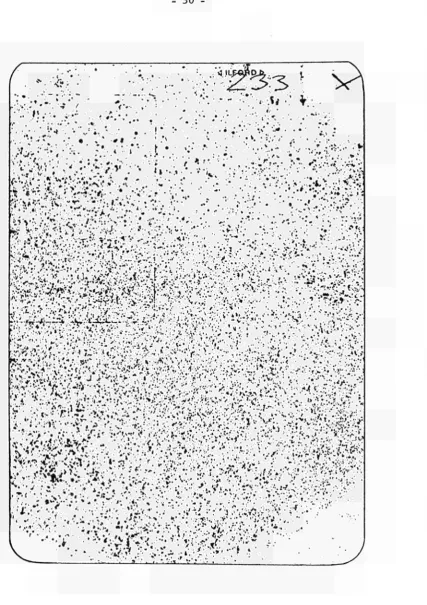
development of the film (Fig.l).
Under certain conditions the activity of the particles can be.
computed from the spot size.
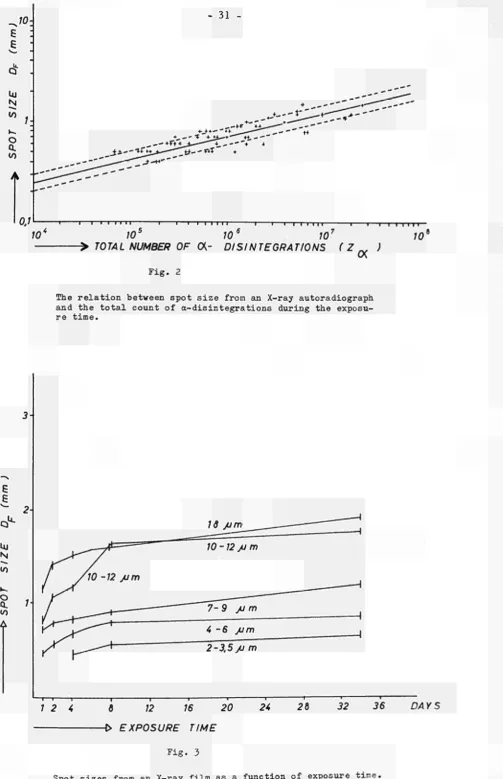
Taking a filter sample with 30 particles of known activity, we
found the following relationship between particle activity
integrated with respect to exposure time (Z ) and the spot size
DF (Fig.2):
In Ζ => 2.9 + 0.2 In D_ a a
However it was observed that with the nuclear track film hO %
of the particles investigated on the filter sample were so close
together that more than one of them was contributing to one
spot. One may accept that this is generally the case and
indeed that with more particles on the sample this percentage
is increased.
Another source of inaccuracy is the fact that as the exposure
time increases, the spot-size tends to a saturation value
(Fig.3). For this reason particle sizes will be underestimated
for exposure times shorter than those needed for saturation.
R.J.Sherwood and D.C.Stevens /~5_7 have been using a thin
layer of α-scintillator placed between the filter sample and
the film. The radioactive emission from the sample generates
photons in the scintillator and so produces blackenings of the
9
-2.3· Nuclear track emulsions
As already mentioned, every α-particle arriving in a nuclear
track emulsion produces a track which in the developed film
can be made microscopically visible. The lengths of these
tracks are a function of the energy of the α-particles on
entering the film, though consideration must be given to the
great shrinkage of the emulsion during development. The number
of tracks produced in unit time is a measure of the activity
of the «-active particles. The efficiency (track count per
α-decay) depends on various factors which will be analysed in
section 2.3·3·
If the isotopie composition of the particles and the efficiency
are known then the activity and, if the specific activity is
also known, the mass of an individual particle can be
calculated (Fig.
k).
In particular cases it is possible using
a stripping film technique (2.3.1.) to make the particles
themselves visible (Fig.5)·
In autoradiography we distinguish between three types of
nuclear track film:
- Stripping film /*3_7
Here the emulsion layer lies on a glass plate from which it
can be taken off and put over the filter. The filter is made
transparent by impregnating it with an Araldite solution, so
that the prepared sample can be microscopically examined. In
many cases the dust particles themselves as well as the
- 10
- Nuclear track plates
Here also the emulsion is fitted on a glass plate, but it
cannot be taken off as a layer, so the plate has to be
placed complete on the filter to be examined. With this
method it is not possible to make the particles themselves
visible.
- Liquid nuclear track emulsion
By this method either the filter is dipped in the emulsion
or 6oaked in it. The advantage of this method is that
particles which have penetrated too deeply into the filter
to be visible by other methods can also be examined and their
penetration depths measured.
Next follows a brief description of the three above mentioned
techniques.
2.3.1. Strippingfilm method
An analysis with strippingfilm is usually carried out if the
distribution of activity has already been determined by the
X-ray film method.
The parts of the filter which have been chosen for 2
examination, are cut into pieces of about 1 cm . Each piece
is then mounted on a warmed, grease-free microscope slide
and impregnated with Araldite. To make sure that during the
following procedure the film adheres well to the prepared
sample, this is first cooled, then dipped in a gelatine
solution, and finally dried.
- 11
darkroom and floated on the surface of a water-filled tray.
The prepared filter sample is then dipped into the water
under the film and lifted, leaving the film lying on the
sample, which is then immediately placed in a dark box and
left for exposure. The exposure time is estimated beforehand
from the activity or, in some cases, by the use of X-ray
film.
A nuclear track microscope is used for studying the developed
films.
In practice, if at least five tracks appear in a star
formation, we conclude that there exists an active particle
in the middle of the star. The diameter of the stars, and,
on some occasions, the size of the particles are measured
with a magnification of 1250 X using an immersion objective
and an ocular micrometer. The penetration depth of the
particle in the filter can be estimated from the difference
in focal distances between the filter surface and the
particle.
In many cases when the number of tracks is too large it is
impossible to resolve between individual tracks. In such a
case the middle of the star is also too black to enable the
underlying particle to be recognized. If, however, the
developed silver bromide crystals are treated with a solution
of potassium ferricyanide and fixing salts in distilled
water, the blackening disappears and the particle becomes
12
-2.3-2. Nuclear track plates
The use of nuclear track plates is appreciably simpler than
that of stripping film. The active particles themselves
cannot however be made microscopically visible. To prepare
the sample, the piece of filter is mounted on a flat base and
the nuclear track plate laid directly on and in good contact
with it. Heavily contaminated filters are covered beforehand
with a mylar foil to prevent contamination of the films, which
have to be taken off again after the exposure and development
process. During exposure the sample is placed in a
completely dark box.
B.V.Andersen /~6_7 exposes a series of nuclear track plates
to the α-particles on the filter sample being investigated,
with exposure times increasing in factors of ten from 12
minutes up to 2000 hours. Particles which produce more than
50 tracks have to be examined with an exposure time shorter
by one or more factors of ten as it is practically impossible
to count so many tracks owing to the intensive blackening..
As with the strippingfilm method, the activity is calculated
from the number of tracks and the exposure time. Here the
α-particles are not stopped in the filter so much as in the
Araldite-prepared filter with the strippingfilm method, the
tracks are appreciably longer and the stars are easier to
find. A magnification of 125 X is in most cases sufficient.
2.3·3· Calculation of the activity
With the nuclear track methods, using stripping film and
13
can be calculated from the track count (S ) produced during
the exposure time T. The efficiency
S
1 -
α
Α χ Τ
α
is a function of the following parameters:
Selfabsorption of αradiation in the particles,
Range (R
ff) of the αradiation in filter material and in
Araldite,
Penetration depth E of the particles in the filter.
The self absorption factor S can, according to Sherwood and
Stevens /~2_J7, be calculated from the following formulas
2ρ (1 Ì ρ
2) for ρ
έ 1
Α
α
2 y1
where
range of α-radiation in the material of the particle
p" D (Size of the particle)
Ρ
0 sa the count rate for α-radiation leaving the surface of
the particle.
The absorption of α-radiation in particles with a density of
about 10 gm.cm and diameter less than 10 Aim is practically
negligable
¿ 2_/.
If every αparticle entering the emulsion produces a track
then for particles with diameter ^ 10/Um,
'J
is equal to the
fractional solid angle, determined from the penetration depth
in the filter E, and R , so that
\
1
i ( i 5 — )
14
As both E and R depend on many factors, it is not really
possible to give a general value for ^1 . The penetration
depth E depends upon the density of the filter materials, on
the energy of the particles entering the filter and on the
size of the particles. For the glass fibre filters we use,
and a linear particle velocity of 30 cm.sec , E varies
up to 50/urn.
For the stripping film method the range R is determined
from the absorption in Araldite and in the fibre material of
the filters, and works out at about 30/um. When using nuclear
track plates R is merely a function of the absorption in
fibre material and lies between 80 and 100 ,um.
The efficiency ^J is therefore not a fixed constant, but
depends on the autoradiographical method used.
It is, however, possible to give a mean value for each
method, from which the activity of the particles can be
accurately calculated to within a factor of two. This means
that in respect to the diameter of the identified particle,
which is proportional to the cube root of the activity, the
maximum error is only 30 %.
For the stripping film method this mean value is found
empirically to be Ή= 0.2; for the nuclear track plate method
2.3·^· Limit of sensitivity
We define the limit of sensitivity (A ) . as the least α m m
15
filter sample using the nuclear track film method when
exposed for time T. If the existence of a particle is taken
to be certain when it produces at least 5 tracks in a star
formation, the limit of sensitivity is defined with the
following function:
5
(A ) . = — — Ci
^ Τ χ 2.2 χ Ι Ο1 2
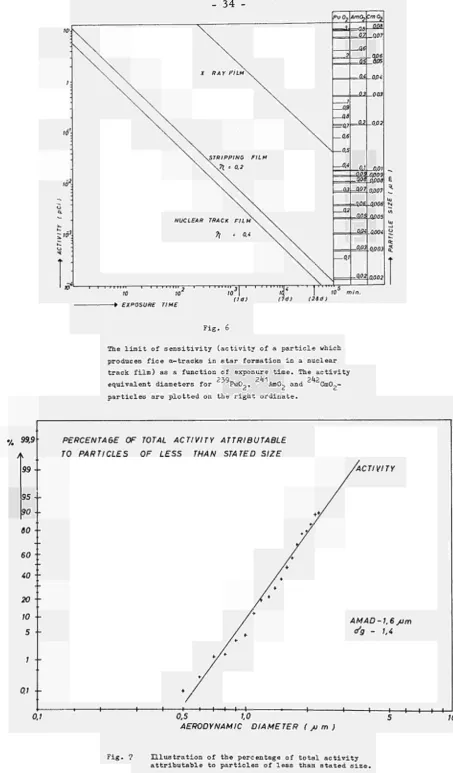
In fig.6 the limits of sensitivity for nuclear track plates
( tl = O.k) and for stripping film ( 'Π = 0.2) are shown as a function of the exposure time. The corresponding diameters of 239 2*fl 2*f2
PuO -, AmO - and CmO_ particles are set out on the ordinate for a number of activity values. It can be seen that
239
in order to identify a PuO? particle of 0.1 ,urn, it must
2^1
be exposed for one month; that an AmO particle of 2^2
comparable size can be identified in 13 hours and a CmO
particle of 0.1 /um in less than one minute.
3. Applications of autoradiographical methods in radiation protection
practice
3.1. Introduction
An example of the application of autoradiography is described
in the following analysis of an incident when plutonium
particles in the form of aerosols were liberated in the
respiratory air and that after a routine check it was suspected
that one or more of the workers present in that particular
16
-mucous, urine) were analysed autoradiographically and the
distribution of inhaled activity in the respiratory tract was
calculated. The results of these calculations were compared
with the I.C.R.P.-recommended maximum permissible values for
radioactivity in the body.
The calculation of the quantity ingested is based on the model
of the respiratory tract for internal dosimetry (lung model)
/~\_7 recommended by the International Commission on
Radiologic-al Protection (I.C.R.P.).
This lung model is an extension of an earlier recommendation of
the I.C.R.P. - also called the "simple lung model", in which
the distribution of inhaled aerosols was expected to be
independent of the particle sizes. In the course of the
following discussion "Lung model" is understood to refer to the
extended model.
The behaviour of particles after entering the respiratory tract
is described in general terms in the lung model, but in the
details there are still many uncertainties.
The I.C.R.P. has defined a "standard man" so that standardized
physiological and biological figures may be used £^lj> It must
therefore be realized when interpreting the results of these
calculations that deviations from the standard (different kind
of respiration, influence of a cold, unknown solubility of the
particles in question) exercise a considerable influence on the
17
According to the lung model the size of the particles is a
decisive factor in the distribution of aerosols in the body and
for this reason autoradiography can make a useful contribution
to the calculation of the distribution of ingested radioactivity
after air contamination.
In both of the following sections 3.2. and 3.3. we describe
firstly the properties of aerosols and then the I.C.R.P. lung
model.
3.2. Properties of an aerosol
An aerosol is a system in which solid particles or liquid drops
with sizes in the order of AMI are suspended in a gaseous medium
/~8_7. For our purposes we are only interested in aerosols
produced from solid materials.
The dimensions and shapes of the dust particles depend upon the
method of production of the aerosols, in other words, on the
type of work and the materials used. The sedimentation rate of
the individual particles in the air, that is the speed with
which they settle in still air, is a function of these
para-meters. This applies also to the relative deposition of inhaled
particles in the particular parts of the respiratory tracts,
though here the process is substantially more complicated than
sedimentation in air.
For calculating the sedimentation rate, the diameter of a
particle of irregular shape can be defined as the diameter of a
18
-Furthermore, according to Stoke*s law, the sedimentation rates
for particles of equal diameters are inversely proportional to
Τ Ϋ . The so-called aerodynamic diameter D /~8_7i also called
Stokes diameter, of a particle has therefore been defined as
the diameter of a sphere of unit density with the same
sedimentation rate in air as the particle in question, i.e.
D = D
a D)TP
f / ρ.
a
As an aerosol is composed of particles of different sizes
which can be grouped into specific intervals, it is possible
to determine the size frequency distribution in each case.
For much of the work with radioactive materials in glove boxes,
the frequency distribution of the aerosols produced is log
normal, in other words, the logarithm of the sizes form a
Gaussian (=normal) distribution. For this type of aerosols the
deposition of all particles is, according to the lung model,
a function of the so-called activity median aerodynamic
diameter (AMAD) of the aerosols ¿~k, ρ.175_7· This AMAD is
analogous to the massMAD for nonradioactive aeroeols in dust research.
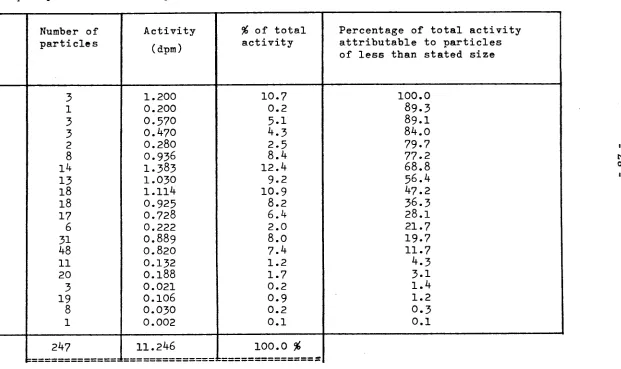
The AMAD is defined and determined as follows (table l ) : The diameters D. (i = 1, n) of a sample of η particles representing the aerosol are determined (e.g. by autoradio graphy) and put in order of increasing value. The activity A. of each particle is determined. Then for i = 1, η, the sum
i
19
of the activity of all the particles with D = D. is calculated
and similarly the percentage P. of the total activity of all
the particles,
100.S,
ρ
=1
#
i
n
Aj
The values of P. set out on logarithm probability paper as a
function of the diameter D., form a straight line for aerosols
with a log-normal distribution (fig.7). The activity median
diameter (AMD) is then, by definition, the diameter for
?
±=* 50
%.
Further should be noted that:
AMAD » AMD
y Ρ
The standard deviation of the AMAD is calculated for a log
normal probability distribution from the difference of the
logarithms of the diameters corresponding to 50
%
and 16
%
(or alternatively 84
%
and 50
%)
and ie therefore the ratio of
these same diameters. This is called the geometric standard
deviation (
4
).
The percentage deposition in the parts of the respiration
tract is now according to the lung model a function of the AMAD
and
tf
of the aerosols, the respiratory volume and frequency
of the person in question, and further dependent on some
physical and chemical properties of the particles (e.g. hygro
20
-3.3· Short description of the lung model of the I^Ç^R^P.
The I.C.R.P. first gave recommendations for the calculation of
the distribution of radioactive dust in the body in 1959
¿~7, p.33_J7· In that report a simple scheme for the distribution
of an inhaled quantity of radioactive dust in the lungs and
gastro-intestinal tract was described and for which only
soluble and insoluble materials were differentiated: the size
of the inhaled particles was not taken into account in this
first model. Later this problem was studied more deeply by a
second I.C.R.P. commission (Task Group on Lung Dynamics). The
results of these studies were published in 1966 /~\_7 and
since then have become known as the "New Lung Model".
The important characteristics of this lung model are the
following:
- The respiratory tract is devided into three major
compart-ments, Nasal-Pharynx (N-P), Trachea-Bronchial tract (T-B)
and Lungs (L).
- The respiration rate and the volume inhaled and exhaled per
minute (Minute volume) are, for normalized circumstances
(standard man /~4, p.l82_7, doing normal laboratory work)
fixed at 15 complete breaths/min and 20 Litres/min. According
to the lung model this holds good as a mean working rate.
In addition two other figures are given respectively for
higher and lower rates.
- The relative deposition of the particles of an aerosol in
21
amongst other things a function of their size, the respiration
frequency and the minute volume of the person in question.
For the deposition of all particles of an aerosol, the
activity median aerodynamic diameter of the size distribution
and its geometric standard deviation are essential.
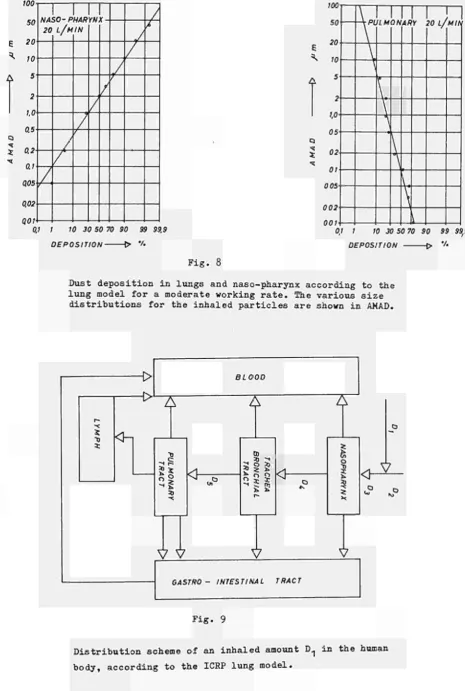
The percentage deposition in the naso-pharynx and in the
lungs is shown as a function of the AMAD of an aerosol in
fig.8 as according to /^^J- The figures apply to normal
circumstances as previously mentioned. For the deposition in
the trachea-bronchial-tract the lung model recommends a
fixed figure of 8 #, practically independent of the particle
'sizes.
The processes whereby particles inhaled into the respiratory
tract are distributed to the other organs of the human body
are not discussed here. Fig.9 shows the deposition and
excretion scheme according to the recommendations of the
lung model. From the many publications on this subject we
still note /~9_7 and /~10_7.
The following example of the calculation of an inhalation of
plutonium dust after an air contamination was worked out
according to the previously mentioned figures of the lung
model with the help of autoradiographically measured particle
sizes. An example of a
published soon /_ 11__7«
2^2
sizes. An example of a case of incorporation of Cm will be
3.4. Analysis of a plutonium inhalation
22
-239
plutonium isotopes (90 % Pu) in the form of a metal,
plutonium dust escaped into the respiratory air through a fault
in its manipulation. The measurement of an air dust filter 3 n»
away from the location of the laboratory worker in question in
the direction of the ventilation, gave a mean a-concentration
in the air of 6 χ 10~ Ci.m . From this the inhaled quantity
of activity was calculated, assuming that this activity was
distributed homogeneously in the air. With a standard minute
volume of 20 1 and a period of respiration of 10 min the -12
inhaled activity was thus found to be 120 χ 10 Ci.
A nasal smear taken directly after the incident contained -12
3 x 10 Ci, and a second sample, about 50 minutes after the
incident, 0.2 χ 10"12Ci.
An autoradiographical analysis, using X-ray film (fig.l) shows
the distribution of Pu-particles on the filter sample. With
the stripping film method it was then determined that there 2
were about 750 particles/cm on the filter, with diameters
lying between 0.1 .urn and 0.9,um (corresponding aerodynamic
diameters 0.35/um and 3.1/Um).
The size frequency distribution of the particles of these
aerosols, calculated according to the scheme in sect. 3.2., is
shown in table I and fig.7. It was determined by algebraic
analysis that the frequency distribution is log-normal. The
AMAD for this distribution is 1.6 ,urn, with a geometric standard
deviation ( (} ) of 1.4; this means that 68 % of the particles
o
-i C
have an aerodynamic diameter between ~r- = 1.1 «um and
- 23
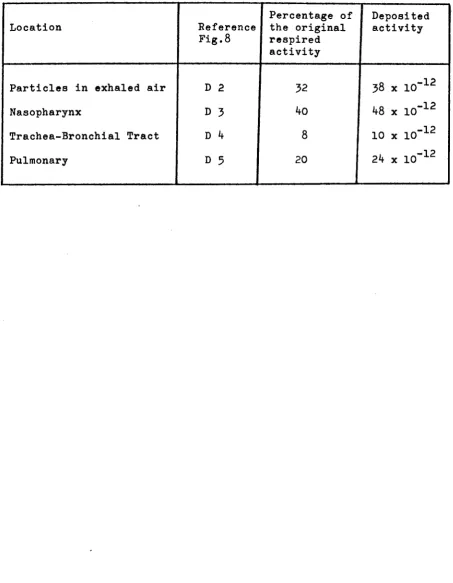
With the help of the lung model, the quantity of activity
deposited in the three parts of the respiratory compartment
can now be calculated. For this we are assuming the following
figures:
-12
Inhaled activity 120 χ 10 Ci
AMAD of the particles 1.6 ,um
6
1.4
g
It is further assumed that the laboratory worker in question
who worked at a moderate rate during the incident, has the
properties of a "standard man".
The quantities deposited in the naso-pharynx and the lung tracts
are determined from the graph in fig.8. The results are shown
in table II. The quantity deposited in the trachea-bronchial
tract is, according to the lung model, 8
%
of the inhaled
activity, independent of the particle sizes.
The results calculated in this way will be discussed in brief
further on and compared with the results of the corresponding
measurements.
-12
The activity measured in the nasal smear (3 x 10 Ci)
amounted to 6
%
of the calculated value for the naso-pharynx
as shown in table II.
These differences could be explained on the following grounds:
- In general not all the activity is removed by a mucal sample,
- only a nasal smear was taken and not a pharynx sample,
24
-gastro-intestinal tract has a half time of 4 minutes /~\_7
and in general there are many half times between inhalation
and sampling.
According to our calculation, the activity deposited in the
lungs is 24 χ I O- 1 2 Ci; this amounts to 0.15 % of the ICRP
recommended maximum permissible value of 16.000 χ 10 Ci £" 7J»
Using the lung counter, no plutonium was detected in the lungs.
The limit of sensitivity of this counter, which determines 239
the quantity of Pu present in the lungs from the outside of -12
the body by measuring the X-rays, is 12.000 χ 10 Ci. This
measurement therefore only proves that the activity present in
the lungs is less than the maximum permissible value; the
relatively insensitive method doee not permit measurement of a —12
small quantity of this order (24 χ 10 Ci).
We have not payed any attention here to many other samples
(blood, urine and faecal tests) which can give more information
about the inhaled activity, as this would go beyond the scope
of this article.
If however they are used as described above they are a valuable
help to Medical Officers and Health physicists for the
estimation of the degree of internal contamination after a
25
-We want to thank Dr.Mb'hrle, head of the Medical Department of
the "Gesellschaft für Kernforschung", Karlsruhe, for the urine
and faecal analyses which were carried out in his laboratories,
and Dr.Semiller, head of the Medical Department of the
European Communities, for the discussion of the incident
- 26
L i t t e r a t u r e
£~lj A.W.Rogers; Technique of Autoradiography, Elseviers Publ.Cy.
(1969)
£^2j R.J.Sherwood, D.C.Stevens: Some observations on nature and
particle size of airborne plutonium in the radiochemical
laboratories, Harwell, A.E.R.E.-R 4672 (1964)
/~*3_7 D.C.Stevens: Location and Examination of Alpha Active
Airborne Dust Particles Collected on Glass Fibre Filter
Paper, A.E.R.E.-M 989 (1962)
2^~4__7 Deposition and Retention ModelB for Internal Dosimetry of
the Human Respiratory Tract: Task Group on Lung Dynamics,
Report of Committee II of the International Commission on
Radiological Protection, Health Physics 12, I966, pp.173-207
£5_7 R.J.Sherwood and D.C.Stevens: A phosphor-film technique to
determine the activity of individual particles on air
sample filters, Ann.Occup.Hyg. Vol.11, I968, pp.7-12
/~"6_J7 B.V.Andersen: Plutonium aerosols particle size distributions
in room air, Health Physics, 10, 1964, p.897
/"*7_7 Recommendations of the International Commission on
Radio-logical Protection, I.C.R.P. Pubi.2, Report of Committee II,
Permissible Dose for Internal Radiation, 1959
¿f"8__7 N.A.Fuchs, C.N.Davies: The Mechanics of Aerosols, Pergamon
27
/~9_7 E.D.Dyson and S.A.Beach: The movement of inhaled material
from the respiratory tract to blood: An analogue
investigation of the new lung model,
Health Physics, 15, I968, p.385
/"~10_7 Irai C.Nelson: Theoretical excretion of Plutonium in urine
based on the new ICRP lung model, BNWL-SA-1247
/~11_7 J.P.Vaane and E.M.M. de Ras: Analysis of a case of internal
contamination with Cm-242 (will be presented at the II
Congress of the "International Radiological Protection
Table I
Size frequency distribution computed for a sample of plutonium particles on a filter
Aerodynamic particle diameter ( /um )
2.7 - 2.8 2.2 - 2.3 2.1 - 2.2 2.0 - 2.1 1.9 - 2.0 1.8 - 1.9 1.7 - 1.8 1.6 - 1.7 1.5 - 1-6 1.4 - 1.5 1.3 - 1.4 1.2 - 1.3 1.1 - 1.2 1.0 - 1.1 0.9 - 1.0 0.8 - 0.9 0.7 - 0.8 0.6 - 0.7 0.5 - 0.6 0.4 - 0.5
Number of particles 3 1 3 3 2 8 14 13 18 18 17 6 31 48 11 20 3 19 8 1 247 z=============r Activity (dpm) 1.200 0.200 0.570 0.470 0.280 O.936 I.383 I.030 1.114 O.925 O.728 0.222 O.889 O.82O O.132 O.188 0.021 O.IO6 O.O3O 0.002 11.246 ==============
% of total activity 10.7 0.2 5.1 4.3 2.5 8.4 12.4 9-2 10.9 8.2 6.4 2.0 8.0 7.4 1.2 1.7 0.2 0.9 0.2 0.1
100.0 %
============== s
Percentage of total activity attributable to particles of less than stated size
29
Table II
Computed distribution over the respiratory compartments according
to the lung model
Location
Particles in exhaled air
Nasopharynx
TracheaBronchial Tract
Pulmonary
Reference
Fig. 8
D 2
D 3
D 4
D 5
1 Percentage of
1 the original
respired
activity
32
40
8
20
| Deposited
I activity
38 χ 10~
1 248 χ IO"
1212
10 χ 10
ÍC- 30
«- » y ; ; . ' , · · ..*·/>· ■· ·. i i · . , . · . v ¡ ·.·.-··.···.····. ··· ·.· · -." ν»».:,
' • • • Í : V , » : . . · · · . " . ' * ; * ·* ' v . ·. · · · * ■ : . . , · . · ' ..·*■
(
.·■■'■
Γ··;: Vv-íVO?·*•-•v. · - . . · · - . · ' · , ' · · ·*. ·:.; •,'i:"s>;..*Vv>;i·
^••»^«¿■rV^.·.^ ·.*..··;';. - ν · . ·· -
, · ; · ■ · . ••.•'•••;.>^.V¿íí
■LÍA'··· .*, ^ ' , > . . . . / · · ■ . : · ' · ■ · ■ · · "¿· .' . · ' · . · >■· · · ■ · · ' * · · "»·· ' ' · " -··
W~' ^■Sk-W^Á
v^i
< · » ■ ■ . » ·
-.ι* ·': V:
•Vf!
. ■ · ·
. "··.,· ^ > ; ν-ί.ιΛ
.' v« •'4
v
' t ·
'..:' ' .*"*" -. ·· « ·*ί · • 4
.'i.. \. ." ,:* #»
:.?.*·;:·
. »»
ι
■ ·
. ι ·
1 · \
\Λ:
'· ι
• ** • r / >, • ·.. ·. .· *. • . . · · ; . · * .
f ■
·.%" \J¿
'. "·:·'ν ·· . . . · ■
" . ' ν .
■ ^ . . .
.τ ··:·;·:
. . . ·ι. ■■■ .»>'
[image:34.595.95.523.50.656.2]F i g . 1
Autoradiograph of
an
a i r
f i l t e r sample on which t h e r e a r e
10-ε
ε
d
Uj
Ν
¡Λ
Ο Ο.
CO
7-0.1
- 31
-ι 1 1—I I I I I I — ι ι ι — ι ι ι ι ι ι 1 1 1—ι ι ι ι 1 1
104 10s io6 107 106
> TOTAL NUMBER OF (λ- DISINTEGRATIONS (Z )
F i g . 2
The r e l a t i o n between s p o t s i z e from an Xray a u t o r a d i o g r a p h and t h e t o t a l count of α d i s i n t e g r a t i o n s during t h e exposu r e t i m e .
τ — ι — I I I I I I
ε
ε
Uj Ν to
o
Ο ΙΟ
-ι—ι
r-1 2 4
—Γ~
12
2-3,5 ju m
d 12 16 20 -f> EXPOSURE TIME
24 26 32 36 DAYS
F i g . 3
[image:35.595.64.568.23.803.2]32 —
L·,^.^ ^i¡S^-2¡¡Liiua.aS¿]L:l:
Fig. 4
— 33 —
Fig. 5
34
--> EXPOSURE TIME
<26d>
F i g . 6
The limit of sensitivity (activity of a particle which
produces fice α-tracks in star formation in a nuclear
track film) as a function of exposure time. The activity
239 2^1 2^2
equivalent diameters for PuO,, AmO, and
CmO--particles are plotted on the right ordinate.
% 99.9
A 99 +
95
90
60
--60 40
20 JO
5
1 0.1
-0.1
PERCENTAGE OF TOTAL ACTIVITY ATTRIBUTABLE TO PARTICLES OF LESS THAN STATED SIZE
/ACTIVITY
AMAD-1.6jum a'g - 1.4
■A—μ
■+-O.S 1,0
AERODYNAMIC DIAMETER ( β m )
-i
[image:38.595.92.461.33.391.2]—i-10
Fig. 7 Illustration of the percentage of total activity
[image:38.595.53.507.34.808.2]- 35
ε
Q WO 50 20 IO 5 2 1.0 0.5 0.2 0.1 Q05 0,02 0,01I I I I
20
ζ
f ' L/M / / IN / ! / / / f / / / Å
ε
100 50 20 10 5 2 1.0-05 02 01 005-0020,1 1 10 30 50 70 90 99 99,9
DEPOSITION 1> V.
001
u
\V
\ \ . \ \ \l
\ , \\
f
20 L/Mir
0.1 1 10 30 50 70 90 99 999
DEPOSITION ·/.
F i g . 8
Dust d e p o s i t i o n in lungs and nasopharynx according to the lung model for a moderate working r a t e . The various s i z e
d i s t r i b u t i o n s for the inhaled p a r t i c l e s a r e shown in AMAD.
Fig. 9
Distribution scheme of an inhaled amount D1 in the human
[image:39.595.53.519.98.790.2]O T I G E T O T H E R E A D E R
J '■'••ΙΓΓ; liitu' .
^■.Umhi'tiULiit
lîrfi'MÈ'
All scientific a n d technical reports published b y the Commission of the E u r o p e a n Communities are announced in t h e m o n t h l y periodical " e u r o - a b s t r a c t s " . F o r subscription (1 year : US$ 16.40, £ 6.17, Bfrs 820,) or free specimen copies please write to :
«assis
ill
¡imp.'
m\m
.:::::::::::;::::::::::::::::::::::::::::::::::::::::::::::::::;
pj:;: · · · T o disseminate knowledge is to disseminate prosperity — 1 mean
•: " . " . general prosperity a n d n o t individual riches — a n d with prosperity
HI disappears t h e greater p a r t of the evil which is our heritage from d a r k e r times.
m
Pil*
i l U W . i * · * . . * .
Ä
WÊSmm
Ili
IM«
._iied by the Commission of the European Communities are on sale a
listed below, at the prices given on the back of the front cover. When ordering, specify clearly EUR number and the title of the report which are shown on the front cover.
P.O. Box 1003 - Luxembourg/station
I
I
'ices