http://www.scirp.org/journal/ojs ISSN Online: 2161-7198
ISSN Print: 2161-718X
Logistic Regression Modelling for Complex Survey
Data with an Application for Bed Net Use in
Mozambique
Sheyla Rodrigues Cassy1,2, Isabel Natário2, M. Rosário Martins3
1Departamento de Matemática e Informática, Faculdade de Ciências, Universidade Eduardo Mondlane, Maputo, Moçambique 2CMA; Departamento de Matemática, Faculdade de Ciências e Tecnologia, Universidade Nova de Lisboa, Caparica, Portugal 3Global Health and Tropical Medicine, GHTM, Instituto de Higiene e Medicina Tropical, IHMT, Universidade Nova de Lisboa, UNL, Lisboa, Portugal
Abstract
Logistic Regression Models have been widely used in many areas of research, namely in health sciences, to study risk factors associated to diseases. Many population based surveys, such as Demographic and Health Survey (DHS), are constructed assuming complex sampling, i.e., probabilistic, stratified and multistage sampling, with un-equal weights in the observations; this complex design must be taken into account in order to have reliable results. However, this very relevant issue usually is not well analyzed in the literature. The aim of the study is to specify the logistic regression model with complex sample design, and to demonstrate how to estimate it using the R software survey package. More specifically, we used Mozambique Demographic Health and Survey data 2011 (MDHS 2011) to illustrate how to correct for the effect of sample design in the particular case of estimating the risk factors associated to the probability of using mosquito bed nets. Our results show that in the presence of complex sampling, appropriate methods must be used both in descriptive and infe-rential statistics.
Keywords
Survey Logistic Regression, Complex Samples, Bed Net, Malaria, DHS
1. Introduction
The analysis of survey data based on public access to large medical and social surveys, such as the Demographic and Health Survey data (DHS), is becoming very common in huge number of studies. The samples are often obtained through complex designs,
How to cite this paper: Cassy, S.R., Natário, I. and Martins, M.R. (2016) Logistic Regres-sion Modelling for Complex Survey Data with an Application for Bed Net Use in Mozambique. Open Journal of Statistics, 6, 898-907.
http://dx.doi.org/10.4236/ojs.2016.65074
Received: July 29, 2016 Accepted: October 21, 2016 Published: October 24, 2016
Copyright © 2016 by authors and Scientific Research Publishing Inc. This work is licensed under the Creative Commons Attribution International License (CC BY 4.0).
involving stratification, clustering, multistage sampling, unequal probability of selec-tion of participants and responding rates. Using clustering, observaselec-tions from the same cluster are correlated and, in order to have unbiased estimators, sample weighting needs to be adjusted for this cluster effect. Ignoring the sampling method in data analy-sis can lead to inaccurate results. Some authors evaluated the adverse consequences of ignoring the sampling scheme in statistical analysis [1]. That means that in order to make valid inference for the population of interest where samples were originated, ap-propriate statistical methods are required to analyze such complex survey data.
In medical and social sciences, where the interest is to predict a binary outcome from a set of covariates, it is common the use of the logistic regression model. The logistic regression model is a member of the generalized linear models (GLM) class and it is an appropriate model for studying the relationship between a binary response variable Y, representing success
(
Y =1)
or failure(
Y=0)
, and a set of covariates(
1, 2, , p)
x= x x x ′. Assuming then a Bernoulli distribution for the outcome variable Y,
follows that this model can be written as:
( )
ln( )
( )
0 1 1 ,1 p p
x
g x x x
x
π
β β β
π
= = + +
− +
(1)
or equivalently,
( )
x exp(
0 1 1x pxp)
(
1 exp(
0 1 1x pxp)
)
π = β +β + + β + β +β + + β , (2)
where β β0, 1,,βp are the unknown parameters to be estimated and
( )
x P Y(
1 |x)
π = = is the probability of the success.
The parameters of the model are estimated by the maximum likelihood method, as-suming that the observations are independent and identically distributed. However, under complex sample designs, involving stratification, clustering, multistage sampling, and unequal probability of selection of observations, the assumption of independence between observations is usually not observed. The parameters estimation by maximum likelihood could lead us to an incorrect estimation of the standard errors involved and, consequently, problems in the associated hypotheses tests. Therefore, it is necessary to adjust the methods of the standard logistic regression, to consider the complex sam-pling design in order to make valid inferences [1]-[3].
Several studies in health sciences analyzed data coming from complex sampling de-sign using different type of software [4]-[7], however none of them presents the speci-fication and the estimation methods behind the logistics regression model. Most of the studies are a black-box, presenting only the final results with no mention to the estima-tion method and estimators properties. Our work fills this gap, giving the opportunity to all researchers to understand and to replicate the logistic model with complex sam-pling in R.
contracting the disease in women in reproductive age (15 - 49 years). To achieve the objective of the study, we used the Mozambique Demographic Health and Survey data 2011 (MDHS2011) concerning women aged 15 - 49 years. Since the sample of the MDHS 2011 is probabilistic, stratified and multistage, with unequal weights in the ob-servations, i.e., a complex sampling design, and in order to obtain reliable results, the effect of the sampling design had to be taken in consideration in the descriptive and in-ferential analyses. Thus, it was necessary to select and use appropriate methods to compensate for the effect of sample design in the analysis, implemented in the survey package of the software R [8][9].
The rest of the paper is organized as follows. The logistic regression for complex survey sample is described in Section 2. In Section 3, we describe the sampling method of the MDHS data and how it was taken into account in the application of the use of the mosquito bed net in Mozambique. Finally, section 4 gives a brief conclusion.
2. Logistic Regression under Complex Survey Data
As referred in [2][3], the standard logistic regression model is inappropriate when the data refer to samples from complex sampling designs.
Suppose that a finite population U =
{
1, 2,,N}
is divided into h=1, 2,,H strata, each stratum is further divided into j=1, 2,,nh primary sample units (PSU), each of which is constituted by i=1, 2,,nhj secondary sample units (SSU), each comprehending nhji elements. Assume also that the observed data consists of nhj′ SSU chosen from nh′ PSU in the stratum h. The total number of the observation isthen given by 1 1 1
hj h
H n n
hji
h j i
n=
∑ ∑ ∑
= ′= =′ n . Each sampling unit has an associated sampling weight given by the inverse of its probability of inclusion in the sample, denoted hereby hjik 1
hjik
w
π
= , for the hjik-th unit.
Additionally, let Yhjik denote the binary response variable, xhjik denote the cova-riate matrix and β denote the regression coefficients. Thus in general the survey lo-gistic regression model is given by
(
)
{
}
{
(
)
(
(
)
)
}
logit P Yhjik =1 |xhjik =ln P Yhjik =1 |xhjik 1−P Yhjik =1 |xhjik = xhjik′ β. (3)
So under the complex sampling design, the parameters β of the logistic regression model are estimated by the maximum pseudo-likelihood method also called weighted maximum likelihood that incorporates the sampling design and the different sampling weights in the estimation of the β [2][3][10][11]. The main idea of this method is to define a function which approximates the likelihood function of the sampled finite population with a likelihood function formed by the observed sample and the known samplings weights [2][3] [10][11]. In this case the pseudo-log-likelihood function is given by
( )
{
(
)
(
)
(
)
}
1 1 1 ln 1 |
1 ln 1 1 | ,
hj h
H n n
p h j i k hjik hjik hjik hjik
hjik hjik hjik
l w y P Y
y P Y
′ ′
= = =
= × =
+ − × − =
∑ ∑ ∑ ∑
xx β
where whjik is the weight of the observation hjik. The maximum pseudo-likelihood estimator of β is obtained by deriving the pseudo-log-likelihood function in order
to β and equals is to zero,
( )
d( )
0 dβlp
= =
β β .
Under complex sampling designs, there is not a direct form to calculate the variance estimators. Thus, to obtain the variance estimators by maximum pseudo-likelihood we use the methods like the Taylor linearization (also called as delta method), Jackknife replication and bootstrap [2][3][11]. In this paper, we use the methods like the Taylor linearization method which is the method implemented in the R software package sur-vey [8] that we use. This method results in the following variance estimator of β:
( )
ˆ(
)
1(
)
1,
Var β = X DX′ − S X DX′ − (5)
where X is the covariate matrix, D=WV is the diagonal n n× matrix with
ele-ments ˆ
(
1 |)
1 ˆ(
1 |)
hjik hjik hjik hjik hjik
w ×P Y = x −P Y = x , and S is the pooled estimator within-stratum of the covariance matrix. This estimator is given by
(
)
1(
..)(
..)
11 1 ,
h
H n
h j hj h hj h
h j h n f n ′ … … = = ′ ′ = − − − ′ −
∑
∑
S z z z z (6)
where ˆ
(
1 |)
1 ˆ(
1 |)
hjik =whjik×P Yhjik = hjik −P Yhjik = hjik
z x x , being the sum for all the
hj
n′ sampled units in PSU j in the stratum h given as .. 1
hj n
hj i hjik
′ =
=
∑
z z and specific
mean in the stratum as 1 ..
1 nh
h hj h j n ′ = =
′
∑
zz . The correction factor is given by
(
1− fh)
,where h
h h n f n ′
= is the ratio of the number of PSU observed by the total number of the
PSU in the stratum h.
The hypotheses tests for the significance of the regression coefficients and the test for the goodness of model fit also need to be modified to incorporate the sampling design and the different weights of the observations. The evaluation of the contribution of the cova-riates is now made by the adjusted Wald test [3], with test statistics given by [2][3][12]:
1 s p F W sp − + =
(
) ( )
1ˆ ˆ
W =β′Var β − β (7)
where 1 h
H h
s=
∑
= n′−H is the total number of the selected PSU minus the number ofstrata and p is the number of covariates. The F statistics above is distributed as a F-distribution with p and
(
s− +p 1)
degrees of freedom, so that the test p-value =(
, 1)
P F p s − + ≥p F.
3. Application
3.1. Burden of Malaria in Mozambique
The burden of malaria in Africa is still an important public health issue particularly in the poorest tropical countries of the continent [14]. The adverse effects of this disease are related to a vicious cycle of poverty and diseases, particularly in low income coun-tries.
In Mozambique, malaria is first cause of death. It is recognized that factors such as the environmental changes, particularly the levels of precipitation, temperature and humidity contribute to develop the best conditions to have mosquito in all the country. Additionally, it has been very difficult, for economic reasons, to prevent and treat all people, namely women and children, the more vulnerable group. Consequently, a na-tional plan to control and eliminate malaria was developed and implemented in the country at the community level. One of the strategies developed has been the mosquito bed net distribution. However, the indicators related to the use of bed nets by women and children in Mozambique are still clearly below the desired levels [15].
In this context it is crucial to understand factors associated to mosquito bed net use in Mozambique.
3.2. Data, Sampling and Design Weights
The data used in the research are the national, population-based, cross-sectional survey from 2011 Mozambique Demographic and Health Survey (MDHS 2011). MDHS 2011 gathers information from 13,919 households, being interviewed 13,745 women aged 15 to 49 years and 4035 men 15 to 64, and having this collection of data be made between July and November 2011, through home interviews with application of three types of questionnaires (households, women and men).
The sample of Mozambique DHS in 2011 followed a complex sampling design (i.e. combined stratified and cluster in two stages, with unequal probabilities of selection that result in weights sample to separate the sample components) and was designed in order to obtain representative estimates at the national, provincial level (11 geographic areas: Maputo province, Maputo city, Inhambane, Gaza, Sofala, Manica, Zambezia,
Nampula, Tete, Niassa and Cabo Delgado), regional (north, center and south) and residence of area (urban and rural), for women of 15 - 49 years and men 15 - 64 years. The strata considered in the sample were at the province level and residence level. The first stage of the selection of the sample consisted of obtaining 611 primary sample units (PSU), which are the enumeration areas, based on the 2007 population and habi-tation census, with the probability proportional to the number of household in each stratum within the provinces.
The probability of the selection for the PSU j in the h stratum is given by:
1 ,
hj hj
hj h
j
n n
n
π = ′ ×
∑
(8)
1, ,
h= H, nhj is the number of the households within the PSU j;
∑
jnhj is the total number of the households in the stratum h. In the second stage, the secondary sample units (SSU) were sampled, the households. There were selected nhj′ households (20 in urban PSU and 25 in rural PSU) of the total of nhj households in PSU j of stratum h, with conditional probability of selection household i in PSU j in stratum h given by(2 | ) ,
hj i hj
hj
n
n
π = ′
(9)
where i=1,,nhj′ . Thus, the probability of selection an household i in PSU j in stra-tum h is
( )
(
)
(
)
1 2 | .
hji hj i hi nhj nh jnhj
π =π ×π = ′ × ′
∑
(10)Finally, data were collected from all women aged 15 to 49 years and men 15 to 64 years who were in the selected household. The allocation is not proportional in the sample, weights are used to compensate these unequal sampling probabilities; by doing this, we can infer results from the sample to the population. The sample weights are the inverse of the overall probability, with some corrections for non-responses. For further details see [16].
3.3. Data Analysis
Survey logistic regression was applied to identify factors conditioning the use of the bed net. The outcome variable is the use of the bed net for sleeping in the last night (1 = use, 0 = no use).
For the aim of this study, we used data of the women in reproductive age, extracted from the women specific survey, and we joint that information with the one provided for the household, in order to obtain some relevant variables like the owner of bed net, type of mosquito bed net in the household, number of bednets in the household, household dwelling sprayed in the last year, which were not include in the women data base. The two databases where linked according to the methodology proposed by [17].
The independent variables included in the model are: grouped age, marital status, province, place of residence, education level, wealth index, currently pregnant, current-ly working, number of household members, sex of the household head, source of drinking water, owner of bed net, type of mosquito bed net in the household, number of bed nets in the household, household dwelling sprayed in the last year.
specifying the predictors and their functional form together with the link function, we use function svyglm. The model goodness of fit was done like is explained in [8].
3.4. Results
3.4.1. Summary Statistics
The sample includes 13,745 women at reproductive age (15 - 49 years) in Mozambique in 2011. The median age is 28.6 and mainly of the women lived in rural area (65.3%) and are married (or live together) (67.8%). The educational level is very low: 31.2% are illiterate, 50.2% have the primary education and only 1.3% attained higher educational level; about 11% of women reported being pregnant; 61% are not working and the ma-jority of the women referred the head household was a man (64.7%); most of the households (54.4%) have access to improved source water.
About 61% own at least one mosquito bed net, however only 38.4% of the women used the mosquito bed net to sleep in the last night and 22.6% of the women referred that the household was dwelling in the last 12 months.
Based on Rao-Scoot independence test, we verified a statistically significant associa-tion (at the 1% level) between the outcome variable (use of mosquito bed net) and the covariates: grouped age, province place of residence, education level, currently working and source water. For the other variables there is not sufficient evidence to support that they are associated with the outcome variable.
3.4.2. Logistic Regression Estimation
In the first step we included all the covariates cited in the section 3.3. Then we retained only the variables with coefficients statistically significant at the 5% level. This strategy was confirmed using likelihood ratio tests for complex sampling. The final model in-clude: age grouped, marital status, province, place of residence, education level, wealth index, currently pregnant, number of the household members and number of mosquito bed net in the household.
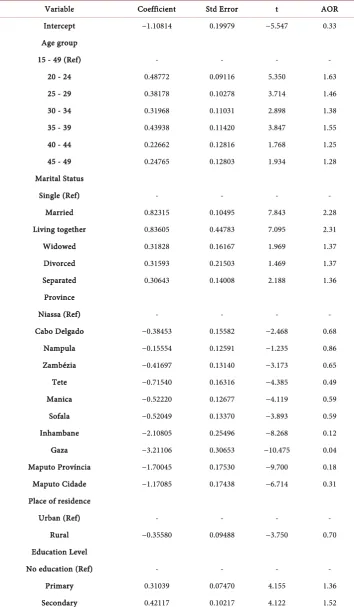
Table 1 shows the logistic regression complex sampling results. As can be seen, ad-justing for other variables, older woman have a greater chance to use the mosquito bed net; for example, women aged 20 - 24 years have a probability 1.63 higher to use the mosquito bed net (OR = 1.63) when compared with those aged 15 - 19 years.
The province of the south of the country area (Inhambane, Gaza, Maputo Province and Maputo City) were less likely to the use of bed net when compared to the province Niassa. Women living in rural area have less (OR = 0.70) chance to use the mosquito bed net, compared to women in the rural area.
Married women, living together, widows, divorced and separated are more likely to use the mosquito bed net when compared with single women, OR = 2.28, 2.31, 1.37, 1.37, 1.36, respectively.
More educated women are more likely to use mosquito bed net compared to woman with no education (OR > 1), adjusting for other variables.
Table 1. Logistic regression estimation results with complex sampling.
Variable Coefficient Std Error t AOR Intercept −1.10814 0.19979 −5.547 0.33 Age group
15 - 49 (Ref) - - - -
20 - 24 0.48772 0.09116 5.350 1.63 25 - 29 0.38178 0.10278 3.714 1.46 30 - 34 0.31968 0.11031 2.898 1.38 35 - 39 0.43938 0.11420 3.847 1.55 40 - 44 0.22662 0.12816 1.768 1.25 45 - 49 0.24765 0.12803 1.934 1.28 Marital Status
Single (Ref) - - - -
Married 0.82315 0.10495 7.843 2.28 Living together 0.83605 0.44783 7.095 2.31 Widowed 0.31828 0.16167 1.969 1.37 Divorced 0.31593 0.21503 1.469 1.37 Separated 0.30643 0.14008 2.188 1.36
Province
Niassa (Ref) - - - -
Cabo Delgado −0.38453 0.15582 −2.468 0.68 Nampula −0.15554 0.12591 −1.235 0.86 Zambézia −0.41697 0.13140 −3.173 0.65 Tete −0.71540 0.16316 −4.385 0.49 Manica −0.52220 0.12677 −4.119 0.59 Sofala −0.52049 0.13370 −3.893 0.59 Inhambane −2.10805 0.25496 −8.268 0.12 Gaza −3.21106 0.30653 −10.475 0.04 Maputo Província −1.70045 0.17530 −9.700 0.18 Maputo Cidade −1.17085 0.17438 −6.714 0.31 Place of residence
Urban (Ref) - - - -
Rural −0.35580 0.09488 −3.750 0.70 Education Level
No education (Ref) - - - -
Continued
Higher −0.62791 0.20173 −3.113 0.53 Wealth index
Poorest (Ref) - - - -
Poor 0.05235 0.10416 0.503 1.05
Middle 0.21029 0.10697 1.966 1.23
Richer 0.07031 0.13116 0.536 1.07
Richest 0.24259 0.16536 1.467 1.27 Currently pregnant
No (Ref) - - - -
Yes −0.31564 0.08494 −3.716 0.73
Nr of members in household −0.28331 0.01489 −19.033 0.75 Nr of mosquito bed net 1.43923 0.05517 26.087 4.22
0.75) woman chance to use a mosquito bed net. Finally, for each additional bed net in the household there is an increase (OR = 4.22) in the chance to use the bed net, by women, adjusting for other variables.
4. Conclusion
Complex sampling frames are widely used in population based surveys such as DHS. However, the complexity behind this methodology that involves stratification, cluster-ing, and multistage sampling is still not well understood by applied health scientists. In this paper we fill this gap by specifying the logistic regression model and its estimation within the context of complex sampling, using R software and an example related to bed net use in Mozambique. We show that is possible to have reliable results and more efficient estimators using appropriate methods to correct for the effect of sample de-sign. Moreover, this study together with the availability of an open source software (R) must encourage scientist to use more frequently the large amount of public access sur-vey data bases namely in low income countries.
Acknowledgements
We thank the Editor and the referee for their comments. This work was partially sup-ported by the Fundaçãopara a Ciência e a Tecnologia (Portuguese Foundation for Science and technology) through the project UID/MAT/00297/2013 (Centro de Ma-temática e Aplicações). Research of S. Rodrigues Cassy is funded by the Calouste Gulben-kian Foundation grant process 135422. This support is greatly appreciated. We also ex-tend thanks to DHS Measure, for allowing us to use MDHS 2011 dataset for this study.
References
[2] Hosmer, D. and Lemeshow, S. (2000) Applied Logistic Regression. 2nd Edition, Wiley Se-ries in Probability and Statistics. http://dx.doi.org/10.1002/0471722146
[3] Lee, E.S. and Forthofer, R.N. (2006) Analyzing Complex Survey Data. 2nd Edition, Sage, Thousand Oaks. http://dx.doi.org/10.4135/9781412983341
[4] Chinomona, A. and Mwambi, H.G. (2015) Estimating HIV Prevalence in Zimbabwe Using Population-Based Survey Data. PloS ONE, 10, e0140896.
http://dx.doi.org/10.1371/journal.pone.0140896
[5] Baume, C.A. and Franca-Koh, A.C. (2011) Predictors of Mosquito Net Use in Ghana.
Mala-ria Journal, 10, 265. http://dx.doi.org/10.1186/1475-2875-10-265
[6] Mutuku, F.M., et al. (2013) Physical Condition and Maintenance of Mosquito Bed Nets in Kwale County, Coastal Kenya. Malaria Journal, 12, 46.
http://dx.doi.org/10.1186/1475-2875-12-46
[7] Zango, A., et al. (2013) Determinants of Prevalent HIV Infection and Late HIV Diagnosis Among Young Women with Two or More Sexual Partners in Beira, Mozambique. PLoS ONE, 8, e63427. http://dx.doi.org/10.1371/journal.pone.0063427
[8] Lumley, T. (2010) Complex Surveys: A Guide to Analysis Using R. John Wiley and Sons, Hoboken, Washington. http://dx.doi.org/10.1002/9780470580066
[9] Lumley, T. (2015) Survey: Analysis of Complex Survey Samples. R Package Version 3.31-0. [10] Archer, K.J., Lemeshow, S. and Hosmer, D.W. (2007) Goodness-of-Fit Tests for Logistic Regression Models When Data Are Collected Using a Complex Sampling Design.
Compu-tational Statistics and Data Analysis, 51, 4450-4464.
http://dx.doi.org/10.1016/j.csda.2006.07.006
[11] Lumley, T. (2004) Analysis of Complex Survey Samples. Journal of Statistical Software, 9, 1-19. http://dx.doi.org/10.18637/jss.v009.i08
[12] Lumley, T. and Scott, A. (2014) Tests for Regression Models Fitted to Survey Data.
Austral-ian and New Zealand Journal of Statistics, 56, 1-14. http://dx.doi.org/10.1111/anzs.12065
[13] Lumley, T. and Scott, A. (2015) AIC and BIC for Modeling with Complex Survey Data.
Journal of Survey Statistics and Methodology, 3, 1-18.
http://dx.doi.org/10.1093/jssam/smu021
[14] World Health Organization (2009) World Malaria Report 2009. Geneva. [15] Roll Back Malaria (2013) Annual Report 2013.
http://www.rollbackmalaria.org/microsites/annualreport2013/
[16] Instituto Nacional de Estatística, Ministério da Saúde, Maputo, Moçambique and MEASURE DHS, ICF International, Calverton, Maryland, USA, Relatório Final IDS Moçambique 2011.
[17] Vanderelst, D. and Speybroeck, N. (2014) Loading, Merge and Analyzing Demographic and Health Surveys Using R. International Journal of Public Health, 59, 415-422.