2016 3rd International Conference on Information and Communication Technology for Education (ICTE 2016) ISBN: 978-1-60595-372-4
1 INTRODUCTION
Feature selection is to select some of the most effective features from a set of features in order to reduce the dimension of feature space. The characteristics of the selected should have the following characteristics: distinguishing, reliability, good independence, and less quantity. Based on the high-order correlation coefficient, this paper extracts the feature which has the minimum coefficient, and selects the features according to the correlation coefficient.
The image features have characteristics of small sample, high dimension, great noisy, high redundancy and non-linear, the linear correlation analysis can partly show the image feature data rules, and only show the simple linear structure of the data, it cannot show the nonlinear nature and complexity. The paper proposes a feature selection and mining algorithm through high step association analysis, mines the various features of object recognition using property related analysis, makes up the defects that linear correlation can not accurately determine the nonlinear structure. This paper mainly studies the water bridge feature mining algorithm and recognition method based on multi-source remote sensing image fusion.
2 FEATURE ANALYSIS AND EXTRACTION OF MULTI-SOURCE REMOTE SENSING IMAGES
2.1 Feature analysis of multi-source remote sensing images
In multi-spectral images, the width of usual large bridges is only 1-3 pixels, the length is less than 20 pixels, extraction bridges often appear missing or false alarms. The color of waters and lands is greater difference, so the color feature in multi-spectral images can be used to extract waters and potential bridge areas.
The bridge features in panchromatic images are significant, but it is difficult to extract the river regions and distinguish the waters and bridges, the computing complexity is too large by using the texture feature extraction panchromatic image waters.
SAR images have advantages such as all-weather, good penetration, large area imaging with high sensitivity, vast role distance. The gray value of artificial target is significantly higher than other targets in SAR images, it is easy to extract artificial targets, but it is difficult to distinguish between the bridge and the other artificial objects. Due to the noise and shadow effects, bridge position deviations may also exist, it needs to find a better algorithm for accurate positioning and target recognition.
An Effective Image Feature Selection and Mining Algorithm
Yongmei Zhang, Li Ma, Qing Ye
School of Computer Science and Technology, North China University of Technology, China
Lei Hu
School of Computer Information Engineering, Jiangxi Normal University, China
2.2 Feature extraction of multi-source remote sensing images
This paper segments the land and water using the color characteristics of multi-spectral images, gets potential bridge areas, respectively extracts the texture features and the regional mean ratio characteristics of the potential bridge areas from panchromatic and SAR images, mainly recognizes bridges based on the results of panchromatic images, and supplemented by SAR images through fusion on the decision level.
Feature extraction of potential bridge areas includes high-level and low-level feature extraction. The low-level feature extraction mainly includes the bridge texture, the regional mean ratio, edge length, length-width ratio, direction ratio, profile, Pun histogram entropy, mean, variance, etc. High-level feature extraction of potential bridge areas is topological relations between potential bridge target and waters.
2.2.1 Extraction the regional mean ratio feature in SAR images
In SAR images, bridges often have fracture phenomena, bridge edge features are not obvious and more sensitive to noise, so it is easy to cause false alarms and missing recognition only using shape and position features. The paper presents a method for extraction the regional mean ratio feature in SAR images. SAR images are very sensitive to the angle scattering body formation of man-made targets (especially metal targets), man-made targets show particularly bright spots or regions in SAR images. The regional mean ratio reflects relative brightness mean value in the regions, the larger regional mean value tends non-stationary regions in SAR images, namely urban buildings, roads and bridges etc. The regional mean ratio feature is helpful to keep the target shape, and can better protect the edges of the images, therefore, the paper uses the regional mean ratio feature to get the potential bridge areas, and helps to solve the difficult problem of identifying the bridges. The regional mean ratio is calculated as follows.
( , ) 0 0
( ) ( ) /
1 1
( ) ( , ); ( , )
M N
i j k i j
rrm k u k u
u k f i j u f i j
n ∈ M N = =
=
= =
×
∑
∑∑
(1)
Where n is the number of the pixel in the region,
f(i,j) is the brightness values of point (i,j) for SAR images, M and N are respectively the height and width of the images, u(k) shows the mean value of brightness in area k, and u indicates the mean value of brightness for SAR images.
2.2.2 High-level feature extraction of potential bridge areas
In the paper, high-level feature extraction of potential bridge areas is topological relations between potential bridge target and waters, and it is the relationship between the surface and the surface. The feature extraction steps of topological relationship between bridge and water areas list as follows.
(1) Respectively extract the edge images of the waters and each potential bridge area a1 and a2 by 8 neighborhood search method, the binary images of the waters and each potential bridge area b1 and b2.
(2) Get the internal point of the image c1 through image subtraction of b1 and a1; get the internal point of the image c2 through image subtraction of b2 and a2.
(3) Get the image d1 through the image sum of a1 and a2, get the image d2 through the image sum of c1 and c2.
(4) Providing the number of pixel value for 2 in image d1 is g, the number of pixel value for 2 in image d2 is h, the number of pixel value for 1 in image c1 is m, the number of pixel value for 1 in image c2 is n.
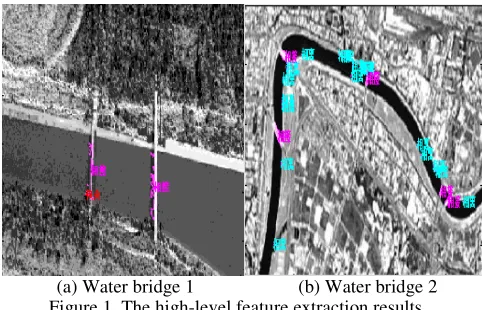
[image:2.612.316.557.340.495.2](a) Water bridge 1 (b) Water bridge 2 Figure 1. The high-level feature extraction results.
(5) If g=0, h=0 then judge the disjoint relation of water and bridge areas. If g≠0, h=0 then judge the join relation of water and bridge areas. If g=0, h≠0, m=h and m≠n then judge the inclusion relation of water and bridge areas. If g=0, h≠0 and m=n then judge the coincidence relation of water and bridge areas. If g=0, h≠0, m=g and m≠n then judge water region contains potential bridge region. If g≠0, h≠ 0 and m=h then judge water area is covered with potential bridge area. If g≠0, h≠0 and m=g then judge potential bridge area is covered with water area. If g≠0, h≠0, m≠g and m≠h then judge the intersection relation of water and bridge areas.
topological relations of bridges and waters are generally connection, which is consistent with the positional relationship of bridge and water areas.
3 A FEATURE SELECTION AND MINING ALGORITHM
3.1 Mathematical theory for high step association analysis
In existing methods, linear correlation level is mainly considered, which makes it difficult to find out the rule hidden in data. The paper presents a method that is high-order association analysis, which can offer intrinsic relation between factors, so it may provide evidence information for object recognition. The description of relationship between random variables involves two concepts, one is covariance Cov(X,Y)=EXY-EXEY, or correlation coefficient
ρxy= 1/2 1/2
) ( ) (
) , (
Y Var X Var
Y X Cov
(2)
Where Var(X) and Var(Y) are the variances of variable X and Y respectively. X and Y are not correlative, which is equivalent to Cov(X,Y)= 0. The other is independence, that is, F(X,Y)= F(X) F(Y), where F(X,Y) is a joint distribution function, F(X) and F(Y) are both distribution functions. The correlation coefficient is easy to compute, whereas the independence is difficult to prove.
From the nature of correlation coefficient, we know |ρxy| ≤1 and |ρxy|=1 if and only if X and Y are
linear correlation whose probability is 1, i.e., there exist constants a and b, so that: P{Y=ax+b}=1. This formula expresses the linear relation between X and
Y.
Example 1. Let Y=cos(X), X~N(0, 2π), where N(0, 2π) is a uniform distribution. Then we can get the following results.
xy
ρ =0.0491,
ρ
x2y=0.234,y x3
ρ
=0.345,ρ
x4y=0.463,y x5
ρ
=0.517The computed results show that Cov(Xk,Y) or
y xk
ρ
, k=1,2,3,…, can describe the hidden nonlinear correlation, so we introduce high-order correlation.Definition. If there exist two positive integers k,l
such that Cov(Xk,Yl)≠0, then we say there is (k,l )-order correlation between X and Y. Cov(Xk,Yl) is called (k,l)-order covariance and k l
y x
ρ
is called(k,l)-order correlation coefficient.
It is obvious that ρxyis the simplest situation while k=l=1. If k>1 or l>1, then we say there is high-order correlation between X and Y. If ρxy=0, it only shows that there is no obviously linear correlation between X and Y, but it is unknown whether nonlinear relation exists or not. If there exist two integers k, l such that k l
y x
ρ
≠0, then we say X and Yare of (k,l)-order correlation. When
ρ
xkyl=1, we callit positive (k,l)-order correlation. When k l
y x
ρ
=-1, we call it negative (k,l)-order correlation. If∣ k ly x
ρ
∣<1, (k,l)-order correlation level weakens along with ∣ k l
y x
ρ
∣reduces. It is all known that if X andY are independent, there exist all positive integers k,l
such that k l
y x
ρ
=0, then they are not correlative. Theorem. Suppose that X and Y are two random variables, EXk,EYl and EXkYl all exist and are limited, then X and Y are independent if and only ifEXkYl = EXk EYl,for k,l=1,2,….
High-order correlation can not only describe the hidden nonlinear correlation, but also can fill up the space between correlation and independence.
Example 2. Suppose X~N(0,1) and Y=X2, then
E(XY)-EX.EY = E(X3)-0=0
Namely, linear correlation coefficient between X
and Y is zero. E(X2-EX2)(Y-EY)=E(X2-EX2)2 =
Var(X2)> 0, it shows high-order correlation coefficient between X and Y is strictly larger than zero, so we can get
ρ
x2y=1, i.e., X and Y are of(2,1)-order correlation.
3.2 A feature selection and mining algorithm through high step association analysis
variance, and high-level topological relation characteristics, adopts high step association analysis in multi-feature analysis related to the bridges, eliminates redundant features through high step association analysis, selects smaller redundancy feature subset, and the sensitive recognition features are chosen. In this paper, the feature selection algorithm based on high step association analysis is proposed, the steps are as follows.
(1) Read a multispectral image, extract water areas, expand and corrode, process the adjacent relationship of water and land bridge, and get some potential bridge areas;
(2) Extract the low-level and high-level features for the potential bridge areas;
(3) Calculate the high step correlation coefficient among the features. If the absolute value of the high step correlation coefficient is larger, then both of the two feature vectors G and H are of larger correlation, the feature H is redundancy feature for the feature G;
(4) Give the relationship among the features, select the minimal correlation characteristics and smaller correlation characteristics associated with the other features. The minimal correlation characteristics and smaller correlation characteristics together with the feature are chosen as distinctive features for bridges.
4 EXPERIMENT RESULTS AND ANALYSIS Based on high order correlation coefficient formula, obtain high order correlation coefficient of vector G and H. If the absolute value of correlation coefficient
is higher, then the two eigenvectors of G and H have greater relevance, H is a redundant feature for G.
This paper respectively adopts 10 high order correlation coefficients of (1,2), (3,2), (5,4), (9,2), (7,4), (4,1), (8,4), (6,2), (7,5), (7,6), and takes the average value as a judgment criterion of the relationship between the features. Figure 2 gives the high order relevant results between the features. In order to verify the effectiveness of the proposed method, this paper adopts multiple sets of multi-spectral, panchromatic and SAR images in the experiment. The experiment results show the smaller correlation feature subsets for water bridges are energy, contrast, homogeneity and the regional mean ratio characteristics, redundancy features include mean, variance, Pun histogram entropy, direction ratio, edge length, length-width ratio, and topological relation feature. In panchromatic images, smaller correlation features with the other characteristics include energy, contrast and homogeneity. In SAR images, smaller correlation feature with the other characteristics is the regional mean ratio feature. Therefore, the distinguishing bridge features cover energy, homogeneity, contrast and the regional mean ratio characteristics.
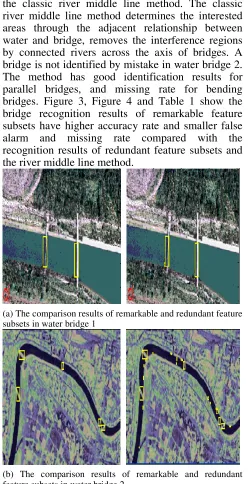
In order to verify the correctness of the remarkable feature subsets, select the features of correlation greater than 0.6 as redundant comparison feature subsets in each water bridge. Figure 3 shows the bridge recognition comparison results of remarkable and redundant feature subsets, the left is the bridge recognition result of the remarkable feature subset, the right is the bridge recognition result of the redundant feature subset.
Figure 4 gives the bridge recognition results of the classic river middle line method. The classic river middle line method determines the interested areas through the adjacent relationship between water and bridge, removes the interference regions by connected rivers across the axis of bridges. A bridge is not identified by mistake in water bridge 2. The method has good identification results for parallel bridges, and missing rate for bending bridges. Figure 3, Figure 4 and Table 1 show the bridge recognition results of remarkable feature subsets have higher accuracy rate and smaller false alarm and missing rate compared with the recognition results of redundant feature subsets and the river middle line method.
(a) The comparison results of remarkable and redundant feature subsets in water bridge 1
(b) The comparison results of remarkable and redundant feature subsets in water bridge 2
Figure 3. The bridge recognition comparison results of remarkable and redundant feature subsets
(a) The recognition results in water bridge 1 (b) The recognition results in water bridge 2
[image:5.612.315.547.43.144.2]Figure 4. The bridge recognition results of the river middle line method
Table 1. The bridge recognition results Bridge recognition
results
Accuracy rate
False alarm rate
Missing rate Remarkable feature
subsets 91% 9% 0%
Redundant feature
subsets 30% 60% 10% The recognition
results of the river middle line method
65% 14% 21%
5 CONCLUSIONS
The feature selection and mining algorithm is presented. The paper analyzes and extracts the complementary features, a variety of low-level features and high-level topological features of bridges for multi-source images, selects the less redundancy feature subset. The experiment results show the algorithm has effectively improved the accuracy of bridge recognition.
6 ACKNOWLEDGMENTS
This paper is supported by National Natural Science Foundation of China (61371143, 61262036), Research and application of the optimal image scaling technology based on content-aware research platform (XN054).
REFERENCES
[1]Peeters A, Etzion Y. 2012. Automated recognition of urban objects for morphological urban analysis. Computers Environment and Urban Systems 36(6):573-582.
[2]Liu Li, Kuang Gang-yao. 2009. Overview of image textural feature extraction methods. Image and Graphics 14(4):56-64.
[3]Pelli Denis G., Cavanagh Patrick. 2013. Object Recognition:Visual Crowding from a Distance. Current Biology 23(11): 478-479.
[4]Li Xiao-juan, Shen Nan. 2008. Bridge recognition algorithm based on multi-source information fusion.
Computer Engineering and Design 29(22):78-83.
[5]Jiang Zhi-xiong, Lu Chun-yang, Yu Hong-liang. 2014. Mining of Data Redundancy Characteristic in Deduplication Systems. Journal of Chinese Computer Systems 35(10): 2237-2242.
[6]Lillywhite, Kirt, Lee Dah-Jye, Tippetts Beau. 2013. A feature construction method for general object recognition.
Pattern Recognition 46(12): 3300-3314.
[7]Wen Jiang-ping, Hu Yang-feng, Wang Wu-di, Zhang Li-li. 2010. An effective water and land segmentation method of SAR image. Journal of Sichuan Ordnance 2(12):108-110. [8]Zhou Xiao-cheng, Wang Xiao-qin, Luo Jian-cheng. 2010.
[image:5.612.54.304.47.531.2] [image:5.612.59.295.562.702.2]