2017 2nd International Conference on Computer Engineering, Information Science and Internet Technology (CII 2017) ISBN: 978-1-60595-504-9
Cross-Platform Embedded-System Dynamic
Information Acquisition Method
YISEN WANG, JING JING, JIANJING SHEN and WEIYU DONG
ABSTRACT
With the widespread application of embedded devices, embedded software vulnerabilities and oriented attacks to embedded system are also rising. As being well-known, the hardware architecture of the embedded devices is heterogeneous, and the software stacks on them are customizable and flexible as well. Although dynamic information extraction and analysis technologies have been successfully used for general platform in vulnerability mining, malicious code detection and so on, its usage on embedded system lags behind significantly. The paper provides (1) a Cross-Platform - Dynamic Instrumentation Framework, which, by leveraging an extensible intermediate code module and a semantic constraint database, decouples the instrumentation plugins from underlying hardware and OS; (2) a set of instrumentation interfaces which may be implemented by plugins to extract runtime state of various code granularity; (3) ability of system semantic introspection to extract processes and modules information (system semantic views), by using system attribute description files and abstract state extraction functions. Compared with TEMU and DECAF, our method shows more advantages in performance of abstract state extraction, and reducing the time and memory overhead.
INTRODUCTION
With the rapid development of Internet of things technology, the number of embedded devices has increased exponentially. A variety of software vulnerabilities and malicious attacks, which have been often found on x86 platform, are spreading to the embedded field [1]. At present, the common vulnerability analysis methods include static analysis and dynamic analysis, which are complement for each other [2]. Due to the various types of embedded device processors and operating system versions, it is very complicated to set up dynamic simulation environment for embedded devices. Therefore, dynamic analysis technology in embedded field is facing severe challenges [3] [4]. A study on dynamic information extraction technology will significantly improve the efficiency of software reverse analysis of embedded system and is important to maintain the security of embedded system.
The dynamic information extraction technology is widely used in many fields: dynamic information flow tracking based on hardware[4][5], dynamic memory testing based on source code instrumentation[6], memory address monitoring traces based on binary code instrumentation[7], and whole-system simulation[8][9], etc. The dynamic information extraction technology ensures high efficiency, but needs to add additional _________________________________________
components in CPU, whose hardware expansion is expensive and has poor applicability. Dynamic memory testing based on source code instrumentation has high speed and good flexibility, but depends on source code. It is very difficult to acquire source code in a realistic environment, so the practicability is poor. The method based on binary code instrumentation can dynamically trace the third party libraries and binary executable program, but this method cannot trace operating system code, so it is incapable in system exploit. The dynamic information extraction technology based on whole-system simulation can be subdivided into virtualization based on hardware and whole-system software simulation. The efficiency of the information flow extraction based on hardware virtualization is better, but it requires hardware platform to support virtualization technology, and it cannot run the client operating system based on another architecture on underlying hardware architecture [8]. However, in the case of the absence of specific embedded hardware platform, the dynamic information extraction technology based on whole-system software simulation can dynamic extract client operating system code and user code of another architecture. What’s more, most embedded devices have removed the debugging interface when delivery [10], therefore only the fourth method can realize the whole system dynamic information extraction of embedded system. Although the technology has been successfully used on x86 platform, research on embedded platform lags behind significantly [11].
This paper presents a Cross-Platform Embedded-system Dynamic Extraction Framework (abbreviated "CP-DIEF"), chapter 2 gives the framework of CP-DIEF, chapter 3 introduces three key technologies of the framework, chapter 4 tests the space performance, time performance and accuracy of CP-DIEF, in the last chapter, we did the discussion and prospect.
CP-DIEF Framework
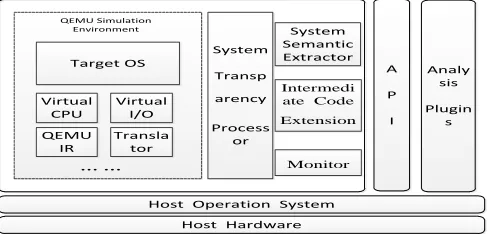
QEMU is an open source whole-system dynamic simulation tool, which can simulate a variety of hardware platform (including cpu and external device) and a variety of OS. This paper designs CP-DIEF based on QEMU. The frame structure is shown in Figure 1.
Host Operation System
Host Hardware
QEMU Simulation Environment
Target OS
Virtual CPU
Virtual I/O
QEMU IR
Transla tor
System
Transp
arency
Process or
Monitor
……
System Semantic Extractor
A
P
I
Analy sis
Plugin s Intermedi
[image:2.612.176.420.508.625.2]ate Code Extension
Figure 1. Cross-Platform Whole-System Dynamic Information Extraction Framework.
module. The QEMU simulation environment module is responsible for the construction of virtual hardware environments based on the target system, and translates target code into native code of host. The system transparent processing module is responsible for quickly generating semantic constraint schema of target system, and helps the analysts quickly generate system description file. The dynamic monitoring and abstract state extraction module is responsible for dynamically monitoring the running state of analyzed code, and extracting status information of registers, memory and other hardware information of target system. Based on system description file which is generated by system transparent processing module, the system semantic view extraction module can reconstruct the system semantic information through system semantic introspection mechanism. The framework provides a unified programming interface, which can be used to write dynamic analysis plugins by analysts.
APPROACH
In this section, we introduce how to implement cross platform embedded-system dynamic information acquisition. There are three key technologies: platform correlation removal (Section 3.1), dynamic monitoring and abstract state extraction (Section 3.2), system semantic view extraction (Section 3.3).
Platform Correlation Removal
The purpose of platform correlation removal is to achieve cross-platform simulation, which is to make the target architecture processor run on the local architecture processor. Platform correlation removal is divided into two stages: virtual execution stage correlation removal and dynamic information extraction stage correlation removal.
Virtual execution stage correlation removal
QEMU simulation environment module is responsible for removing hardware platform correlation in virtual execution stage by using the technology of dynamic binary translation (DBT). QEMU virtual execution module establishes different virtual hardware environments for different target architectures. Last, it divides the binary code of target system into basic blocks and then translates every basic block into QEMU IR. Finally, it translates QEMU IR into the executable code which can be directly executed in host platform [12]. The main reason for translating basic block is for the cost of translation is high and the basic block can be used to ensure that only the code that is bound to be executed will be translated. In addition, the basic block can effectively distinguish between code and data. The underlying reason is that the physical processor will clear the instruction queue when it encounters the jump instructions, and the instructions after the jump instruction are meaningless.
Although QEMU does different processing with different hardware architectures, it uses the same CPUState structure to save the current state of CPU, including the values of general registers, the values of flag register and so on.
Dynamic information acquisition stage correlation removal
translating QEMU IR into the intermediate code with instrumentation, such as adding the instruction level instrumentation code inst_stub after each statement, adding the block level instrumentation code bb_stub at the beginning of each basic block or at the end of every basic block, adding the function level instrumentation code func_stub at the beginning of the basic block which is judged for the function call, and so on.
Dynamic Monitoring and Abstract State Extraction
The whole-system dynamic monitoring and the abstract state extraction are based on extended intermediate language and unified system attributes description, and it is independent of the specific platform. According to different monitored objects (instructions, basic blocks and process), dynamic monitoring can be divided into fine-grained (instruction level), medium-fine-grained (basic block level) and coarse-fine-grained (process level). The analysts choose different-grain dynamic monitoring according to the special requirement, and extract the abstract status information.
Dynamic monitoring based on instrumentation
Instrumentation is often used to do program monitoring, performance test and leak detection. The basic principle of instrumentation is to add a callback function to the program which can get the program’s running state (including the CPU register and memory unit value). According to the time of inserting callback function, instrumentation can be divided into four types: source code instrumentation, compiler instrumentation, link instrumentation and runtime (binary) instrumentation. This paper uses binary instrumentation to insert callback interface into intermediate code extension module. Compared with the Pin and Valgrind instrumentation, this method does not need to interrupt the execution of the target binary code, the impact of the startup and execution time of the binary code can be minimized with this method.
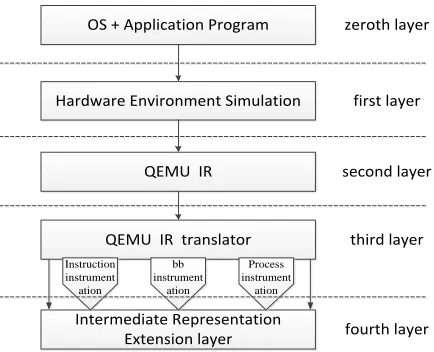
The flow chart of the target system code being translated and instrumented is showed in figure 2. In figure 2, the zeroth layer corresponds to source system level; the first layer corresponds to QEMU virtual hardware layer; the second layer corresponds to QEMU intermediate representation layer; the third layer corresponds to intermediate code conversion layer; the fourth layer corresponds to intermediate representation extension layer. Different-grain instrumentation is generated in intermediate representation extension layer.
OS + Application Program
Hardware Environment Simulation
QEMU IR
QEMU IR translator
Intermediate Representation Extension layer Instruction
instrument ation
bb instrument
ation
Process instrument
ation
zeroth layer
first layer
second layer
third layer
[image:5.612.188.405.52.228.2]fourth layer
Figure 2. Flow chart of code instrument.
TABLE 1. THE INSTRUMENT INTERFACE AND CALLBACK FUNCTIONS LIST.
Grain Instrument
Name
Instrument
Interface Callback Function
Callback Function Parameters Instruction
Level inst_stub inst_stub_enable() inst_cpu_state()
inst_addr, p_cpustate
Basic Block Level
bb_start_stub
bb_end_stub bb_stub_enable()
bb_head_cpu_state() bb_head_addr, bb_id, p_cpustate
bb_end_cpu_state() bb_end_addr, bb_id, p_cpustate Process
Level func_stub func_stub_by_name()
func_byname _cpu_state ()
func_start_addr, p_cpustate
Abstract state extraction
Monitoring the QEMU simulation execution can monitor specific events in the target system, which can provide support for system dynamic information extraction and analysis. However, in the analysis, the hardware information of the simulation execution environment is also needed to assist the analysis.
Definition 1. Program Point: Refer to the address of an instruction which is running, that is to say, the value of PC in the CPU.
Definition 2. Abstract State: Refer to the value of CPU registers and accessed memory unit.
The main purpose of dynamic monitoring target system is to extract the abstract state of Program Point that the analyst cares about while all state information of the target system is stored in the processor register of the target schema. The virtual CPU register value of the target architecture is stored in the CPUXXXState structure, such as ARM processor simulation, the value of CPU register is stored in the CPUARMState. After finishing instrumentation, the target system will call the callback function with a parameter which is the pointer to CPUXXXState. p_cpustate in Table 2 represents a pointer to CPUState.
virtual addresses to physical addresses, and provides hardware mechanism of memory access control. When QEMU executes whole-system simulation on a variety of hardware architecture, it simulates MMU too [12]. Therefore, all kinds of addresses (including the instruction address, the basic block address, and the memory address) acquired by instrumentation are all virtual address, but QEMU needs physical memory address to access memory unit. In order to implement the platform independence, we use the following two memory read functions to shield the underlying implementation details of memory extraction. The function is defined as follows:
error_t memory_read (CPUState* env, gva_t addr, void *buf, int len)
Function: read data of len char from physical memory address which virtual address add points to string buf.
error_t memory_read_with_pgd (CPUState* env, target_long pgd, gva_t addr, void *buf, int len)
Function: find the process p1 whose page directory address is pgd, and read data of len char from physical memory address which address add in virtual address space of p1 points to string buf.
Through different-grain callback functions and memory reading function interfaces, the analyst can conveniently obtain different-grain abstract states. Based on these states, the analyst can accomplish different-grain data flow analysis. Then, the analyst can complete malicious code analysis and vulnerability mining of more complex code.
Extraction of System Semantic View
System semantic view is a kind of semantic description mechanism that describes process and module in target system. It includes the process semantic view, module semantic view and so on. Process semantic view includes pid, process name, etc. Module semantic view includes module load address interval, module correspondence source, etc. This section mainly studies the system semantic view extraction and real-time update based on virtual machine introspection mechanism.
Semantic introspection based on system properties description
System properties description which is defined in section 3.1 is not detailed description of process and module, but the description of their storage location, size and other attributes. The values of these attributes not only can be obtained by analyzing the system source code, but also can be automatically obtained by constructing kernel module.
The system property description is stored in the corresponding system properties description file. Taking arm-Linux as an example, each process has a process descriptor task_struct, which includes all the relevant information. In order to refactor the process semantics, we need to complete the following work: Get the process task_struct address; Calculate the offset of members; Read the corresponding address data.
task_struct. The analyst needs to use SP to compute the virtual address of thread_info and then get Addr.
The organization structure of task_struct is different in different Linux kernel, so the migration address of the structure member is also different. To solve this problem, we build a kernel module to calculate structure member offsets, and save the migration information in the local file. Read the file and initialize the variables which store the members’ offset values when launch QEMU.
QEMU provides functions to access virtual primary memory using virtual addresses, which can read data in memory for each member associated with the process semantics. Suppose that the offset of process identifier (pid) in the target
system is N, and the size is b, so the value of pid:
pid emory_read env A, N buf b, ,
. According to the above method, the analystcan quickly reconstruct specific values of all members of task_struct, so as to realize process semantic information introspection.
The module information of the process is generally by task_struct. Taking arm-Linux as an example, task_struct contains a pointer to member mm_struct data structure, which is contained by process to describe the virtual address space of process, and each mm_struct contains multiple vm_area_struct structures. The relationship is shown in figure3. So the system can reconstruct semantic information of modules related start address, end address, next module and so on.
Semantic view update based on key event
The process and module information which are obtained by semantic introspection will be cached in struct Process_Info and struct Module_Info. The instance of Process_Info and Module_Info are respectively named the process semantic view and module semantic view. All process semantic views compose a process queue by PID. All module semantic views of every process compose a module link.
There is no thread related information in Process_Info, because threads and processes have no significant difference in Linux system. The module starting address information and attribute information contained in Module_Info correspond to some information about the vm_area_struct structure in mm_struct.
Definition 3: Key Event: Refer to the events that can be monitored and affect system semantic information once they occur. Mainly including: the page directory switch event, basic block start event and so on.
Create process descriptor will invoke the kernel of do_fork () function, loading binary executable program will invoke the kernel do_execve () function, process exits will invoke the kernel to do_exit () function. The system semantic view will update when the three functions are called.
EVALUATION
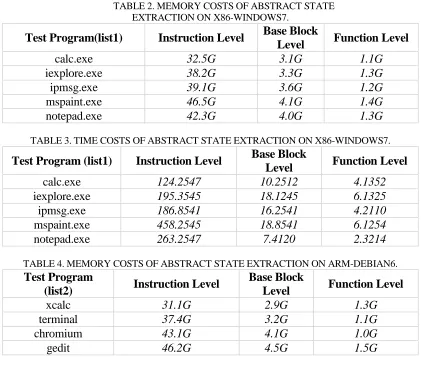
[image:8.612.87.508.300.669.2]At present, we have completed the construction of prototype system and established the system attribute description document for x86-Windows 7 and arm-Debian Squeeze on ARMEL2.6.32. Based on Commonly used program in x86-Windows 7 and arm-Debian Squeeze on ARMEL2.6.32, analyst can obtain the instruction level, basic block level and function level abstract state information by calling different-grain instrumentation interface. The test result shows: the space occupied by abstract state extraction significantly increases with grain’s decreasing, and extraction time significantly decreases with grain’s increasing. Space occupied by abstract state extraction is showed in Table 2 and table 3, and test result of time performance is shown in table 4 and table 5.
TABLE 2. MEMORY COSTS OF ABSTRACT STATE EXTRACTION ON X86-WINDOWS7.
Test Program(list1) Instruction Level Base Block
Level Function Level
calc.exe 32.5G 3.1G 1.1G
iexplore.exe 38.2G 3.3G 1.3G
ipmsg.exe 39.1G 3.6G 1.2G
mspaint.exe 46.5G 4.1G 1.4G
notepad.exe 42.3G 4.0G 1.3G
TABLE 3. TIME COSTS OF ABSTRACT STATE EXTRACTION ON X86-WINDOWS7.
Test Program (list1) Instruction Level Base Block
Level Function Level
calc.exe 124.2547 10.2512 4.1352
iexplore.exe 195.3545 18.1245 6.1325
ipmsg.exe 186.8541 16.2541 4.2110
mspaint.exe 458.2545 18.8541 6.1254
notepad.exe 263.2547 7.4120 2.3214
TABLE 4. MEMORY COSTS OF ABSTRACT STATE EXTRACTION ON ARM-DEBIAN6.
Test Program
(list2) Instruction Level
Base Block
Level Function Level
xcalc 31.1G 2.9G 1.3G
terminal 37.4G 3.2G 1.1G
chromium 43.1G 4.1G 1.0G
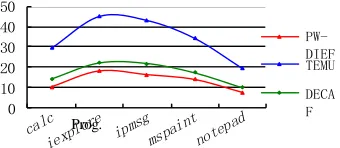
In addition, we run the test program in Table 3 on TEMU 1.0 and DECAF 1.7 with program corresponding instrumentation in instruction level, basic block level and function level instrumentation. The result is shown in figure 3 to figure 5. We build DECAF environment and run the test program in Table 3 in DECAF for arm environment and program instrumentation in different-grain instrumentation. The comparison result in time performance is shown in figure 6 to figure 8. The test results show that this system has obvious advantages in time performance.
TABLE 5. TIME COSTS OF ABSTRACT STATE EXTRACTION ON ARM-DEBIAN6.
Test Program
(list2) Instruction Level
Base Block
Level Function Level
xcalc 105.1245 8.9564 5.6897
terminal 251.3210 22.2354 15.1241
chromium 396.5414 34.1235 22.1002
gedit 167.1236 22.2214 14.8969
[image:9.612.210.376.422.495.2]
Figure 3. Time performance comparison of abstract state extraction in instruction level for list1.
0 2 4 6 8 10 12
14
PW-DIEF TEMU
[image:9.612.214.384.540.614.2]DECA F
Figure 4. Time performance comparison of abstract state extraction in function level for list1.
0 10 20 30 40 50
PW-DIEF TEMU
DECA F
Figure 5. Time performance comparison of abstract state extraction in baseblock level for list1.
Prog. Time(s)
Prog.
Figure 6. Time performance comparison of abstract state extraction in instruction level for list2.
[image:10.612.206.377.173.264.2][image:10.612.154.412.303.393.2]
Figure 7. Time performance comparison of abstract state extraction in baseblock level for list2.
Figure 8. Time performance comparison of abstract state extraction in function level.
Figure 9. Semantic information extraction.
Figure 10. Abstract status extraction. Figure 11. Netgear router simulation.
Time(s)
Prog.
Prog. Time(s)
Time(s)
[image:10.612.117.450.427.683.2] [image:10.612.174.409.434.591.2]The extraction of semantic information of arm-linux is shown in the figure 9, the process list in the left diagram is obtained by using the "ps - A" command within the simulated system. The right diagram is the result of the introspection program built to extract the process list in the target system. As can be seen from the figure, the introspection program can correctly extract the semantic view of the system-wide process in the target system. The abstract status extraction of the target system is shown in figure 10. In addition, the test result on Suterusu and other kernel rootkit program (using kernel code tampering technology to realize process hiding) shows that the prototype system can find the hidden process.
The system implements the whole system simulation of Netgear router. We first simulate a MIPS-LINUX system using the prototype system, then unzip the router firmware and extract the file system, and last put the extracted file system into the simulated system. The result of test is shown in the figure 11.
DISCUSSION and CONCLUSION
Similar work mainly include: Dynamic Analysis technology based on hardware virtualization platform and Dynamic Analysis technology based on whole-system simulation. The typical application based on hardware virtualization is dynamic analysis tool based on Xen[13] developed by Cambridge University, such as PinOS [14], Ether, MAVMM [15] and so on. This tools support dynamic information extraction on the traditional platform, however, they do not support ARM and other embedded platform. The typical application based on whole-system simulation is dynamic analysis tool based on QEMU, such as TEMU[16], Droidscope[17], DECAF[18] and so on. TEMU is a dynamic analysis tool based on QEMU that supports for Linux, Windows2000 and Windows xp. TEMU can extract semantic information of process and module in the system, it also supports fine-grained dynamic Taint Analysis. TEMU is based on old QEMU framework, so the cost of dynamic analyzing program is too high, and the speed is too slow. Droidscope is a dynamic analysis tool based on QEMU that supports for arm, but its analysis ability for Linux kernel is limited. DECAF is an updated version of TEMU based on QEMU 1.0. DECAF supports for Windows 7, Windows xp and Linux, and it supports operating system level instrumentation, however, this system doesn't make the transparent processing of operating system platform. It is difficult to expand it to other platform.
This paper designs the whole-system dynamic analysis framework CP-DIEF. The CP-DIEF realizes the simulation of a variety of hardware platforms with the help of QEMU platform, and it realizes the multi-grain real-time dynamic instrumentation based on intermediate code, and it realizes system semantic view extraction by semantic description file and abstract state extraction. The performance test result shows: this framework provides rich instrumentation interfaces, such as statement level, basic block level and function level. It has obvious superiority in the hardware platform, operating system scalability and the time performance.
REFERENCES
2. Li M, Zhou Y, Yu M, et al. Combining static and dynamic analysis for the detection of malicious JavaScript-bearing PDF documents[C]//Computer Science, Technology and Application: Proceedings of the 2016 International Conference on Computer Science, Technology and Application (CSTA2016). 2017: 475-482.
3. Costin A, Zarras A, Francillon A. Automated dynamic firmware analysis at scale: a case study on embedded web interfaces[C]//Proceedings of the 11th ACM on Asia Conference on Computer and Communications Security. ACM, 2016: 437-448.
4. Zaddach J, Bruno L, Francillon A, et al. AVATAR: A Framework to Support Dynamic Security Analysis of Embedded Systems' Firmwares[C]//NDSS. 2014.
5. Wahab M A, Cotret P, Allah M N, et al. ARMHEx: embedded security through hardware-enhanced information flow tracking[C]//RESSI 2017: Rendez-vous de la Recherche et de l'Enseignement de la Sécurité des Systèmes d'Information. 2017.
6. Saeed A, Ahmadinia A, Just M. Tag-Protector: An Effective and Dynamic Detection of Illegal Memory Accesses through Compile Time Code Instrumentation [J]. Advances in Software Engineering, 2016, 2016.
7. Chen Licheng, Cui Zehan, Bao Yungang, et al. An approach for monitoring memory address traces with functional semantic information [J]. Journal of Computer Research and Development, 2013, 50(5): 1100-1109(in Chinese)
8. Xiao Ruliang, Jiang Jun, Hu Yao, et al. A Xen oriented runtime memory leak detection method in virtual computing environment [J]. Journal of Computer Research and Development, 2013, 50(11): 2406-2417 (in Chinese)
9. Henderson A W. Selective dynamic analysis of virtualized whole-system guest environments [D]. Syracuse University, 2016.
10. Cojocar L, Razavi K, Bos H. Off-the-shelf Embedded Devices as Platforms for Security Research[C]//EUROSEC. 2017: 1:1-1:6.
11. Dimitrios N Serpanos, Artemios G Voyiatzis. Security challenges in embedded systems [J]. ACM Transactions on embedded computing systems (TECS), Volume 12 Issue 1s, March 2013. Article No.66.
12. QEMU Internals [OL]. [2014-09-10]. http://qemu.weilnetz.de/qemu-tech.html
13. Xen. What is Xen Hypervisor [OL]. [May 2011]. http://www.xen.org /files/ Marketing /WhatisXen.pdf.
14. Luk C K, Cohn R, Muth R, et al. Pin: building customized program analysis tools with dynamic instrumentation[C]//Acm sigplan notices. ACM, 2005, 40(6): 190-200.
15. Nguyen A M, Schear N, Jung H D, et al. Mavmm: Lightweight and purpose built vmm for malware analysis[C]//Computer Security Applications Conference, 2009. ACSAC'09. Annual. IEEE, 2009: 441-450.
16. Heng Yin, Dawn Song. TEMU: Binary Code Analysis via Whole-System Layered Annotative Execution[R]. Electrical Engineering and Computer Sciences University of California at Berkeley, Pittsburgh, PA, USA, January 11, 2010.
17. Yan L K, Yin H. Droidscope: seamlessly reconstructing the OS and Dalvik semantic views for dynamic android malware analysis [C] //Proceedings of the 21st USENIX Security Symposium. 2012: 1-16.