2016 Joint International Conference on Artificial Intelligence and Computer Engineering (AICE 2016) and International Conference on Network and Communication Security (NCS 2016)
ISBN: 978-1-60595-362-5
The Gait Pattern Predicted Model Based on Neural Network
Gui-Liang CHEN
1,a, Xiao-Qiang FENG
1,b,
Chen-Chen ZHENG
1,c, Geng-Qian LIU
1,d,*1College of Mechanical Engineering, Hebei University of Technology, Tianjin, China
a[email protected], b[email protected], c[email protected], d[email protected]
*Corresponding author
Keywords: Rehabilitation, Gait Pattern, Image Processing, GRNN.
Abstract. Gait pattern planning of the Lower Limb rehabilitation robot, which is the key point of the efficient of rehabilitation. In our work, the walking motion was captured with a webcam using passive markers, and the joint data captured was curve fitted by the Fast Fourier Transform function. For generating the joint angle waveforms of the lower limb during walking, we introduced a method for gait pattern planning. The Generalized Regression Neural Network (GRNN) was applied to predict the Fourier coefficient vectors for a specific subject in this method. After the trained GRNN the Gait Pattern Predicted Model (GPPM) was built. In the end, the quality of the Gait Pattern Predicted Model (GPPM) was examined. The results show that the constructed waveforms closely match the actual waveforms based on the assessment parameter outcomes. From the experiment results, it can be demonstrated that this method is effective.
Introduction
With the aged society, the paralysis of the lower limbs caused by the spinal cord injury (SCI) and stroke is the common diseases in elderly people [1-2]. The conventional manual therapy is conducted by the professional therapists, but the rehabilitation effect relies on therapist’s experience and it also requires high-intensity and repetitive training [3]. The disabled and other movement disorders increased quickly, which leads to the lack of professional therapists [4]. So the robot-assisted rehabilitation and therapy has been developed to solve the above problems.
To improve the treatment effects, and the natural gait of healthy people should be built [5]. The most common strategy for rehabilitation is based on normative movements, which is designed by the models of normative trajectories [6-7], The trajectories were recorded from unimpaired volunteers [8]. The method was commonly used in the early passive rehabilitation training. In the late period of recovery treatment, the gait disorders should be trained and assisted by the rehabilitation robot. Gait disorders walking independently, but the pathological factors should be corrected by the assisted robot. During this period, real-time planning of the actual gait parameters is required. For receiving this purpose, Gait Pattern Predicted Model (GPPM) should be built in advance.
The gait pattern is not only decided by kinematics’ characteristics of human physiological mechanism, but also influenced by some other factors such as age, gender, etc. To derive the theory of natural gait pattern is difficultly, because of its generation is relatively complex. So in some researches, the method of experimental analysis was used in gait pattern. The normal walking joint angle data was captured by the technology of video capturing and image processing [9-10]. Luu. T P et al. has respectively predicted the gait pattern by multilayer perceptron neural network (MLP) and Generalized Regression Neural Network (GRNN) using the experiment data [11-13]. Daachi et al. has put forward a method to control the exoskeleton for rehabilitation training using RBF neural network [14].
meanwhile the walking process was recorded by the technology of video acquisition and the lower limb joint angle was extracted by the image processing in our work, and finally the joint angle data was curve fitted by Fast Fourier Transform (FFT) function. Generalized Regression Neural Networks (GRNNs) were applied to predict Fourier coefficient vectors from the given gait parameters (Stride Length (SL) and Gait Speed (GS)). The Fourier coefficient vectors were defined as input vectors of neural network in training set and the Stride Length (SL) and Gait Speed (GS) were defined as the target vectors of neural network. The trained GRNN model was defined as Gait Pattern Prediction Model (GPPM) can predict any gait pattern, then the waveforms generated from Gait Pattern Prediction Model (GPPM) were compared to the actual waveforms using the image processing.
Experimentation
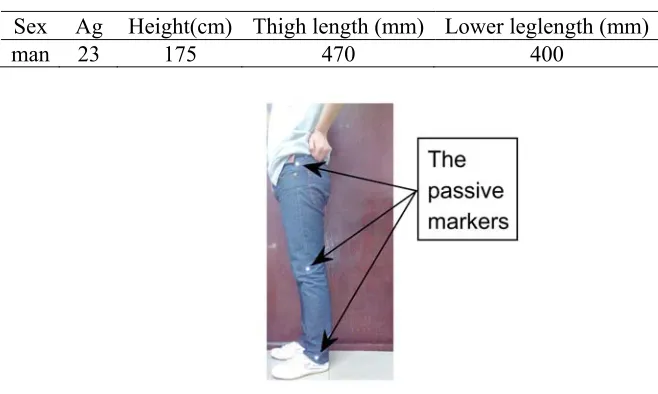
[image:2.612.141.470.273.470.2]Body parameters of the volunteer are shown in Table 1. Fig. 1 shows the position of passive markers of lower limb joint.
Table 1. Body parameters of the volunteer.
Sex Ag Height(cm) Thigh length (mm) Lower leglength (mm)
man 23 175 470 400
Figure 1. Position of the passive markers.
Experimental Setup
At first, the subject walking relaxed at one fixed Stride Length (SL) and Gait Speed (GS), and the joint passive markers of hip, knee, and ankle in the sagittal plane for the walk was recorded by a webcam. The subject walking at different Gait Speed (GS) and Stride Length (SL) per experiment.
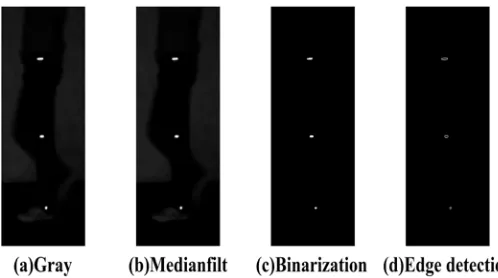
Secondly, the gait cycle extracted from the recorded video, and then the frames extracted from it. In order to extract the joint coordinates of the passive markers, each frame of the video was image processed, and the image gray processing, median filtering, image binaryzation and edge detection are included in the main process of image processing. The results of the image processing are shown in Fig. 2.
Thirdly, the lower limb hip and knee joint angles were calculated separately by Eq. 1 and Eq. 2. In our work, the reference zero degree of the joint angle is defined as the point of the state of stand up straight in the sagittal plane, the legs swinging forward defined as positive and on the contrary as negative.
2 1
1 2
arctan _
y y
x x angle
Hip
3 2 2 3 arctan _ y y x x angle Knee
. (2)
Whereby (xi , yi) is the joint coordinates of the passive markers and i is the joint index. The joint of
hip, knee and ankle defined as numbers 1, 2, 3, respectively.
Fourth, hip and knee joint angles are calculated from the experiment data using image processing in MATLAB, and then the joint angle waveforms were curve fitted by the Fast Fourier Transform (FFT) function. The results show that the fifth-order Fourier series can perfectly satisfy our requirements. According to the above experimental setup, the actual gait pattern was built for the subject.
The gait trajectory of the volunteer extracted from the video frames is shown in Fig. 3. To analysis the gait pattern easily, the process of overground walking was divided into three stages: start stage, intermediate stage and stop stage as shown in Fig. 3. The start stage starts from lifting foot to the leg stand straight, the intermediate stage starts from the end of the first stage to the leg stand straight again and the stop stage start from the end of the second stage to stand still. Therefore, the process of walking can be depicted in piecewise function. We chose the intermediate stage as the research object for its periodicity. Now take one walk of the experiment data for example. Fig. 4 presents joint angle waveforms of hip and knee in the sagittal plane for the walk of subject curve fitted by the fifth-order Fast Fourier Transform (FFT) function. Fig. 4 shows that waveforms curve fitted perfectly, so the fifth-order Fast Fourier Transform (FFT) function was chosen in our work. Therefore, each joint angle waveform can be compressed, represented and reconstructed by Eq. 3 as follow:
5 4 3 2 1 = 2 × + 2 × + =
∑
∑
5 1 = 5 1 =0 T ) m , , , ,
mt π sin( b ) T mt π cos( a a ) t ( f m m m m
. (3)
Whereby a0,am,bmare the Fourier coefficients, T is the gait cycle, m is the Fourier series and t is
[image:3.612.189.438.441.580.2]the time.
Fig.3 Gait trajectory of the volunteer
(The passive markers of hip, knee and ankle: from top to bottom)
Figure 4. The joint angle of hip and knee.
(* - hip joint angle calculated by image processing, Solid lines-actual hip joint angle waveform curved fitted by FFT function, Δ- knee joint angle calculated by image processing,
dotted lines-actual knee joint angle waveform curved fitted by FFT function.)
GPMM (GRNN)
The purpose of this work is to build any gait pattern for specific subject. The movement of the lower limb joint was described by the Fourier series and its waveform function was described by the Fourier coefficient vectors. In the above research, the Fourier coefficient vectors of every gait of the volunteer has been built.
The gait predicted model was applied by the method of the GRNN which consists of a radial basis network layer and a special linear network layer [16]. GRNN can be trained with a high speed and a strong nonlinear mapping capability [17]. Therefore GRNN is often used as a powerful regression tool.
[image:4.612.135.465.285.469.2]The function of GRNN was described as newgrnn(P,T, spread) in MATLAB, where P is matrix of input vectors of neural network in training set and T is the matrix of target vectors of neural network, and spread is the dispersion constant. Spread parameter should not be too big and too small. After many attempts in our work , 500 was chosen as the spread. The trained GRNN model named the Gait Pattern Prediction Model (GPPM) in this paper.
Demonstration
[image:5.612.70.542.316.408.2]The Stride Length (SL), Gait Speed (GS) of experimental data of each walk as shown in table 2. walk-18, walk-19, walk-20 in table 2 were defined as the input test vectors of neural network and the other 17 walks were defined as the input vectors of neural network in training set. The target vector of neural network as depicted in table 3 and table 4, The hip and knee Fourier coefficient vectors of the subjects is available in Table 3 and Table 4, and the first 17 walks of Fourier coefficient vectors were defined as target vector of neural network, and the other three walks were chosen for a contrast experiment: we compared the actual joint angle waveforms of these three test walks with the joint angle waveforms predicted by the GPPM which can predict Fourier coefficient vectors of any gait pattern of the subject.
Table 2. Stride Length (SL) and Gait Speed (GS) for walks.
Walks 1 2 3 4 5 6 7 8 9 10
SL (mm) 416.14 438.31 446.42 442.42 393.92 385.43 362.93 430.07 386.95 377.49 GS(mm/s) 346.79 377.85 360.01 381.39 307.75 310.83 245.22 282.94 302.31 262.15
Walks 11 12 13 14 15 16 17 18 19 20
SL (mm) 399.21 370.40 346.22 394.20 374.93 337.83 431.92 300.78 407.94 395.16 GS(mm/s) 321.94 257.22 247.30 273.75 253.33 211.15 327.21 192.81 328.98 290.56
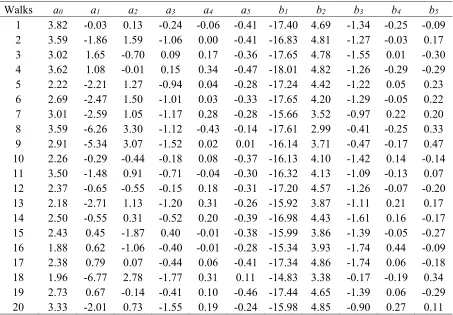
Table 3. The Fourier coefficient vectors of hip joint for walks.
Walks a0 a1 a2 a3 a4 a5 b1 b2 b3 b4 b5
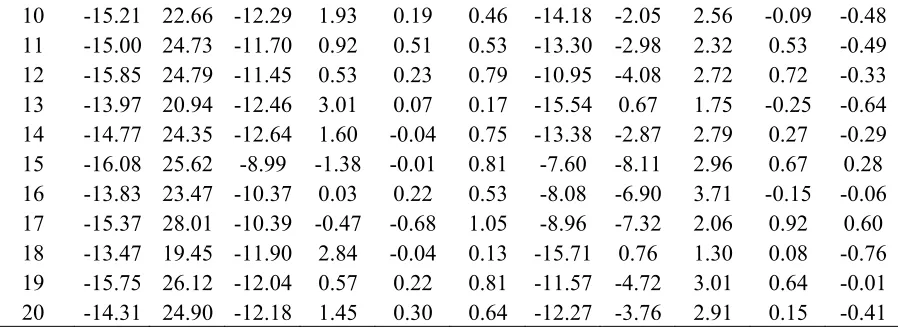
[image:5.612.81.534.436.751.2]Table 4. The Fourier coefficient vectors of knee joint for walks.
Walks a0 a1 a2 a3 a4 a5 b1 b2 b3 b4 b5
1 -15.74 27.20 -11.15 -0.37 0.33 0.93 -10.19 -6.02 2.67 1.16 -0.15 2 -15.69 28.14 -10.27 -0.69 -0.41 1.11 -10.51 -6.37 1.69 1.36 0.34 3 -16.17 29.22 -9.32 -1.35 -0.62 0.65 -7.18 -8.54 2.18 0.75 0.56 4 -16.54 27.74 -11.33 -0.86 0.09 0.98 -10.50 -6.63 2.81 1.29 -0.05 5 -15.63 24.29 -12.76 1.58 0.39 0.55 -14.67 -1.49 2.48 0.46 -0.64 6 -15.61 23.05 -12.94 2.45 0.74 0.13 -17.06 0.71 2.13 -0.17 -1.00 7 -13.82 21.03 -12.05 2.08 -0.10 0.47 -15.89 0.37 1.51 0.42 -0.70 8 -16.58 21.57 -12.59 2.71 1.00 -0.34 -22.73 5.31 0.66 -0.29 -1.04 9 -15.56 21.87 -12.06 2.15 0.63 -0.09 -18.11 1.96 1.30 0.15 -0.86
Table 4. The Fourier coefficient vectors of knee joint for walks (Cont.).
10 -15.21 22.66 -12.29 1.93 0.19 0.46 -14.18 -2.05 2.56 -0.09 -0.48 11 -15.00 24.73 -11.70 0.92 0.51 0.53 -13.30 -2.98 2.32 0.53 -0.49 12 -15.85 24.79 -11.45 0.53 0.23 0.79 -10.95 -4.08 2.72 0.72 -0.33 13 -13.97 20.94 -12.46 3.01 0.07 0.17 -15.54 0.67 1.75 -0.25 -0.64 14 -14.77 24.35 -12.64 1.60 -0.04 0.75 -13.38 -2.87 2.79 0.27 -0.29 15 -16.08 25.62 -8.99 -1.38 -0.01 0.81 -7.60 -8.11 2.96 0.67 0.28 16 -13.83 23.47 -10.37 0.03 0.22 0.53 -8.08 -6.90 3.71 -0.15 -0.06 17 -15.37 28.01 -10.39 -0.47 -0.68 1.05 -8.96 -7.32 2.06 0.92 0.60 18 -13.47 19.45 -11.90 2.84 -0.04 0.13 -15.71 0.76 1.30 0.08 -0.76 19 -15.75 26.12 -12.04 0.57 0.22 0.81 -11.57 -4.72 3.01 0.64 -0.01 20 -14.31 24.90 -12.18 1.45 0.30 0.64 -12.27 -3.76 2.91 0.15 -0.41
To demonstrate the efficiency and accuracy of the model, comparison is made to examine the difference between the joint angle waveforms predicted by this model and the actual angle waveforms extracted from the image processing. It can be evaluated by using the following quantitative parameters:
Mean Absolute Deviation (MAD)
(
)
N θ θ MAD
N
n n
∑
1 =
∧
-= . (4)
whereby N is the number of frames in one gait cycle collected from the image processing, MAD is measured in degree and it determines how much the estimated angles are close to the actual angles. ∧θ
is the lower limb joint angle predicted by the GPPM, θ is the lower limb joint angle captured by the image processing.
Correlation coefficient (ρ)
j j
j j
σθ θ σ
θ θ σ
ρ ∧
∧
whereby j is the joint index, ∧θ is the lowerlimb joint angle predicted by the GPPM, θ is the lower limb joint angle captured by the image processing. σθjθj
∧
is the covariance and σθjσθj
∧
is the variance.
The mean and standard deviation of these parameters are calculated and shown in Table 5. The results show that the correlation coefficient of hip joint are high (0.92-0.99) and knee joint are very high(0.97~0.99).The average value of MAD of hip joint are low (-0.84° ~ -0.55° ) and the knee joint are low(-1.90° ~ 0.71°). These results show that the GPPM has good predictability and can satisfy the prediction accuracy of gait pattern.
Table 5. Results.
Test walks MAD(degree) Hip Knee Hip
Knee18 0.84 -1.90 0.92 0.97 19 0.08 0.71 0.99 0.99 20 -0.55 -1.07 0.99 0.99
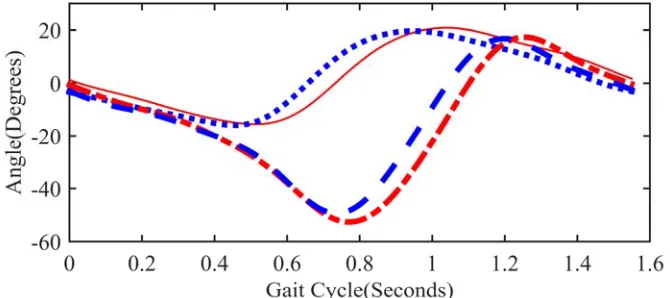
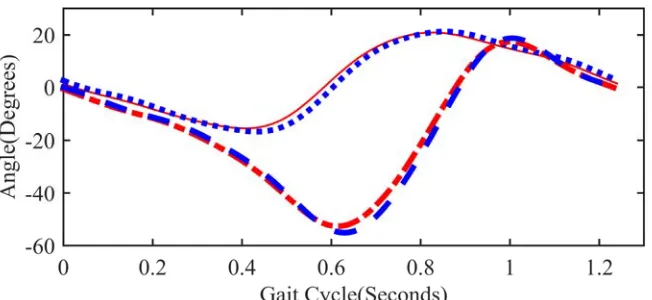
[image:7.612.133.468.415.564.2]The three test walks in Table 2 was separately defined as input test vectors of neural network, and comparison between the predicted results and the actual joint angle waveforms extracted by the image processing as shown in Fig. 5 - Fig. 7. Fig. 6 and Fig. 7 show that the actual joint angle waveforms and the predicted joint angle waveforms have good accuracy and coincide with each other. Fig. 5 shows some deviation, but the predicted joint angle waveforms begins with zero degree and the trend consistent with the movement in practice, therefore the GPPM could compensate the sampling error in practice.
Figure 6. Lower limb joint angle waveforms for walk-19.
Figure 7. Lower limb joint angle waveforms for walk-20.
Fig.5, Fig.6, Fig.7 (Solid lines-actual hip joint angle waveforms from experimental data, dotted lines-predicted hip joint angle waveforms by GPPM, dashdotted lines- actual knee joint angle waveforms from experimental data, dashed lines -predicted knee joint angle waveforms by GPPM)
Summary
The gait pattern planning plays irreplaceable role in robotic gait rehabilitation. In order to assist the gait disorders and correct the pathological factors in robotic gait rehabilitation, the precise gait pattern need real-time planning. In our work, the lower limb joint angle waveforms were expressed in the fifth-order Fourier series, and the GPPM of the subject was concluded from the trained GRNN and its efficiency and accuracy was demonstrated by the comparison experiment. Therefore any gait pattern planning to an individual-specific was achieved in our work. In order to realize any gait pattern planning to any body, experiment research should be continued based on this fundamental research.
Acknowledgement
This research was financially supported by Hebei Province Department of Education Foundation.
References
[2] Thom, Thomas, et al. Heart disease and stroke statistics—2006 update a report from the American Heart Association Statistics Committee and Stroke Statistics Subcommittee. Circulation 113.6 (2006): e85-e151.
[3] Zu-de, Zhou, et al. Practical velocity tracking control of a parallel robot based on fuzzy adaptive algorithm. Advances in Mechanical Engineering 5 (2013): 574896.
[4] Nef, Tobias, et al. ARMin-Exoskeleton for arm therapy in stroke patients. Rehabilitation Robotics, 2007. ICORR 2007. IEEE 10th International Conference on. IEEE, 2007.
[5] Barbeau, H., and S. Rossignol. Recovery of locomotion after chronic spinalization in the adult cat. Brain Research 412.1 (1987): 84-95.
[6] Johnson, Michelle J., et al. Development of adler: The activities of daily living exercise robot. Biomedical Robotics and Biomechatronics, 2006. BioRob 2006. The First IEEE/RAS-EMBS International Conference on. IEEE, 2006.
[7] Erol, Duygun, and Nilanjan Sarkar. Intelligent control for robotic rehabilitation after stroke. Journal of Intelligent and Robotic Systems 50.4 (2007): 341-360.
[8] Vallery, Heike, et al. Reference trajectory generation for rehabilitation robots: complementary limb motion estimation. Neural Systems and Rehabilitation Engineering, IEEE Transactions on 17.1 (2009): 23-30.
[9] Krishnan, Chandramouli, Edward P. Washabaugh, and Yogesh Seetharaman. A low cost real-time motion tracking approach using webcam technology. Journal of Biomechanics 48.3 (2015): 544-548.
[10] Qing-yun Meng, Shi-li Tan and Li-xing Shen. Normal human gaits based on image edge detection. Chinese Journal of Tissue Engineering Research 17.13 (2013): 2368-2374.
[11] Luu, Trieu Phat, et al. Subject-specific lower limb waveforms planning via artificial neural network. Rehabilitation Robotics (ICORR), 2011 IEEE International Conference on. IEEE, 2011. [12] Luu, Trieu Phat, et al. An individual-specific gait pattern prediction model based on generalized regression neural networks. Gait & posture 39.1 (2014): 443-448.
[13] Luu, Trieu Phat, et al. Subject-specific gait parameters prediction for robotic gait rehabilitation via generalized regression neural network. Robotics and Biomimetics (ROBIO), 2011 IEEE International Conference on. IEEE, 2011.
[14] Daachi, M.E., et al. A radial basis function neural network adaptive controller to drive a powered lower limb knee joint orthosis. Applied Soft Computing 34 (2015): 324-336.
[15] Schwartz, Michael H., Adam Rozumalski, and Joyce P. Trost. The effect of walking speed on the gait of typically developing children. Journal of biomechanics 41.8 (2008): 1639-1650.
[16] Chuang Zhao, Kai Liu, and Dian-sheng Li. Freight Volume Forecast Based on GRNN. Journal of the china railway society 26.1 (2004): 12-15.