2018 International Conference on Modeling, Simulation and Analysis (ICMSA 2018) ISBN: 978-1-60595-544-5
Optimization of Baja Racing Car Front Suspension
Parameters Based on ADAMS
Shu-hua LIAO,
Run-ming LU
*and Jiong LI
Guangxi University of Science and Technology, Liuzhou, China
*Corresponding author
Keywords:Baja racing car, Front suspension, Simulation, Optimization.
Abstract.In order to make the Baja racing car with better maneuvering stability, the ADAMS/Car module is used to build the front suspension structural model of the Baja racing car. Through the model simulation test, the influence of each positioning parameters of the suspension on the performance of the Baja racing car suspension is analyzed. The obtained results gradually optimize the position of each hard point. By optimizing each positioning parameter, the overall performance of the suspension is significantly improved, so that the racing car has good handling and stability. The method described in this article makes suspension optimization faster and more accurate.
Introduction
Baja SAE China, or BSC for short, is a college student SUV race sponsored by China Society of Automotive Engineer. The participating teams are required to create a small SUV that complies with the competition rules within one year according to the rules of the competition. The dynamics of the race include traction, winding, linear acceleration, control and endurance competitions [1]. The design of a good suspension has a significant impact on the vehicle handling stability of a car. Reasonable suspension positioning parameters can make the car have good kinematics and steering stability [3] [4]. In this paper, the coordinates of each hard-point of the front suspension are extracted from the UG digital model, and the front suspension system is modeled by ADAMS/Car module. Through the parallel wheel travel, and gradually change the coordinates of the hard points that affect the suspension positioning parameters gradually, so as to achieve the desired optimization results.
Selection of Front Suspension Structure and Establishment of Simulation Model
Figure 1. Front suspension simulation model.
Kinematic Simulation Analysis of Suspension
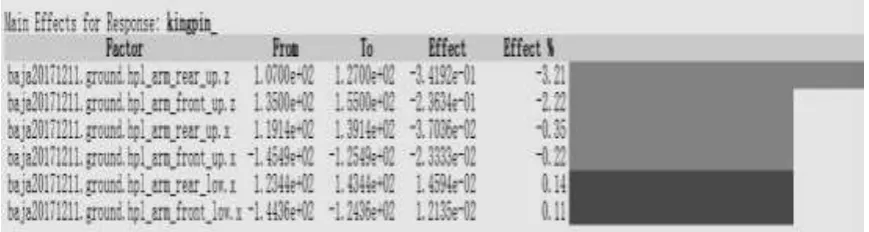
[image:2.595.120.476.71.256.2]Based on the design of dynamic and static deflection of suspension system, the upper and lower bounce heights of the wheels are respectively selected as +140mm and -70mm, with the help of ADAMS/Car module. Front suspension for a preliminary analysis. Due to the inconvenience of the structural design of the steering knuckle, the simulation test does not change the outer point of the upper arm and the lower arm, that is, fixes the kingpin inclination in the static state at first, so that the number of numerical iterations can be reduced and the design target can be closer to the design target Value, mainly consider the upper and lower arm of the front point, the rear point, a total of four coordinates of twelve coordinates, due to race car design rules and frame structure constraints, selected from the twelve coordinate values can provide changes The six coordinate values, i.e., the Z coordinate and X coordinate of the upper arm and the X coordinate of the lower arm and the X coordinate of the lower arm, ADAMS/Insight observes its influence on the suspension positioning parameters [7] as follows:
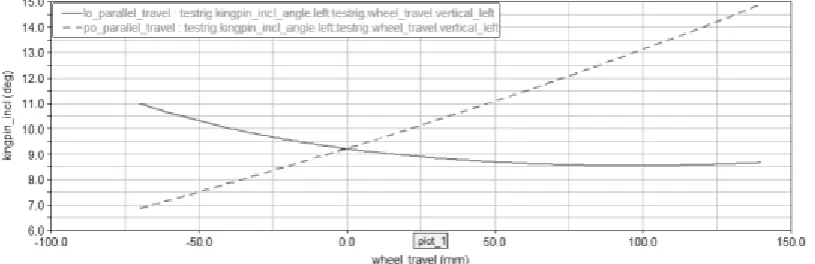
Figure 2. The influence coefficient of coordinates values on the kingpin incl. angle.
[image:2.595.81.516.496.612.2]Figure 4. The influence coefficient of coordinate values of the wheel camber angle
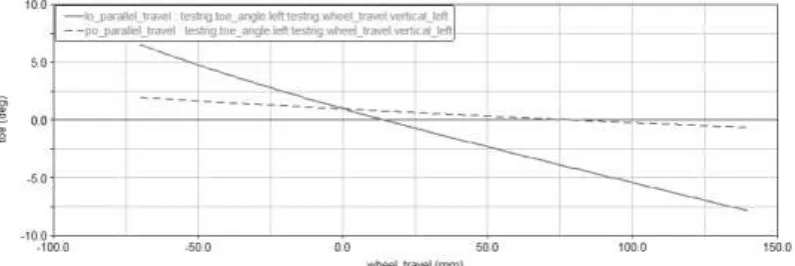
Figure 5. The influence coefficient of coordinate value on the toe angle.
Optimize the range of ±30mm for the coordinate values listed in Fig. 2 to Fig. 5. The coordinate values of the hardpoints before and after optimization are as follows:
Table 1. Hardpoints of before optimization and after optimization.
Hardpoint Before optimization After optimization
hpl_arm_front_low.x -130.357 -134.35
hpl_arm_rear_low.x 129.44 133.44
hpl_arm_front_up.x -130.4 -135.4
hpl_arm_front_up.z 170 145
hpl_arm_rear_up.x 125.2 129.2
hpl_arm_rear_up.z 145 117
Optimized before and after the front suspension of the positioning parameters of the range and trends as shown below:
[image:3.595.95.503.644.776.2]Figure 7. The curve of the toe angle change.
Figure 8. The curve of the camber angle change.
Figure 9. The curve of the caster angle change.
From Fig. 6 to Fig. 9, it can be seen that the variation range and trend of each positioning parameter before and after optimization and the optimized suspension positioning parameters meet the design requirements. The changes of positioning parameters of each suspension are more linear and more in line with the racing the actual conditions. Reasonable toe-in value and with the wheel when the beating up and down trends, can reduce and eliminate the wheel camber caused by the rotation and reduce tire wear. After the kingpin angle can make the front wheel steering automatically back to the king pin inclination is to make the steering more lightweight and steering wheel back, the wheel camber design is mainly to prevent the tire camber, and arched pavement [4]. During the race, the driver can drive in the direction given by the steering mechanism and can ease the interference of the road during traveling, maintain good driving stability, and the overall performance of the suspension has been significantly improved to achieve the expected goal of optimization.
Conclusion
vibration test bench of the module is used to make the same direction excitation simulation test. By modifying the coordinate values of the upper and lower control arm hard points, the goal of each positioning parameter optimization. The experimental results show that the change of each positioning parameter of the optimized suspension is more linear and more in line with the actual working conditions of the car. Compared with the parameters of the suspension before optimization, the optimized suspension positioning parameters can help to reduce the tire wear [6], help to improve the car's driving stability and handling stability. The optimized data was applied to last year's car race and achieved good results in the third place in the control race last year.
References
[1] Baja competition rules of China Society of Automotive Engineers [Z], China Society of Automotive Engineers, Beijing, 2017.
[2] Xiaofeng Wang, Car Chassis Design [M], Tsinghua University Press, Beijing 2010.4.
[3] Qiufang Zhao, Preliminary Study on Simulation Test of Vehicle Handling Stability Based on ADAMS [D]. Dalian University of Technology, 2006.
[4] Zhiqiang Ling, Analysis of Positioning Parameters Optimization of Front Suspension of a Vehicle Based on ADAMS [J]. Beijing Automotive, 2016 (06): 21-23 + 37.
[5] Jun Chen, Technology and Engineering Analysis [M], China Water Power Press, Beijing, 2008.
[6] Zhisheng Yu, Automotive Theory, fifth ed. [M], Mechanical Industry Press, Beijing 2009.3.