1
The$Impact$O
f"Repeated"Data"Breach"Events"On"
Organisations’+Market+Value
!
Daniel Schatz * and Rabih Bashroush§
* Thomson Reuters, London, UK.
Email: [email protected]
§ University of East London, London, UK.
Email: [email protected]
Abstract
Purpose – In this study, we examined the influence of one or more information security breaches on an organization’s stock market value as a way to benchmark the wider economic impact of such events.
Design/Methodology/approach – We used an event studies based approach where a measure of the event’s economic impact can be constructed using security prices observed over a relatively short period of time.
Findings – Based on the results, we argue that although no strong conclusions could be made given the current data constraints, there was enough evidence to show that such correlation exists, especially for recurring security breaches.
Research limitations/implications – One of the main limitations of this study was the quantity and quality of published data on security breaches, as organizations tend not to share this information.
Practical implications – One of the challenges in information security management is assessing the wider economic impact of security breaches. Subsequently, this helps drive investment decisions on security programmes that are usually seen as cost rather than moneymaking initiatives.
Originality/value – We envisage that as more breach event data become more widely available due to compliance and regulatory changes, this approach has the potential to emerge as an important tool for information security managers to help support investment decisions.
2
1
Introduction and related work
Protection of digital information has been and continues to be a growing concern across all areas of business. Cybersecurity-related attacks are not only increasing in number and diversity, but also becoming more damaging and disruptive (National Institute of Standards and Technology, 2012). Despite increasing efforts to implement security controls in an attempt to prevent information security breaches, we continue to see news of organisations suffering from incidents (Passeri, 2013). This study investigates the impact of security events on the stock price of publicly listed companies. As described by Cutler et al. (1989) asset prices are generally attributable to changes in the fundamental value of the asset and as such react to announcements about corporate control, regulatory policy and macroeconomic conditions that plausibly affect fundamentals. Under the assumption of an efficient market (Fama, 1970), and the rejection of the random walk hypothesis (Lo and MacKinlay, 1988), we assume that new information relevant to a traded equity becoming public knowledge has the potential to affect the market value of that equity (deBondt and Thaler, 1985, Fama et al., 1969). This assumption has been the focus of various studies as discussed below.
In this work, we particularly examine the impact of publicly reported information security incidents on the share price of organisations. Organisations store an ever increasing amount of information about their business partners, employees or customers and hold the responsibility to protect this data. At all stages of the data lifecycle – data collection, data use, data storage, data retention, data destruction – it must be ensured that sufficient protection is provided against unauthorized use (Grama, 2010). Yet we continue to see instances where this duty of care appears to fail as data is disclosed to unauthorized parties. While data breach is a widely discussed topic, there is little guidance in literature on the definition of a data breach. We are following the International Standards Organisation (2014) which defines a data breach to be a compromise of security that leads to the accidental or unlawful destruction, loss, alteration, unauthorized disclosure of, or access to protected data transmitted, stored or otherwise processed. In their cost of data breach study the Ponemon Institute (2014) finds a significantly higher monetary impact for those breaches caused by malicious or criminal attacks. Consequently, in our research we focus on information security breaches caused by external malicious or criminal attacks.
As it is notoriously difficult to obtain any information on direct or indirect cost resulting from an information security breach, a study of the market reaction to such an incident is the best proxy for economic consequences. A common approach for this is the use of event studies where a measure of the event’s economic impact can be constructed using security prices observed over a relatively short period of time (MacKinlay, 1997). At the core of an event study is the measurement of an abnormal stock return during the observation window. The observation window typically includes a time period leading up to the observed event, the event itself, as well as a post event period. The application of event studies in this form is well documented in academic research covering corporate events like earning announcements, stock splits (Fama et al., 1969) and mergers and acquisitions (Duso et al., 2010).
3 methodology to financial reporting data rather than public breach announcements. Telang and Wattal (2007) apply the methodology to a precursory event, announcement of software vulnerabilities, to observe the effect on stakeholders in this context. Andoh-Baidoo et al. (2010) extend event study results with decision tree induction to further examine the relationship between independent variables.
The following section highlights the research methodology used. Section 3 presents the research questions and hypothesis as well as the dataset used for validation. In section 4, the experiment conducted is described. Results are then discussed in section 5. The study limitations and potential threats to validity are covered in section 6. And finally, conclusions are drawn in section 7.
2
Research methodology
Measuring or even estimating the true impact of information security breach events on the economic wellbeing of organisations is a difficult problem to solve. Industry reports like the Ponemon study (Ponemon Institute, 2014) aim to approximate the cost taking various factors like expense outlays for detection, escalation, notification, after-the-fact (ex-post) response, analysis of the economic impact of lost or diminished customer trust and confidence as measured by customer turnover or churn, into consideration but also acknowledge limitations of their approach. A possible alternative developed in the field of economics is the event study methodology. Event study is a statistical approach relying on the assumption of efficient markets to identify abnormal returns resulting from an event. MacKinlay (1997) explains that the usefulness of such a study stems from the fact that, given rationality in the marketplace, the effects of an event will be reflected immediately in security prices. Although this relies on the assumption of an efficient or rational market, which is not without problems itself (Malkiel, 2003), the results produced are perceived to be a fair (non biased) ‘cause – effect’ approximation.
At the core of an event study is an asset measureable over time (e.g. valuation of equity) and an event that is suspected to affect the value of that asset. Practical issues like data availability for a chosen asset should be considered early on. Obtaining the necessary dataset to complete the study may be difficult (where data is not publicly accessible) or not feasible due to cost or resource constraints. To conduct a study, the time of the event must be defined and a time window constructed around it. This window includes a period leading up to the event (estimation window) to baseline expected or normal returns, a narrow event window, and a post event window to measure the impact. The selection of the event window needs to strike a balance between being too narrow, potentially missing leading or trailing reaction, and too broad, risking deluding results through confounding events and other long term event study issues (Kothari and Warner, 2004). With the basic requirements in place, the normal returns for the asset can be calculated throughout the estimation window followed by a calculation of the potential abnormal returns in the event window. Two common approaches for this are the constant mean return model and the market model. A detailed description of the model intricacies and varieties is out of scope for this paper. Further details on this can be found in Brown and Warner (1985) and Kothari and Warner (2004).
4 As mentioned in section 1, event study methodology has previously been applied to study the economic impact of information security events. The amount of available research remains limited compared to other areas, particularly considering the increasing interest in and prevalence of publicly reported information security breaches. This study aims to extend the existing research by investigating stock price reaction of organisations that have been affected by information security events more than once. The study seeks to answer two main research questions:
• RQ1: Do publicly reported information security breaches impact stock prices of affected organisations?
• RQ2: Is there a difference in stock price impact, compared to a previous breach of that organisation, if organisations experience a subsequent information security breach event?
These questions are formulated in two hypotheses:
H1 – Publicly reported information security breaches do not lead to abnormal returns for the
stock price of the affected organisation.
H2 – There is no difference in stock price reaction between the first measured breach event and a
subsequent breach event for an organisation
With the help of RQ2 we attempt to get an understanding of the reaction of market participants if the same organisation is breached repeatedly. We try to clarify whether investors penalise organisations in such cases (i.e. failure to provide tangible improvements on information security), show indifferent behaviour or even react positively.
5
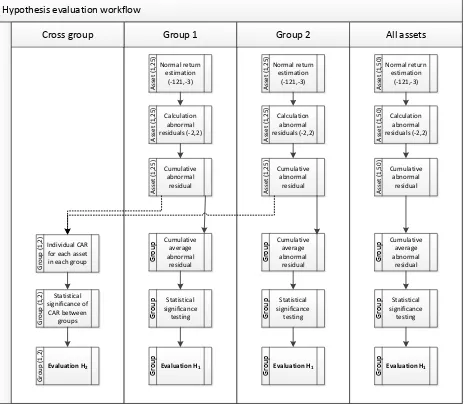
Hypothesis*evaluation*workflow
Group*1 Group*2 All*assets
Cross*group Normal*return* estimation (=121,=3) Calculation* abnormal* residuals*(=2,2) Cumulative* abnormal* residual Cumulative* average* abnormal* residual As se t*( 1, 25 ) G ro up As se t*( 1, 25 ) As se t*( 1, 25 ) Normal*return* estimation (=121,=3) Calculation* abnormal* residuals*(=2,2) Cumulative* abnormal* residual Cumulative* average* abnormal* residual As se t*( 1, 25 ) G ro up As se t*( 1, 25 ) As se t*( 1, 25 ) Statistical* significance* testing G ro
up significance*Statistical*
[image:5.612.75.541.77.481.2]testing G ro up Normal*return* estimation (=121,=3) Calculation* abnormal* residuals*(=2,2) Cumulative* abnormal* residual Cumulative* average* abnormal* residual As se t*( 1, 50 ) G ro up As se t*( 1, 50 ) As se t*( 1, 50 ) Statistical* significance* testing G ro up Evaluation*H1 G ro up Evaluation*H 1 G ro up Evaluation*H 1 G ro up Individual*CAR* for*each*asset* in*each*group G ro up *(1 ,2 ) Statistical* significance*of* CAR*between* groups G ro up *(1 ,2 ) Evaluation*H2 G ro up *(1 ,2 )
Figure 1 - Approach and workflow
6
3.1
Event data sample selection
For this study, the requirements on the underlying event data set are rather high as a simple selection of organisations that suffered from a security breach is insufficient to provide an answer on H2. Data sets available from the Open Security Foundation’s DatalossDBi and the
Privacy Rights Clearinghouseii have been considered. While the data available from DatalossDB is likely the most exhaustive repository available, its use for academic research is ambiguous due to copyright issues (Widup, 2012). On the other hand, the Privacy Rights Clearinghouse (PRC) data poses no such issue but is not as exhaustive and almost exclusively focused on US based entities. However, this limitation was not an issue for our work, and accordingly, the PRC dataset was chosen for our experiment.
The PRC database provides information on data breaches reported starting 2005 and up to date. These are categorized under various verticals such as: Business, Educational, Government and Military, Healthcare and Non-profit Organisations. Breach information is categorized under:
Unintended disclosure, Hacking or malware, Payment Card Fraud, Insider, Physical loss, Portable device, Stationary devices and Unknown or other. For this study, the full dataset for the Business category (i.e. excluding EDU, GOV, MED and NGO) was retrieved. The dataset was reviewed for repeat breaches and filtered for events classified as ‘HACK’, ‘DISC’ or ‘UNKN’. Other categories like ‘CARD’, ‘STAT’ or ‘PHYS’ were not considered due to the focus of this study being on information security breach events. The remaining 180 events were screened considering the following criteria:
• Public company listed at a stock exchange • Price data availableiii
• Not acquired, merged or ceased trading
• No overlapping event windows for repeated breaches or duplicate events • No notable confounding events close to event windowiv
Selection steps Records
Total events retrieved from PRC 1490
Events for organisations affected twice or more 409
Events categorised as DISC, HACK, UNKN 180
Events passing suitability criteria 50
Table 1 - Privacy Rights Clearinghouse data set
7
3.2
Price data selection
To calculate potential abnormal returns the stock price time series for each organisation in the event pool was required. Various sources for such information are available ranging from free services like Google Finance, Yahoo Finance to commercial providers like Bloomberg, Center for Research in Securities Prices (CRSP) and Thomson Reuters. Many previous studies prefer data provided by the Center for Research in Securities Prices (CRSP) whereas this study is using Thomson Reuters Datastream which is of at least comparable quality (Ince and Porter, 2006). To retrieve relevant time series data, the correct identifier for the equities in scope, as well as an appropriate time window was needed. The time window for price data was defined as 121 days before the event date and 30 days after. This time frame was chosen based on previous similar studies examining short horizon event effects utilising an estimation window (Dyckman et al., 1984, Patell, 1976).
This approach maximizes the estimation time window while avoiding overlap with an information security breach event affecting the same asset earlier in time. Due to the setup of this study, an extension of the pre event time window was not possible without introducing overlapping estimation windows between events.
To conduct analysis of the events following the ‘Market Model’ time series, data for Standards & Poors 500 Composite (S&PCOMP) was retrieved. The S&P 500 was selected as it is listed as the local market index (INDXL) for the majority of the assets in scope.
3.3
Data preparation and analysis method
Before conducting the analysis, sanity checks and some formatting had to be conducted over the collected data. Two data issues were investigated. The first is when events fell on non-trading days. The second is gaps (missing information) in the pricing data. Once checks were completed (using manual and too support), the raw data was formatted as Comma Separated Values (CSV) following a predefined layout.
To analyse the data, a standard Market Model methodology was chosen as per Dyckman et al. (1984). In that work, it was shown that the Market Model offers more powerful tests than the Mean-Adjusted Returns Model and the Market-Adjusted Returns Model in detecting abnormal performance. The Market Model is defined as shown in equation (1).
R
i,τ=
α
i+
β
i!
R
M,τ+
ε
i,τ!with!
E
ε
i,τ=
0!
and
!VAR
ε
i,τ=
σ
!!i! (1)WhereRi,τ andRM,τ!are defined as period returns for the asset and market respectively. Alpha (αi), beta (βi), variance (σ!i!) and prediction error (εi,τ) follow MacKinlay (1997).
8 The time windows of relevance were set as -121 to -3 days (estimation window) as explained in section 3.2 and -2 to 2 days (event window). We recognize that Dyckman et al. (1984) establish that extension of the event window has a disproportionally negative effect on the models ability to identify impact. However, an event window of 5 days (-2,-1,0,1,2) was chosen to account for any uncertainty around the event date. The uncertainty could emerge from many factors including the fact that security breach event dates are difficult to precisely pinpoint due to factors such as news dispersion and the speed of adjustment to the information revealed. This type of information typically follows a dispersion process starting with limited coverage (e.g. information security specific press) followed by wider coverage in technology outlets before it breaks to major news media outlets.
4
Experiment
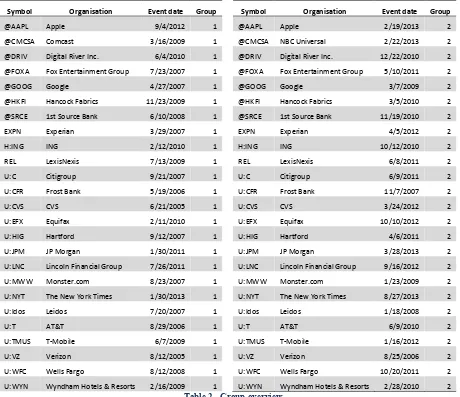
As outlined in section 3.1, the dataset covers 25 organisations with two associated security breach events each. The overall set of 50 events was separated in two groups where Group 1 contained the earlier event of each pair and Group 2 the later event.
Symbol' Organisation' Event'date' Group'
@AAPL% Apple% 9/4/2012% 1% @CMCSA% Comcast% 3/16/2009% 1% @DRIV% Digital%River%Inc.% 6/4/2010% 1% @FOXA% Fox%Entertainment%Group% 7/23/2007% 1% @GOOG% Google% 4/27/2007% 1% @HKFI% Hancock%Fabrics% 11/23/2009% 1% @SRCE% 1st%Source%Bank% 6/10/2008% 1% EXPN% Experian% 3/29/2007% 1% H:ING% ING% 2/12/2010% 1% REL% LexisNexis% 7/13/2009% 1% U:C% Citigroup% 9/21/2007% 1% U:CFR% Frost%Bank% 5/19/2006% 1% U:CVS% CVS% 6/21/2005% 1% U:EFX% Equifax% 2/11/2010% 1% U:HIG% Hartford% 9/12/2007% 1% U:JPM% JP%Morgan% 1/30/2011% 1% U:LNC% Lincoln%Financial%Group% 7/26/2011% 1% U:MWW% Monster.com% 8/23/2007% 1% U:NYT% The%New%York%Times% 1/30/2013% 1% U:ldos% Leidos% 7/20/2007% 1% U:T% AT&T% 8/29/2006% 1% U:TMUS% T`Mobile% 6/7/2009% 1% U:VZ% Verizon% 8/12/2005% 1% U:WFC% Wells%Fargo% 8/12/2008% 1% U:WYN% Wyndham%Hotels%&%Resorts% 2/16/2009% 1%
Symbol' Organisation' Event'date' Group'
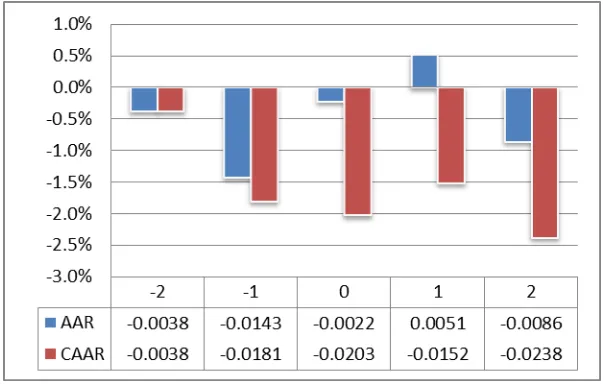
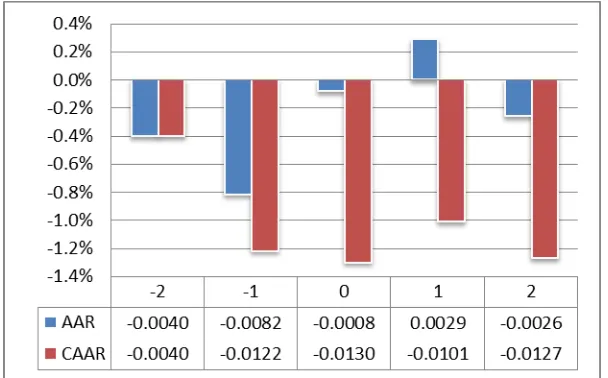
[image:8.612.73.533.316.713.2]9 First, calculations were conducted over events in Group 1 to obtain the results on the earlier breach data. As shown in Figure 2, the cumulative average abnormal residuals (CAAR) exhibit a decrease of 2.38% over the defined event window with a positive to negative ratio of 7:18.
Figure 2 - Group 1 event impact
Based on the standardized cross-sectional test following the BMP approach (Boehmer et al., 1991), with adjustments as proposed by Kolari and Pynnönen (2010), it was shown that the statistical significance is 1%. To verify the results of the parametric test, an additional non-parametric test was conducted. Following the observation by Cowan (1992) that the generalized sign test (GSIGN) becomes relatively more powerful as the length of the event window increases, the generalized sign test was selected over the rank approach as proposed by Corrado (1989). For Group 1, the GSIGN test does not confirm the parametric test results and merely approaches 5% significance level as seen in Table 3.
Event'window' CAAR' Pos':'Neg' BMP' BMP'p' GSIGN' GSIGN'p'
(`2...2)% `0.0238% 7:18% `2.9066% 0.0037% `1.8993% 0.0575%
Table 3 - Test results Group 1
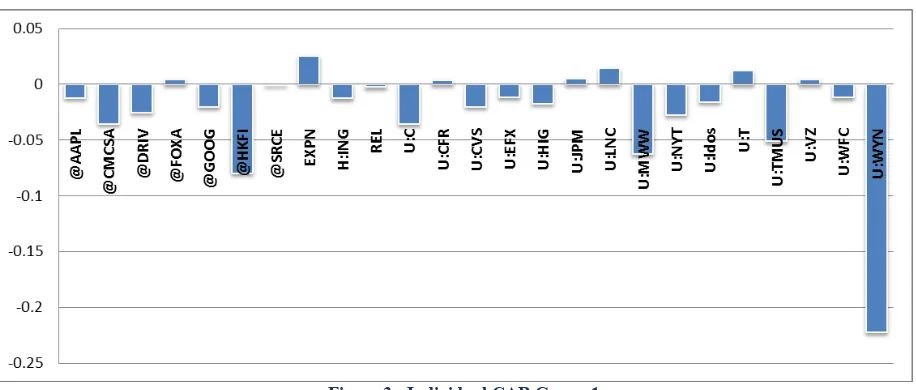
10 Figure 3 - Individual CAR Group 1
As normality of the data is not warrant, the strong significance level in the parametric test should be considered of limited relevance. Although non-parametric tests are not immune to outliers (Zimmerman, 1994) taking into consideration that the non-parametric tests approaches significance level, rejection of H1 seems likely.
[image:10.612.155.457.402.597.2]Calculations were repeated for the events in Group 2 using the same approach as above. The results of Group 2 are noticeably different to the observations of Group 1 showing a CAAR of only -0.16% with a flat AAR distribution around the event date as illustrated in Figure 4.
Figure 4 - Group 2 event impact
Looking at the statistical tests, there was no indication of significance in the results for Group 2, either for the parametric or non-parametric methods.
Event'
window' CAAR' Pos':'Neg' BMP' BMP'p' GSIGN' GSIGN'p'
(`2...2)% `0.0016% 9:16% 0.0213% 0.983% `1.1244% 0.2608%
11 As an additional verification, the individual CAR for each asset in the group was plotted. Figure 5 shows no outliers and exhibits a balanced dataset for Group 2.
Figure 5 - Individual CAR Group 2
The results for Group 2 show no statistical significance on any indicator, accordingly, rejection of H1 for this group cannot be concluded.
In addition to the calculations for each event group, the combined event data was analysed to obtain the results for the overall event pool. Taking all events into consideration, the CAAR showed a return of -1.27% carried by a 16:34 positive:negative ratio.
Figure 6 - Event impact for the complete event pool
[image:11.612.155.459.415.604.2]12
Event'window' CAAR' Pos':'Neg' BMP' BMP'p' GSIGN' GSIGN'p'
(`2...2)% `0.0127% 16:34% `1.3943% 0.1632% `2.138% 0.0325%
Table 5 - Test results complete event pool
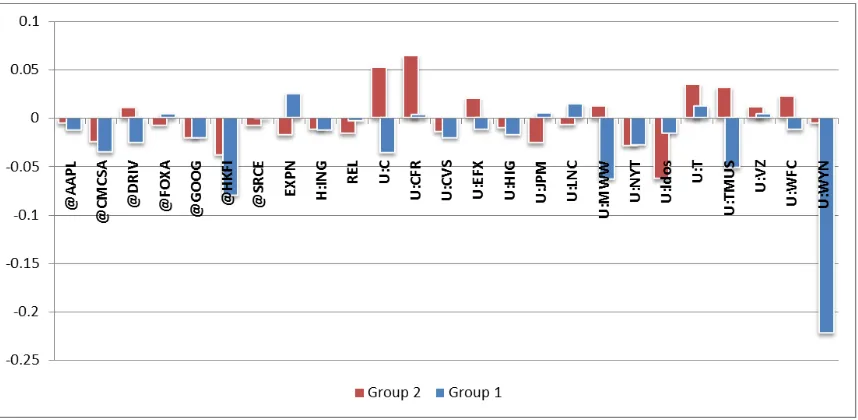
[image:12.612.75.504.180.390.2]The CAR for each individual asset in each group was plotted as seen in Figure 7 showing the reaction for each organization in the sample pool to both events in an overlay illustration.
Figure 7 - Combined CAR for the event pool
Considering the outlier problem, and subsequently the implications from parametric testing, the results of the non-parametric tests are given priority for reaching a conclusion on H1. Taking all
50 events into consideration, we identified a negative effect (-1.27%) over the observed event window which is considered significant with a p value < 0.05 (Pearson, 1900) as shown by the non-parametric test.
To answer the question posed by H2, the individual CAR for each asset in Group 1 are compared
13 Figure 8 - Box plot of individual CAR between groups
Comparing the CAAR for each group as calculated in the previous section, Group 1 showed a considerable stronger negative return (Group 1 -2.38%, Group 2 -0.16%); However, as noted earlier, this was driven by an outlier.
To better understand the impact of the identified outlier, we temporarily removed the outlier in Group 1 from the dataset. This resulted in a negative return of 1.55%. It also showed a tendency to normality, yet, indicated that there was still a noticeably stronger negative reaction for Group 1.
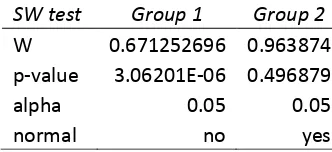
As discussed earlier, data in Group 1 is not normally distributed which reduces the usefulness of parametric testing. To understand the extent to which the data is non-normal, a Shapiro-Wilk (Shapiro and Wilk, 1965) test was applied to both groups. Results are shown in Table 6.
SW#test## Group#1# Group#2#
W% 0.671252696% 0.963874%
p`value% 3.06201E`06% 0.496879%
alpha% 0.05% 0.05%
normal% no% yes%
Table 6 - Shapiro-Wilk test
[image:13.612.220.386.494.570.2]14
5
Results
Observing the CAAR for study Group 1, we found a negative return of 2.38% aligned with the event date corresponding to a p value of 0.0037 using the standardized cross-sectional test as proposed by Boehmer et al. (1991). This result in the parametric test is likely driven by an outlier as described in section 4, however. The non-parametric result under generalized sign testing, on the other hand, finds significance approaching the 95% confidence level (p value = 0.0575). Considering the tendency of both test results we reject H1 for this group. For Group 2, we found
a CAAR that is very close to zero (-0.16%) with consequently insignificant statistical results. Applying the model to the whole event pool, we found a negative CAAR of 1.27% that showed significance on the non-parametric test (p value = 0.0325) but not on the parametric test (p value = 0.1632). The study shows a strong tendency towards rejection of H1.
H2 is addressed by comparing the cumulative abnormal residuals between group one and two.
Utilizing a Shapiro-Wilk test, we found data in Group 1 to be non-normal suggesting the use of a non-parametric test, such as Wilcoxon Signed-Rank, to conduct a statistical evaluation. Although the difference in absolute CAAR between Group 1 and Group 2 seemed to indicate that there is ground to reject H2, the statistical test did not support this initial notion. The Wilcoxon
Signed-Rank test showed only marginal significance (p value = 0.074) on the two-tailed test, which is considered insufficient to reject H2 in context of this study. Or in other words, we found merely
weak statistical evidence in this study that the market reacts differently to a subsequent breach event affecting the same organisation.
6
Threats to validity and study limitations
15 These potential issues, as well as the outlier in the sample pool, are magnified by the small sample size available for this study reducing the significance of statistical tests.
In terms of this study, the results can be seen as indication of impact tendency. While there were merely weakly explanatory results applying strict methodology, a tendency to significance could be identified, particularly if we only consider one tailed testing results.
7
Conclusion
Understanding the role of information security in context of the economic well-being of an organisation is a difficult yet important proposition (Anderson, 2001, Gordon and Loeb, 2002). Research in this area has been looking at existing approaches used by economists and applied promising methods in an attempt to answer questions on the economic value of information security. One such approach is the event study methodology as applied in this work. As discussed in section 1, we rely on the assumption of an efficient market to measure potential abnormal effects caused by an information security relevant event. In this study, we set to answer two main research questions:
• RQ1: Do publicly reported information security breaches impact stock prices of affected organisations?
• RQ2: Is there a difference in stock price impact, compared to a previous breach, if organisations experience a subsequent information security breach event?
To answer these questions, we retrieved event data from the PRC database, filtered it for relevancy, and matched the resulting 50 events with corresponding stock price and index time series information to conduct a market model event study.
The data were split into two groups. For the first group, consisting of each organisations earlier breach event, we found an indication of significant negative reaction (parametric p value = 0.0037, non-parametric p value = 0.0575). For the second group containing the latter events, there was no significant reaction (parametric p value = 0.98, non-parametric p value = 0.26). The combined event pool shows a tendency to significance based on the parametric test (p value = 0.1632) and non-parametric test (p value = 0.0325) findings.
Considering the limitations discussed, for RQ1, we weakly conclude that information security events have an impact on the economic well being of organisations, as expressed by the corresponding stock price based on the parameters of this study. For RQ2, we did observe a difference in reaction between the two study groups with a non-parametric test p value approaching significance (0.074).
16
8
Acknowledgments
We would like to thank the anonymous reviewers for their valuable input.
9
References
ANDERSON, R. Why information security is hard - An economic perspective. 17th Annual Computer Security Applications Conference, Proceedings, 2001 Los Alamitos. IEEE Computer Society, 358-365.
ANDOH-BAIDOO, F. K., AMOAKO-GYAMPAH, K. & OSEI-BRYSON, K. M. 2010. How Internet Security Breaches Harm Market Value. Security & Privacy, IEEE, 8, 36-42. BOEHMER, E., MASUMECI, J. & POULSEN, A. B. 1991. Event-study methodology under
conditions of event-induced variance. Journal of Financial Economics, 30, 253-272. BROWN, S. J. & WARNER, J. B. 1985. USING DAILY STOCK RETURNS - THE CASE OF
EVENT STUDIES. Journal of Financial Economics, 14, 3-31.
CAMPBELL, K., GORDON, L. A., LOEB, M. P. & LEI, Z. 2003. The economic cost of publicly announced information security breaches: empirical evidence from the stock market. Journal of Computer Security, 11, 431-48.
CAVUSOGLU, H., MISHRA, B. & RAGHUNATHAN, S. 2004. The effect of Internet security breach announcements on market value: Capital market reactions for breached firms and Internet security developers. International Journal of Electronic Commerce, 9, 69-104. CORRADO, C. J. 1989. A nonparametric test for abnormal security-price performance in event
studies. Journal of Financial Economics, 23, 385-395.
COWAN, A. R. 1992. Nonparametric event study tests. Review of Quantitative Finance and Accounting, 2, 343-358.
CUTLER, D. M., POTERBA, J. M. & SUMMERS, L. H. 1989. WHAT MOVES STOCK-PRICES. Journal of Portfolio Management, 15, 4-12.
DEBONDT, W. F. M. & THALER, R. 1985. Does the Stock Market Overreact? The Journal of Finance, 40, 793-805.
DICHEV, I. D. & JANES, T. D. 2003. Lunar cycle effects in stock returns. The Journal of Private Equity, 6, 8-29.
DIPIETRO, B. 2013. International Data Breach Laws Are All Over The Map [Online]. Available: http://blogs.wsj.com/riskandcompliance/2013/09/24/international-data-breach-laws-are-all-over-the-map/ [Accessed November 23rd 2013].
DUSO, T., GUGLER, K. & YURTOGLU, B. 2010. Is the event study methodology useful for merger analysis? A comparison of stock market and accounting data. International Review of Law and Economics, 30, 186-192.
DYCKMAN, T., PHILBRICK, D. & STEPHAN, J. 1984. A Comparison of Event Study Methodologies Using Daily Stock Returns: A Simulation Approach. Journal of Accounting Research, 22, 1-30.
17 FAMA, E. F., FISHER, L., JENSEN, M. C. & ROLL, R. 1969. The Adjustment of Stock Prices
to New Information. International Economic Review, 10, 1-21.
GARG, A., CURTIS, J. & HALPER, H. 2003. Quantifying the financial impact of IT security breaches. Information Management & Computer Security, 11, 74-83.
GATZLAFF, K. M. & MCCULLOUGH, K. A. 2010. The Effect of Data Breaches on Shareholder Wealth. Risk Management and Insurance Review, 13, 61-83.
GORDON, L. A. & LOEB, M. P. 2002. RETURN ON INFORMATION SECURITY INVESTMENTS: Myths vs Realities. Strategic Finance, 84, 26-31.
GRAMA, J. 2010. Legal issues in information security, Jones & Bartlett Publishers.
INCE, O. S. & PORTER, R. B. 2006. INDIVIDUAL EQUITY RETURN DATA FROM THOMSON DATASTREAM: HANDLE WITH CARE! Journal of Financial Research,
29, 463-479.
INTERNATIONAL STANDARDS ORGANISATION 2014. ISO/IEC DIS 27040 (Draft).
Information technology. London: BSI.
KANNAN, K., REES, J. & SRIDHAR, S. 2007. Market reactions to information security breach announcements: An empirical analysis. International Journal of Electronic Commerce,
12, 69-91.
KOLARI, J. W. & PYNNÖNEN, S. 2010. Event Study Testing with Cross-sectional Correlation of Abnormal Returns. Review of Financial Studies, 23, 3996-4025.
KOTHARI, S. & WARNER, J. 2004. The econometrics of event studies. In: ECKBO, B. E. (ed.)
Handbook of Corporate Finance: Empirical Corporate Finance. Amsterdam: Elsevier. LO, A. & MACKINLAY, A. 1988. Stock market prices do not follow random walks: evidence
from a simple specification test. Review of Financial Studies, 1, 41-66.
MACKINLAY, A. C. 1997. Event studies in economics and finance. Journal of Economic Literature, 35, 13-39.
MALKIEL, B. G. 2003. The efficient market hypothesis and its critics. Journal of Economic Perspectives, 17, 59-82.
NATIONAL INSTITUTE OF STANDARDS AND TECHNOLOGY 2012. Computer Security Incident Handling Guide. In: COMMERCE, U. S. D. O. (ed.) 2 ed. Gaithersburg.
PASSERI, P. 2013. 2013 Top 20 Breaches [Online]. Available:
http://hackmageddon.com/2013/12/30/2013-top-20-breaches/ [Accessed March 7th 2014].
PATELL, J. M. 1976. Corporate Forecasts of Earnings Per Share and Stock Price Behavior: Empirical Test. Journal of Accounting Research, 14, 246-276.
PEARSON, K. 1900. X. On the criterion that a given system of deviations from the probable in the case of a correlated system of variables is such that it can be reasonably supposed to have arisen from random sampling. Philosophical Magazine Series 5, 50, 157-175. PONEMON INSTITUTE 2014. Cost of Data Breach Study. Michigan: Ponemon Institute LLC. SCHOLES, M. & WILLIAMS, J. 1977. Estimating betas from nonsynchronous data. Journal of
Financial Economics, 5, 309-327.
SHAPIRO, S. S. & WILK, M. B. 1965. An Analysis of Variance Test for Normality (Complete Samples). Biometrika, 52, 591-611.
SMEDINGHOFF, T. J. 2006. Where we’re Headed–New Developments and Trends in the Law of Information Security. Wildman Harrold News & Publications [Online]. Available:
68ea2ad688c0/Presentation/PublicationAttachment/2e55edad-c12b-4e47-8df8-18
e31faee30d1b/Where_We're_Headed_-_New_Developments_and_Trends_in_the_Law_of_Information_Securit.pdf [Accessed 2013-11-20].
TELANG, R. & WATTAL, S. 2007. An empirical analysis of the impact of software vulnerability announcements on firm stock price. IEEE Transactions on Software Engineering, 33, 544-557.
WANG, T., REES, J. & KANNAN, K. 2007. Reading the Disclosures with New Eyes: Bridging the Gap between Information Security Disclosures and Incidents. Seventh Workshop on the Economics of Information Security. Hanover, NH.
WIDUP, S. 2012. Closing the Vault Door [Online]. Available:
http://theleakingvault.com/closing-the-vault-door [Accessed November 2nd 2013]. WILCOXON, F. 1945. Individual Comparisons by Ranking Methods. Biometrics Bulletin, 1,
80-83.
YAYLA, A. A. & HU, Q. 2011. The impact of information security events on the stock value of firms: the effect of contingency factors. Journal of Information Technology, 26, 60-77. ZIMMERMAN, D. W. 1994. A Note on the Influence of Outliers on Parametric and
19
1
Appendix A
List of organisation in the event study with business categories as provided by Thomson Reuters Business Classification.
Organisation TRBC L1 TRBC L2 TRBC L3 TRBC L4 TRBC L5
APPLE INCO. Technology Technology Equipment
Computers, Phones & Household
Electronics Computer Hardware Computer Hardware - NEC
COMCAST CORP.
Telecommunications Services
Telecommunications
Services Telecommunications Services
Integrated Telecommunications Services
Integrated Telecommunications Services - NEC
DIGITAL RIVER INCO. Technology Technology Equipment Computers, Phones & Household Electronics Computer Hardware Computer Hardware - NEC TWENTY-FIRST
CENTURY FOX Consumer Cyclicals Cyclical Services Consumer Media & Publishing Entertainment Production Entertainment Production - NEC
GOOGLE INCO. Technology Software & IT Services Software & IT Services Internet Services Search Engines
HANCOCK FABRICS
INCO. Consumer Cyclicals Cyclical Products Consumer Textiles & Apparel Textiles & Leather Goods Textiles & Leather Goods - NEC
1ST SOURCE CORP. Financials
Banking & Investment
Services Banking Services Banks Commercial Banks
EXPERIAN PLC. Industrials
Industrial & Commercial Services
Professional & Commercial Services
Professional Information
Services Financial Information Providers
ING GROEP NV Financials Insurance Insurance Life & Health Insurance Life & Health Insurance - NEC
REED ELSEVIER PLC. Industrials
Industrial & Commercial Services
Professional & Commercial Services
Professional Information
Services Journals & Scholarly Research
CITIGROUP INCO. Financials
Banking & Investment
Services Banking Services Banks Banks - NEC
CULLEN FO.BANKERS
INCO. Financials
Banking & Investment
Services Banking Services Banks Banks - NEC
CVS CAREMARK CORP.
Consumer
Non-Cyclicals Food & Drug Retailing Food & Drug Retailing Drug Retailers Drug Retailers - NEC
EQUIFAX INCO. Industrials
Industrial & Commercial Services
Professional & Commercial Services
Professional Information Services
Professional Information Services - NEC
THE HARTFORD
FNSR.GPIN. Financials Insurance Insurance Multiline Insurance & Brokers
Multiline Insurance & Brokers - NEC
JP MORGAN CHASE &
CO. Financials Banking & Investment Services Banking Services Banks Banks - NEC
LINCOLN NAT.CORP. Financials Insurance Insurance Life & Health Insurance Life & Health Insurance - NEC
MONSTER WORLDWIDE
INCO. Industrials Industrial & Commercial Services Professional Services & Commercial Employment Services Executive Search Services
NEW YORK TIMES CO. Consumer Cyclicals Cyclical Services Consumer Media & Publishing Consumer Publishing Consumer Publishing - NEC
LEIDOS HOLDINGS
INCO. Technology Software & IT Services Software & IT Services IT Services & Consulting IT Services & Consulting - NEC
AT&T INCO. Telecommunications Services Telecommunications Services Telecommunications Services Wireless Telecommunications Services Wireless Services - NEC Telecommunications
T-MOBILE US INCO. Telecommunications Services Telecommunications Services Telecommunications Services Wireless Telecommunications Services Satellite Service Operators
20
COMMUNICATIONS Services Services Services Services - NEC
WELLS FARGO & CO. Financials Banking & Investment Services Banking Services Banks Banks - NEC WYNDHAM
21
2
Appendix B
This table shows each event window test result calculated for each group. The event window considered for this paper (-2, 2) has been marked in grey for each group. Critical region findings (p value <= 0.05) have been highlighted as well.
! Date% CAAR% Pos%:%Neg% t/Test%time/series% Prob.% t/Test%cross/sectional% Prob.% Patell%Z% Prob.% Boehmer%et%al.% Prob.% Corrado%Rank% Prob.% Sign%Test% Prob.% Group%1%
! ! ! !! !! !! !! !! !! !! !! !! !! !! !!
1% (#2...2)! #0.0238! 7:18! #2.0969! 0.036! #2.4845! 0.013! #1.7782! 0.0754! #2.9066! 0.0037! #2.219! 0.0265! #1.8993! 0.0575! 1% (#2...1)! #0.0152! 8:17! #1.4958! 0.1347! #2.4563! 0.014! #1.333! 0.1825! #2.1033! 0.0354! #1.3769! 0.1685! #1.4986! 0.134! 1% (#2...0)! #0.0203! 7:18! #2.3077! 0.021! #1.8898! 0.0588! #1.8947! 0.0581! #2.6367! 0.0084! #1.8885! 0.059! #1.8993! 0.0575! 1% (#1...1)! #0.0114! 11:14! #1.2948! 0.1954! #1.9092! 0.0562! #0.9271! 0.3539! #1.6479! 0.0994! #0.8774! 0.3803! #0.2963! 0.767! 1% (#1...0)! #0.0165! 10:15! #2.2967! 0.0216! #1.4211! 0.1553! #1.5708! 0.1162! #1.8989! 0.0576! #1.4402! 0.1498! #0.6971! 0.4857! 1% (0...0)! #0.0022! 10:15! #0.4412! 0.6591! #1.0857! 0.2776! #0.359! 0.7196! #0.7612! 0.4466! #0.4568! 0.6478! #0.6971! 0.4857! 1% (0...1)! 0.0029! 11:14! 0.3989! 0.6899! 0.3894! 0.697! 0.1815! 0.856! 0.2807! 0.7789! 0.0426! 0.966! #0.2963! 0.767! Group%2%
! ! ! !! !! !! !! !! !! !! !! !! !! !! !!
2% (#2...2)! #0.0016! 9:16! #0.1577! 0.8747! #0.2767! 0.782! 0.0227! 0.9819! 0.0213! 0.983! 0.0274! 0.9782! #1.1244! 0.2608! 2% (#2...1)! #0.005! 10:15! #0.5601! 0.5754! #0.9685! 0.3328! #0.5036! 0.6145! #0.4451! 0.6562! #0.3886! 0.6976! #0.7238! 0.4692! 2% (#2...0)! #0.0057! 11:14! #0.733! 0.4636! #1.2464! 0.2126! #0.8033! 0.4218! #0.6786! 0.4974! #0.7437! 0.457! #0.3232! 0.7466! 2% (#1...1)! #0.0008! 11:14! #0.1005! 0.9199! #0.1686! 0.8661! #0.3988! 0.69! #0.3781! 0.7054! #0.0108! 0.9914! #0.3232! 0.7466! 2% (#1...0)! #0.0014! 14:11! #0.2288! 0.8191! #0.3337! 0.7386! #0.7601! 0.4472! #0.6704! 0.5026! #0.3745! 0.708! 0.8787! 0.3796! 2% (0...0)! 0.0006! 13:12! 0.1361! 0.8917! 0.1497! 0.881! #0.2323! 0.8163! #0.2261! 0.8211! 0.0506! 0.9597! 0.478! 0.6326! 2% (0...1)! 0.0013! 14:11! 0.2019! 0.84! 0.3165! 0.7516! 0.1074! 0.9145! 0.1253! 0.9003! 0.3971! 0.6913! 0.8787! 0.3796! Group%all%
! ! ! !! !! !! !! !! !! !! !! !! !! !! !!
All% (#2...2)! #0.0127! 16:34! #1.6773! 0.0935! #2.2105! 0.0271! #1.2414! 0.2145! #1.3943! 0.1632! #1.4204! 0.1555! #2.138! 0.0325! All% (#2...1)! #0.0101! 18:32! #1.4925! 0.1356! #2.4902! 0.0128! #1.2987! 0.194! #1.4068! 0.1595! #1.1954! 0.2319! #1.5714! 0.1161! All% (#2...0)! #0.013! 18:32! #2.2159! 0.0267! #2.2138! 0.0268! #1.9078! 0.0564! #1.9215! 0.0547! #1.8028! 0.0714! #1.5714! 0.1161! All% (#1...1)! #0.0061! 22:28! #1.0378! 0.2994! #1.5965! 0.1104! #0.9376! 0.3485! #1.1073! 0.2682! #0.5783! 0.563! #0.4381! 0.6613! All% (#1...0)! #0.009! 24:26:00! #1.8742! 0.0609! #1.441! 0.1496! #1.6482! 0.0993! #1.6228! 0.1046! #1.2257! 0.2203! 0.1286! 0.8977! All% (0...0)! #0.0008! 23:27! #0.241! 0.8096! #0.3597! 0.7191! #0.4181! 0.6759! #0.5274! 0.5979! #0.2576! 0.7967! #0.1548! 0.877! All% (0...1)! 0.0021! 25:25:00! 0.4328! 0.6652! 0.4985! 0.6181! 0.2043! 0.8381! 0.2632! 0.7924! 0.3352! 0.7375! 0.4119! 0.6804!
22
ihttp://datalossdb.org/
iihttp://www.privacyrights.org/data-breach
iii Data source – Thomson Reuters Datastream