BIROn - Birkbeck Institutional Research Online
Kingrani, Suneel Kumar and Levene, Mark and Zhang, Dell (2018) Estimating
the number of clusters using diversity. Artificial Intelligence Research 7 (1),
pp. 15-22. ISSN 1927-6974.
Downloaded from:
Usage Guidelines:
Please refer to usage guidelines at
or alternatively
ORIGINAL RESEARCH
Estimating the number of clusters using diversity
Suneel Kumar Kingrani, Mark Levene, Dell Zhang∗
Birkbeck, University of London, UK
Received:October 15, 2017 Accepted:December 6, 2017 Online Published:December 18, 2017 DOI:10.5430/air.v7n1p15 URL:http://dx.doi.org/10.5430/air.v7n1p15
A
BSTRACTIt is an important and challenging problem in unsupervised learning to estimate the number of clusters in a dataset. Knowing the number of clusters is a prerequisite for many commonly used clustering algorithms such ask-means. In this paper, we propose a novel diversity based approach to this problem. Specifically, we show that the difference between the global diversity of clusters and the sum of each cluster’s local diversity of their members can be used as an effective indicator of the optimality of the number of clusters, where the diversity is measured by Rao’s quadratic entropy. A notable advantage of our proposed method is that it encourages balanced clustering by taking into account both the sizes of clusters and the distances between clusters. In other words, it is less prone to very small “outlier” clusters than existing methods. Our extensive experiments on both synthetic and real-world datasets (with known ground-truth clustering) have demonstrated that our proposed method is robust for clusters of different sizes, variances, and shapes, and it is more accurate than existing methods (including elbow, Cali´nski-Harabasz, silhouette, and gap-statistic) in terms of finding out the optimal number of clusters.
Key Words:Clustering, Diversity
1. I
NTRODUCTIONClustering is an important unsupervised learning task aiming to group a collection of items into subsets (clusters) such that those within the same cluster are more closely related (similar) to each other than to those in different clusters.[1] For many commonly used clustering algorithms (such as
k-means,[1] k-medoids,[1] Gaussian mixtures,[2] and
spec-tral clustering[3]), it is necessary to specify beforehand the number of clusters, a parameter often denoted bykas ink -means/k-medoids, to run the algorithm. However, we often do not have prior knowledge about the correct choice ofk, and it is a very challenging problem to accurately estimate it by analysing the dataset itself only.[4–6]On one hand,
in-creasingkwill reduce the amount of error (in terms of data recovery[7]) in the resulting clustering, to the extreme case of full accuracy whenk =nthe total number of items in the dataset. On the other hand, decreasing kwill offer a
higher compression ratio, to the extreme case of maximum compression whenk= 1. The optimal choice ofk proba-bly lies somewhere in the middle ground, depending on the characteristics of the dataset such as its size, variance, and shape.
In this paper, we propose a novel diversity based approach to the problem of estimating the number of clusters in a dataset. A notable advantage of our proposed method is that it en-courages balanced clustering by taking into account both the sizes of clusters and the distances between clusters. In other words, it is less prone to “outlier” clusters (that are much smaller than most other clusters in the dataset) than existing methods. Such a property of clustering is usually desirable in practice. For example, when using a clustering algorithm to perform image segmentation,[8] a very small
cluster (segment) probably corresponds not to a complete meaningful object but only part of it, and therefore should
be avoided. For another example, when using a clustering algorithm to perform market segmentation,[9]a very small
cluster (segment) probably means that the market segment has too few customers to be profitable, and therefore should be discouraged. Obviously in some scenarios, small outlier clusters can be useful, e.g., for revealing exceptions or ab-normalities in the data. However, there are many real-world applications where balanced clusters are preferred, which is the focus of this paper.
The rest of this paper is organised as follows. In Section 2, we review well-known existing methods for determining the number of clusters in a dataset. In Section 3, we describe our diversity based approach to this problem in detail. In Section 4, we present the experimental results on a number of datasets and empirically compare our proposed method with the existing methods. In Section 5, we make concluding remarks and discuss the future work.
2. R
ELATED WORKThe problem of estimating the number of clustersk in a dataset has been studied extensively, and many different methods have been proposed by researchers from various disciplines.[10] In this section, we review a few representative ones.
2.1 The elbow method
The elbow method[11]examines the percentage of variance explained by the clustering as a function of the number of clustersk. If we plot the percentage of variance explained againstk, the first clusters will be able to explain a lot of vari-ance, but at some point the marginal gain will drop, giving an “elbow” in the graph. The optimalkis chosen at this point, as introducing more clusters would not give a better explanation of variance in the dataset, though such an “elbow” cannot always be unambiguously identified.[12] In this paper, we use a slight variation of this method which plots the curve of the intra-cluster variance:[13]
E(k) =
k
X
r=1
W(Cr) (1)
whereW(Cr)is the variance within ther-th clusterCr.
2.2 The Cali ´nski-Harabasz method
Milligan et al.[4] compared 30 different approaches to
es-timating the number of clusters in a dataset and found that the best performing method is given by Cali´nski and Harabasz:[14]
CH(k) =B(k)/(k−1)
W(k)(n−k) (2)
whereB(k) is the inter-cluster variance (i.e. the sum of squared distances for thekclusters), andW(k)is the intra-cluster variance. MaximisingCH(k)against different values ofkgives the estimated number of clusters.
2.3 The silhouette method
Rousseeuw et al.[15] proposed the silhouette method, of
which the main purpose is to examine whether an item i is classified well in the cluster or not. For every item or pointi, its silhouette is calculated as:
S(i) = b(i)−a(i)
max(a(i), b(i)) (3)
wherea(i)is the average distance of itemito all the items in the same cluster andb(i)is its average distance to all the items in the nearest cluster. Thei-th item is well clustered if the value ofS(i)approaches the maximum which is 1; and a
S(i)value 0 means that itemibelongs to the other cluster. After plotting the silhouette score averaged over all the items against different values ofk, the right number of clusters is estimated to be thekyielding the highest average silhouette score.
2.4 The gap-statistic method
Tibshirani et al.[16] proposed another method, gap-statistic,
which compares intra-cluster variance with the expected val-ues under the null reference distribution of the dataset. After clustering the dataset for different values ofk, we get the intra-cluster variance for the observed dataset as well as the reference dataset, and then calculate the gap-statistic as:
Gapn(k) =E∗n{log(W(k))} −log(W(k)) (4)
whereW(k)is the total intra-cluster variance and En∗{.}
denotes the expectation under a sample of sizenfrom the reference distribution. The gap-statistic measures the devi-ation of the observedW(k)value from its expected value under the null hypothesis.
3. O
UR APPROACH3.1 Rao’s quadratic entropy
The requirement of balance among clusters, in fact, implies that there should be no particular cluster dominating the dataset, i.e., there should be a certain level of diversity among clusters.
The concept of diversity, originated from ecology,[17] has
been widely diffused into many other scientific disci-plines[18, 19](such as linguistics and sociology). In recent years, a variety of quantitative measures of diversity have been successfully applied in computer science for web search,[20–24]text mining,[25]and recommender systems.[26]
Although there exist many different diversity measures (such as Simpson’s and Shannon’s) and it is debatable which diver-sity index is the best,[27, 28]we choose to use Rao’s quadratic entropy[29]to measure the diversity of data, because it takes
into account both the sizes of species (groups) and the dis-tances between species (groups). Rao’s quadratic entropy is defined as: Div= s X i=1 s X j=1
pipjδ(i, j) (5)
wheresis the number of species,piandpjare the
propor-tions of speciesiandjrespectively, andδ(i, j)is the distance between them. Euclidean distance is used throughout this paper, but other distance metrics could be used as well.
3.2 The diversity method
To find out the optimal number of clusters in a dataset with
nitems, we use the output of the given clustering algorithm (such ask-means) and then measure the difference between the global diversity of clusters and the sum of each cluster’s local diversity of their members, denoted byQ(k)and given by
Q(k) =DivG−
k
X
r=1
DivLr (6)
whereDivGis the global diversity ofkclusters (with each
cluster as a species) while DivL
r is the local diversity of
ther-th cluster (with each member item of the cluster as a species) as measured by Rao’s quadratic entropy given in Equation (5). We calculate the diversity based statisticQ(k) for various values ofk, i.e., forkfrom 1 ton, and the max-imum value ofQ(k)should be able to tell us the optimal number of clusters in the dataset, i.e.,
ˆ
k= arg max1≤k≤nQ(k) (7)
The underlying intuition of this diversity method is that in a
good clustering, the items within each cluster should be as homogeneous as possible (i.e., less local diversity), while the clusters themselves should be as heterogeneous as possible (i.e., more global diversity). The balance of cluster sizes is actually implied by a high level of diversity among clusters.
The approaches to estimating the number of clusters can be divided into two categories, global methods and local methods, as pointed out by Gordon.[30]The former evaluate
some measure over the entire dataset and optimise it as a function of the number of clusters; the latter consider indi-vidual pairs of clusters and decide whether they should be amalgamated.[16]Obviously the diversity method proposed
by us is a global method. According to Gordon,[30] most global methods suffer from a serious disadvantage that they are undefined for one cluster (i.e.,k= 1) and therefore cannot be used to determine whether the dataset should be clustered at all. It is worth mentioning that our diversity method does not have this shortcoming:Q(k)is well defined fork= 1, as we show later in Section 4.2.
4. E
XPERIMENTS 4.1 BalanceAs can be seen in Equation (5), Rao’s quadratic entropy takes into account the sizes of clusters and the distances between clusters, which is important to achievebalancedclustering desirable in many real-life clustering applications.
For the purpose of investigating the trade-off between the sizes of clusters and the distances between clusters, we first create two clusters from two 2-dimensional standard normal distributions which have 1,000 items each and are centred at (0,0) and (0,5) respectively, and then we create another clus-ter from one 2-dimensional standard normal distribution with varying number of items from 1 to 1,000 (i.e., we generate 1,000 different datasets). Following this, we move the third cluster’s centre(x, y)as follows: we keepyat 2.5 (halfway from the first cluster’s centre to the second cluster’s centre), and gradually increasexfrom 0 to+∞until the third cluster is detected by our proposed diversity method as a separate, third, cluster.
Figure 1.The trade-off between the sizes of clusters and the distances between clusters
4.2 Robustness
In this section, we investigate how robust our proposed di-versity method is when it is applied to different types of
datasets.
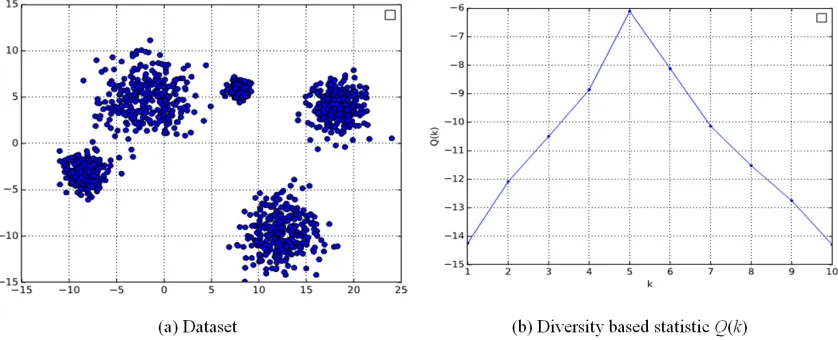
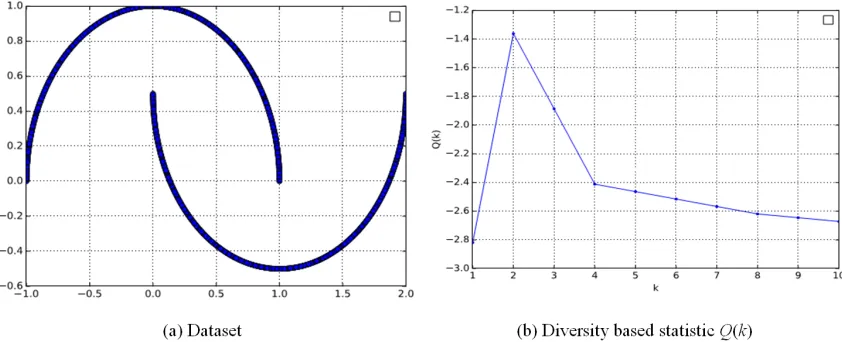
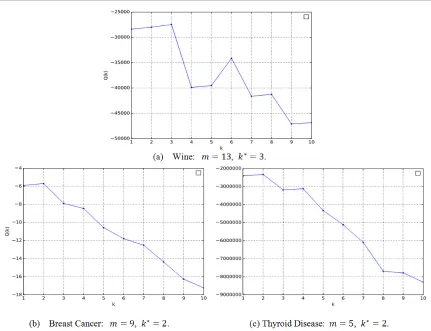
For this purpose, we create five synthetic datasets of differ-ent sizes, variances, and shapes. In addition, we also make use of three real-world datasets — Wine, Breast Cancer, and Thyroid Disease — from the UCI Machine Learning Repository.[31] On these synthetic and real-world datasets, we cluster the data points intokclusters withkfrom 1 to
n(usingk-means for the first three synthetic datasets and the first real-world dataset, but average-link hierarchical ag-glomerative clustering[32] for the remaining datasets), and calculate the value ofQ(k)for eachk. The actual number of clusters in the dataset is estimated to be thekthat maximises
[image:5.612.86.510.332.506.2]Q(k)(see Section 3). It can be seen from the experimental results in Figures 2-7 that for both synthetic and real-world data, no matter what size, variance, or shape the dataset has, our proposed diversity method can successfully discover the correct number of clusters.
Figure 2.Experimental results on the synthetic dataset of five clusters with equal sizes and equal variances
[image:5.612.90.509.543.713.2]Figure 4.Experimental results on the synthetic dataset of four clusters with different sizes and some random noise
Figure 5.Experimental results on the synthetic dataset of two ring-shape clusters
[image:6.612.102.523.537.708.2]Figure 7.Experimental results on three real-world datasets from the UCI Machine Learning Repository, wheremandk* are the number of features/dimensions and the actual number of clusters respectively in the corresponding dataset.
4.3 Comparison
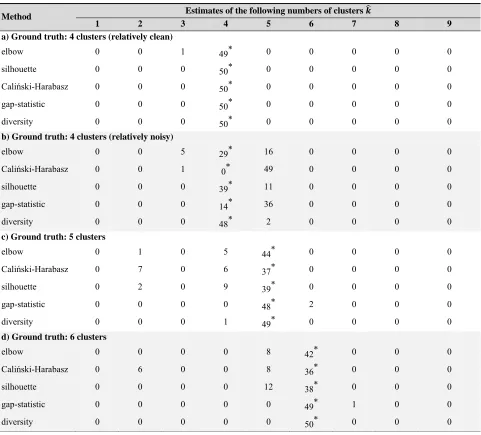
We use four synthetic datasets to evaluate the proposed diver-sity method and compare it with the other methods reviewed in Section 2, i.e., elbow, Cali´nski-Harabasz, silhouette, and gap-statistic. Note that the same experimental methodology was used by the gap-statistic paper.[16]
Those datasets are intentionally made to differ in the number of clusters, the number of dimensions, and the number of items. They are defined as follows.
• Four clusters in 2 dimensions; their sizes are 250, 250, 250, and 500 respectively; their centres are (1,3), (0,8), (8,0) and (4,-2) respectively.
• Four “normal” clusters and one small “outlier” cluster in 2 dimensions; the sizes of those “normal” clus-ters are 1,000, 900, 900, and 850 respectively while the size of that “outlier” cluster is randomly set to a number between 50 and 100; their centres are chosen randomly.
• Five clusters in 10 dimensions; their number of items are randomly set to either 50 or 100; their centres are chosen randomly.
• Six clusters with the same settings as in the previous case of five clusters except that the number of
dimen-sions is set to 4.
The items (data points) in each such cluster are all sampled from a particular standard multivariate normal distribution.
For each scenario defined above, we generated 50 concrete datasets so as to carry out 50 simulation trials. Then we used the chosen clustering algorithm to divide the generated dataset intokclusters withkvarying from 1 to 9. On the basis of the clustering results, we apply the diversity method and the other methods in comparison to make estimations about the actual number of clusters.
Table 1.Experimental results on the synthetic datasets showing how many times out of 50 simulation trials a particular method estimated the number of clusters to beˆk, where the column corresponding to the correct number of clusters is annotated with *.
Method Estimates of the following numbers of clusters
1 2 3 4 5 6 7 8 9
a) Ground truth: 4 clusters (relatively clean)
elbow 0 0 1 49* 0 0 0 0 0
silhouette 0 0 0 50* 0 0 0 0 0
Caliński-Harabasz 0 0 0 50* 0 0 0 0 0
gap-statistic 0 0 0 50* 0 0 0 0 0
diversity 0 0 0 50* 0 0 0 0 0
b) Ground truth: 4 clusters (relatively noisy)
elbow 0 0 5 29* 16 0 0 0 0
Caliński-Harabasz 0 0 1 0* 49 0 0 0 0
silhouette 0 0 0 39* 11 0 0 0 0
gap-statistic 0 0 0 14* 36 0 0 0 0
diversity 0 0 0 48* 2 0 0 0 0
c) Ground truth: 5 clusters
elbow 0 1 0 5 44* 0 0 0 0
Caliński-Harabasz 0 7 0 6 37* 0 0 0 0
silhouette 0 2 0 9 39* 0 0 0 0
gap-statistic 0 0 0 0 48* 2 0 0 0
diversity 0 0 0 1 49* 0 0 0 0
d) Ground truth: 6 clusters
elbow 0 0 0 0 8 42* 0 0 0
Caliński-Harabasz 0 6 0 0 8 36* 0 0 0
silhouette 0 0 0 0 12 38* 0 0 0
gap-statistic 0 0 0 0 0 49* 1 0 0
diversity 0 0 0 0 0 50* 0 0 0
5. C
ONCLUSIONSThe main research contribution of this paper is a novel diver-sity based approach to the problem of estimating the number of clusters in a dataset. To the best of our knowledge, the underlying connection between diversity and clustering has not been revealed before in research literature.
Specifically, we show that the difference between the global diversity of clusters and the sum of each cluster’s local diver-sity of their members can be used as an effective indicator of the optimality of the number of clusters, where the diversity is measured by Rao’s quadratic entropy. A notable advan-tage of our proposed method is that it encourages balanced clustering by taking into account both the sizes of clusters
and the distances between clusters. In other words, it is less prone to very small “outlier” clusters than existing methods.
Our extensive experiments on both synthetic and real-world datasets (with known ground-truth clustering) have demon-strated that our proposed method is robust to clusters of different sizes, variances, and shapes, and it is more accurate than existing methods (including elbow, Cali´nski-Harabasz, silhouette, and gap-statistic) in terms of finding out the opti-mal number of clusters.
It would be meaningful to explore the usage of diversity measures other than Rao’s quadratic entropy, which is left for future work. It would also be interesting to compare our approach to estimating the number of clusters with those
clustering algorithms that have built-in ability of detecting the number of clusters (such as DBSCAN,[33] OPTICS,[34]
and affinity propagation[35]).
A
CKNOWLEDGEMENTSWe thank the anonymous reviewers for their helpful com-ments.
R
EFERENCES[1] Hastie T, Tibshirani R, Friedman J. The Elements of Statistical Learn-ing: Data Mining, Inference, and Prediction. 2nd ed. Springer; 2009. [2] Xu L, Jordan MI. On Convergence Properties of the EM Algorithm for Gaussian Mixtures. Neural Computation. 1996; 8(1): 129-151.
https://doi.org/10.1162/neco.1996.8.1.129
[3] Ng AY, Jordan MI, Weiss Y. On Spectral Clustering: Analysis and an Algorithm. In: Advances in Neural Information Processing Systems (NIPS). Vancouver, Canada; 2001; 14: 849-856.
[4] Milligan GW, Cooper MC. An Examination of Procedures for Deter-mining the Number of Clusters in a Data Set. Psychometrika. 1985; 50(2): 159-179.https://doi.org/10.1007/BF02294245
[5] Salvador S, Chan P. Determining the Number of Clusters/Segments in Hierarchical Clustering/Segmentation Algorithms. Proceedings of the 16th IEEE International Conference on Tools with Artificial Intelligence (ICTAI). Boca Raton, FL, USA; 2004. p. 576-584. [6] Jain AK. Data Clustering: 50 Years Beyond k-Means. Pattern
Recog-nition Letters. 2010; 31(8): 651-666.https://doi.org/10.101 6/j.patrec.2009.09.011
[7] Mirkin B. Clustering: A Data Recovery Approach. CRC Press; 2012. [8] Coleman GB, Andrews HC. Image Segmentation by Clustering. Pro-ceedings of the IEEE. 1979; 67(5): 773-785.https://doi.org/ 10.1109/PROC.1979.11327
[9] Wedel M, Kamakura WA. Market Segmentation: Conceptual and Methodological Foundations. Springer; 2012.
[10] Hancer E, Karaboga D. A Comprehensive Survey of Traditional, Merge-Split and Evolutionary Approaches Proposed for Determi-nation of Cluster Number. Swarm and Evolutionary Computation. 2017; 32: 49-67.https://doi.org/10.1016/j.swevo.2016.0 6.004
[11] Thorndike RL. Who Belongs in the Family? Psychometrika. 1953; 18(4): 267-276.https://doi.org/10.1007/BF02289263
[12] Ketchen Jr DJ, Shook CL. The Application of Cluster Analysis in Strategic Management Research: An Analysis and Critique. Strategic Management Journal. 1996; p. 441-458.
[13] Goutte C, Toft P, Rostrup E, et al. On Clustering fMRI Time Series. NeuroImage. 1999; 9(3): 298-310.https://doi.org/10.1006/ nimg.1998.0391
[14] Cali´nski T, Harabasz J. A Dendrite Method for Cluster Analysis. Communications in Statistics. 1974; 3(1): 1-27.
[15] Rousseeuw PJ, Kaufman L. Finding Groups in Data. Wiley Online Library; 1990.
[16] Tibshirani R, Walther G, Hastie T. Estimating the Number of Clusters in a Data Set via the Gap Statistic. Journal of the Royal Statistical Society: Series B (Statistical Methodology). 2001; 63(2): 411-423.
https://doi.org/10.1111/1467-9868.00293
[17] Magurran AE. Ecological Diversity and Its Measurement. Princeton University Press; 1988.
[18] Stirling A. A General Framework for Analysing Diversity in Science, Technology and Society. Journal of the Royal Society Interface. 2007; 4(15): 707-719. PMid:17327202.https://doi.org/10.1098/rs if.2007.0213
[19] Page SE. Diversity and Complexity. Princeton University Press; 2010. [20] Clarke CLA, Kolla M, Cormack GV, et al. Novelty and Diversity in Information Retrieval Evaluation. Proceedings of the 31st Annual International ACM SIGIR Conference on Research and Development in Information Retrieval (SIGIR). Singapore; 2008: p. 659-666. [21] Denecke K. Chapter 6 Diversity-Aware Search: New Possibilities
and Challenges for Web Search. In: Web Search Engine Research. Emerald Group Publishing Limited; 2012: p. 139-162.
[22] Kingrani SK, Levene M, Zhang D. Diversity Analysis of Web Search Results. Proceedings of the Annual International ACM Web Science Conference (WebSci). Oxford , UK; 2015: p. 43:1-43:2.
[23] Santos RL, Macdonald C, Ounis I. Search Result Diversification. Foundations and Trends in Information Retrieval. 2015; 9(1): 1-90.
https://doi.org/10.1561/1500000040
[24] Zuccon G, Azzopardi L, Zhang D, et al. Top-k Retrieval using Facil-ity Location Analysis. Proceedings of the 34th European Conference on IR Research (ECIR). Barcelona, Spain; 2012: p. 305-316. [25] Bache K, Newman D, Smyth P. Text-based Measures of Document
Diversity. Proceedings of the 19th ACM SIGKDD International Con-ference on Knowledge Discovery and Data Mining (KDD). New York, NY, USA; 2013. p. 23-31.
[26] Castells P, Wang J, Lara R, et al. Introduction to the Special Issue on Diversity and Discovery in Recommender Systems. ACM Trans-actions on Intelligent Systems and Technology (TIST). 2014; 5(4): 52.
[27] Hurlbert SH. The Nonconcept of Species Diversity: A Cri-tique and Alternative Parameters. Ecology. 1971; 52(4): 577-586. PMid:28973811.https://doi.org/10.2307/1934145
[28] Jost L. Entropy and Diversity. Oikos. 2006; 113(2): 363-375.
https://doi.org/10.1111/j.2006.0030-1299.14714.x
[29] Rao CR. Diversity and Dissimilarity Coefficients: A Unified Ap-proach. Theoretical Population Biology. 1982; 21(1): 24-43.https: //doi.org/10.1016/0040-5809(82)90004-1
[30] Gordon AD. Null Models in Cluster Validation. In: From Data to Knowledge. Springer; 1996. p. 32-44.
[31] Lichman M. UCI Machine Learning Repository [Internet]; 2013. [cited 2017 Sep 22]. Available from:http://archive.ics.uci. edu/ml
[32] Manning CD, Raghavan P, Schütze H. Introduction to Information Retrieval. Cambridge University Press; 2008.
[33] Ester M, Kriegel HP, Sander J, et al. A Density-based Algorithm for Discovering Clusters in Large Spatial Databases with Noise. Proceed-ings of the 2nd International Conference on Knowledge Discovery and Data Mining (KDD). Portland, OR, USA; 1996: p. 226-231. [34] Ankerst M, Breunig MM, Kriegel HP, et al. OPTICS: Ordering Points
To Identify the Clustering Structure. Proceedings of the ACM SIG-MOD International Conference on Management of Data (SIGSIG-MOD). Philadelphia, PA, USA; 1999: p. 49-60.