Journal of Criminal Law and Criminology
Volume 21
Issue 2
August
Article 2
Summer 1930
Study of Arrests in Detroit, 1913 to 1919, A
Arthur Evans Wood
Follow this and additional works at:
https://scholarlycommons.law.northwestern.edu/jclc
Part of the
Criminal Law Commons,
Criminology Commons, and the
Criminology and Criminal
Justice Commons
This Article is brought to you for free and open access by Northwestern University School of Law Scholarly Commons. It has been accepted for inclusion in Journal of Criminal Law and Criminology by an authorized editor of Northwestern University School of Law Scholarly Commons.
Recommended Citation
A STUDY OF ARRESTS IN DETROIT, 1913 TO 19191
ARTHUR EVANS WOOD2
The following data aim to give a picture of the arrest situation in the city of Detroit for a seven year period, 1913-1919. The exposi-tion of the material gathered may be made by setting forth a series of questions the answers to which are to be found in the data.
I. UNDER WHAT CHARGES IS THE ToTAL VOLUME OF ARRESTS, MALE
AND FEMALE, DISTRIBUTED?
Seventeen main classifications of arrest charges were adopted with-in which fell the specific crimes named on the arrest cards. There were 186,662 male arrests, and 40,493 female arrests. TABLE I pre-sents the distribution of these total arrests, male and female, with per cents, in accordance with, first, the major classifications of. arrest charges; and, secondly, the specific crimes named within each major classification.
TABLE I
MAJOR AND MINOR CIssI ncATIoN OF ARREST CHARGES 1913-1919, SHownG
NuMBRs AND PERCENTAGE DiS BUTmON, BY SEXEs
Male - Female
Classification of 9 of %of % of % of
Arrest Charges Number Class Total Number Class Total
ALL CHARGES ... 186,662 100. 40,493 100.
Against Safety of State ... 6,669 100. 3.58 39 100. .096
Violating Conscription Law 85.
Conspiracy ... 5.1
Desertion ... 8.6
Alien enemy ... 2.1
Impersonating soldier or
of-ficer ... 1.7 5.1
Espionage ... 6 5.1
Sedition ... 7Z0
Desecration of the flag ... 12.8
'This study was undertaken initially by the Detroit Community Union and the Detroit Bureau of Governmental Research, each contributing 50% of its cost. The work was begun under the direction of .Mr. Arch Mandel and a committee of whom the present writer was a member. Mr. Mandel was then a member of the staff of te Bureau of Governmental Research, and is now Sec-retary of the Dayton Community Chest. The completion of the study in its present form is the work of the writer. The original data were taken from the arrest cards in the Record Bureau of the Detroit Police Department.2
ARRESTS IN DETROIT 169
Interfering with
Administra-tion of Justice ... 133 100. .07 67 100. .16
Perjury ... 32.4 65.8
Interfering with officer ... 25.5 26.8
Contempt of court ... 24.8 4.5
Resisting officer ... 8.3 1.5
Obstructing execution of law
for money ... 1.2
Concealment of crime.... 9
Aiding escave of prisoners. .6 1.5
Disorderly Conduct ... 70,904 100. .38.0 18,500 100. 45.71
Disorderly person ... 51.6 68.8
Disturbing the peace ... 41.5 14.5
Disorderly conduct ... 4.0 9.8
Disorderly acts ... 2.5 6.7
Loitering ... .6
Drunkenness ... 24,971 100. 13.4 2,095 100. 5.16
Begging and Vagrancy ... 5,707 3.07 739 100. 1.83
Begging ... 78.6 95.1
Vagrancy ... 21.4 4.9
Gambling ... 1,992 100. 1.07 10 100. *
Gaming ... 92.5
Operating gaming rooms... 6.9 50.0
Operating lottery ... 50.0
Violating Regulatory Statutes 17,652 100. 9.47 1,671 100. 4.12
Traffic laws ... 77.0 18.0
Drug law ... 4.3 9.8
Immiftration law ... 4.1 46.0
Interstate commerce law... 2.9 .8
Parole law ... 2.8 .8
Health law ... 1.5 9.3
Plumbing law ... IA 4.0
Food law ... 1.1
Labor law ... .. 8
Barber law ... 8
Selling to a minor ... .7
Postal law ... 1.3
Game law ... 2.3
Quarantine law ... 1A.
Medical law ... 2.1
Merchandise law ... .5
Violating Liquor Laws ... 1,440 100. 2.38 504 100. 1.25
Larceny ... 21,528 100. 11.53 5,206 100. 12.86
Petty larceny ... 50.3 71.7
Grand larceny ... 29.3 14.8
Driving away automobile... 9:3
Larceny from person ... 9.0 10.5
Attempt to drive away auto. .9 2.5
Attempt larceny from person .7
Larceny by Fraud ... 5,051 100. 2.72 1,269 100. 3.14
Embezzlement ... 18.6 1.6
Removing contract property 16.0 20.6
Receiving stolen property.. 14.7 6.5
False pretence ... 10.2 4.7
Violating U. S. Revenue law 7.6 32.3
Forgery ... 6.8 .9
Larceny by conversion ... 5.7 2.8
170 ARTHUR E. WOOD
Ultering and pubL bad
checks ... Defrauding hotel keeper .... Extortion ... Defrauding garage keeper.. Counterfeiting ...
White slavery ... Pandering ... House of ill fame (bawdy house) ... Contributing to delinquency
of female child ...
Adultery...
Indecent liberties wt e
male children ... Lewd and lascivious
cohab-itation ... Bigamy ... Assault to rape ...
122 11.1 9.0 8.6 6.1 4.6 3.5 12 .6 .3 325 10.6 .7 1.7 1.1 .4
Robbery (violence) and
Burg-lary (breaking and entering) 5,223 100. 2.80 857 100. 212
Breaking and entering ... 43.8 5.1
Robbery ... 28.8 22
Assault and robbery, armed 10.0 59.0
Burglary ... 72 .8
Assault and robbery
un-armed ... 4.5 24.0
Breaking and entering
rail-road car ... 1.6 10.4.
Robbery (attempted) ... 1.9
Attempt to break and enter .8 4.1
Robbery of bank ... .5
Assault (andcarryingweapons) 12,757 100. 6.86 1,316 100. 3.24
Assault and battery ... 58.0 54.4
Carrying concealed weapons 18.7 2.1
Assault, felonious ... 12.0 6.3
Cruelty to animals ... 4.9 22.4
Assault to do bodily harm.. 2.1 .8
Threats ... 1.2 10.1
Slander ... 1.1
To send or possess explosives
to do bodily harm ... 5 .5
Careless use of firearms .... .5
Kidnap or attempt t9 kidnap 1.2
Abortion ... .9
Homicide ... 1,033 100. .55 57 100. .14
Murder ... 41.5 42.0
Manslaughter ... 30.4 14.1
Assault to murder ... 25.3 21.8
Attempt to murder ... 1.8 6.3
Conspiracy to murder ... 1.0
Accessory after murder .... 1.0
Property Destruction ... 785 100. .42 122 100. .30
Malicious injury to property 82.4 87.7
Arson ... 12.9 2.5
Procuring to commit arlon. 1.9
Injury to tombs,, etc ... 1.8 9.8
Sex Offenses ... 3,188 100. 1.71 7,977 '100. 19.71
ARRESTS IN DETROIT
Prostitution ... 81.2
Seduction ... .5
Family Neglect ... 4,505 100. 2.42 18 100. .04
Non-support ... 95.6
Abandonment ... 3.5 89.0
Desertion ... .9
Family neglect ... 11.0
Miscellaneous ... 124 100. .06 46 100. .11
II. How DoES THE TOTAL VOLUME OF ARRESTS, AND THE VOLUME
WITHIN EACH SPECIAL CLASS OF ARREST, VARY WITHIN
THE SEVEN YEAR PERIOD, 1913-1919?
A summary answer to these questions is to be found in the fol-lowing discussion:
1. Total Arrests, 1913-1919.
Male Arrest, (186,662 for the whole period) increased from
20,323 in 1913 to 29,598 in 1919, the peak number being 36,336
or 19.5 per cent in 1917. The general increase within the period is partly accounted for by the increase in population of males over 17 years of age in Detroit during the period which wa3 from 198,772 tcl 330,709.3 The fluctuations within the period from year to year are undoubtedly affected by changes in police
policy as well as by changing'social conditions.
Female Arrests (40,493 during the period) increased from 2,110
in 1913 to 9,779 in 1919, the peak number or 24.1 per cent of total occurring in the last year. The female population over 17 years of age increased during this period from 176,055 to 296,082.4
2. Special Classes of Arrest.
(a) The-fluctuations, year by year, with reference to particular classes of arrest are of significance. Forj example, the 6,669 male arrests for crimeq against the "safety of the state" fell mostly within the year 1918, when there were 5,566 male arrests on this charge or 83.5 per cent of total. This crime, obviously, was oc-casioned by the War, as "violating the conscription law" con-stituted 85 per cent of all male crimes under this head. Female crimes under this general category were too few to be of signifi-cance.
(b) Arrests for crimes against the "administration of justice" were relatively few in number for both males and females, peak number for both sexes falling within the yer 1918. As seen from table I, perjury was the most frequent offense under this head.
aBased on estimates of the Detroit Board of Education. On this basis the per cent of male arrests of the total male arrestable population-increased during the period from 10 to 13 per cent.4
The per cent of female arrests based upon total female arrestable
ARTHUR E. WOOD
(c) Arrests for "disorderly" crimes bulk very large in the total num-bers for both sexes, there being 70,904 males, or 38 per cent of total male arrests, and 18,500 females, or 45.7 per cent of total female arrests, involved in this general category of crime. For both sexes the peak numbers for "disorderly" crimes fall within the year 1917. This fact may well reflect extraordinary police activity against the "floating" population of the city at the time of the draft. Aside from the probability of the influence of war conditions, other factors are at work to cause, for example, the percentage of women arrested on "disorderly" charges to drop over 10 per cent from 1917 to 1918, and then to increase over 10 per cent in 1919.
(d) On the charge of "drunkenness" 24,971 males were arrested
dur-ing the period, or 13.4 per cent of total number of male arrests; and on this charge were arrested 2,095 females, or 5.1 per cent of total female arrests. The percentage distribution during the seven year period of nearly 25,000 male arrests for "drunken-ness" is very uneven. It is year by year 1913-1919 as follows:
20.6, 5.9, 11.6, 14.4, 11.2, 11.9, 24.3. A high per cent of females
arrested on this charge occurred in 1913 (19.1); from then on there was a marked drop until 1919 when -it rose again to 17.7 in 1919. Shifting policies within the police department are doubt-less involved.
(e) For "begging and vagrancy" there were 5,707 males arrested
during the period 1913-1919. Sixty per cent of these arrests
occurred from 1913-1915; only 7 per cent the last two years,
1918-1919. Nearly half of the arrests of females on this charge
occurred in 1917.
(f) The violation of "regulatory statutes" involved 17,652 male
ar-rests during thel seven years, 77 per cent of such infractions coming under the head of traffic violations. The volume of these arrests was low until and during 1916. For some unascertained reason, possibly an increased number of municipal ordinances, or a more drastic enforcement, there was a two- to four-fold increase in male arrests for this cause during the last three years of the period. Female arrests for fhis cause were relatively few, and, such as there were, occurred mostly in the last three years.
(g) Violation of "liquor laws" resulted in 4,440 male arrests during the seven year period, and in only 504 female arrests. Ninety-one percent of the male arrests occurred in 1917, 1918 and 1919, presumably as a consequence of state and federal prohibition legislation.
(h) Crimes of "personal violence" occasioned the arrest of 12,757
ARRESTS IN DETROIT 173
the army, or made them otherwise give account of themselves at home.
(i) "Homicide" was the charge on which 1,033 males and 57 females
were arrested. The peak year for male arrests for homicide was in 1917, in which occurred one-fourth of all male arrests on this charge. Sixty-one percent of all male arrests for homicide fell within the years 1916, 1917, and 1918.
(j) Arrests for crimes of "property destruction" were relatively few
in numbers during this period. The peak year for male arrests for this cause was in 1916 and for female arrests, 1917.
(k) "Simple dishonesty" (or larceny) involved the arrest of 21,518
males, or 11.5 percent of all males arrested during the period; and 5,206 females were arrested for crimes under this head, or
12.8 per cent of all females arrested. The percentage
distri-bution for male arrests shows a steady increase up to the peak year of 1917, following which there is a distinct falling off. On the other hand, the peak year for female crimes of this order was 1919, when nearly one-third of all female arrests for this cause took place.
(1) "Fraudulent dishonesty" caused 5,051, male arrestg and 1,269
female arrests. Male arrests increased steadily up to the peak
year of 1917, after which they declined. Female arrests for
crimes of this character also increased up to 1917, there being a very sharp rise in 1916. After 1917, there was a slight decline in 1918; and then a very marked increase, such that over one-third of all female, arrests for crimes under this head occurred in 1919.
(m) "Dishonesty with violence" (robbery, robbery-armed, burglary, etc.) was the occasior of the arrest of 5,223 males and 857
females during the seven years. The male crimes under this
head were chiefly "breaking and entering". (43.8 per cent of total) and "robbery" (28.8 per cent of total). Three-fifths of female arrests in this general class were for "assault and robbery
armed." The percentage distribution of male arrests by years
showed an increase until 1917, after which there was a decline. Female arrests on charges under this head displayed an increase year by year until 1917, after which there was a decline, and and then in the last year a great increase. In fact one-half of the entire number of female arrests under this head fell in the year 1919.
(n) "Sex offenses" caused the arrest of 3,188 males and of 7,977
females during the period. Crimes under this head occasioned
19.7 per cent of all females arrested during the seven years. Bastardy, white slavery, and pandering were the chief types of sex offence among males; while prostitution and keeping a bawdy
house included 91.8 per cent of the female sex offenses. The
174 ARTHUR E. WOOD
(o) "Family neglect" (non-support, desertion, etc.) led to the arrest of 4,505 males and of only 18 females during the period. Of males arrested 95.6 per cent were on charges of non-support. The peak year for male offenses of this type was 1916. The war years, including 1919, showed a marked falling off.
(p) "Miscellaneous" or unclassified offenses were the cause of too few arrests to indicate anything of significance as to their year
by year distribution.
In relation to our answers to Question. II we present, in this connection a series of Charts, indicating the yearly trend for all male and female arrests during the period; the yearly trends for female arrests on charges of Sex Offenses; and the yearly trend for male arrests on charges falling under the special classifications of Safety of State, Administration of Justice, Regulatory Statutes, Property De-struction, Disorderly Offenses, Drunkenness, Begging and Vagrancy, Liquor Offenses, Simple Dishonesty (Larceny), Dishonesty with Vio-lence (Robbery, Burglary, etc.), Personal VioVio-lence, Not Homicide (As-saults, etc.), Homicide, and Family Neglect.
Prc
24
z/
/a
'5
/2 9 8
0
______ ________Lz
/zlz
__ __ __ __
I
__ __'3- 1'14 'ar/.
Ybacr
1917
-9000
-.3000
1919
ToTAL Aassr"s (FnEiAs)
_I
IY
__Z1-oo
/
fARRESTS IN DETROIT 175
p
Al ep celt
go -
6o-elf 6000
22 _____ _____S000
o -ooo
'a
16 -4000
/4
e -_-.000
/60
O0O
1 ,. 77/- 08 0
DiaumKmxss (MALES)
gon
39 ";600
93
-1/400
o
2J 'a
15
/Z
9 6
0
/9/as 'I4* '/5I "f6
Veqr *'17 - '/8 ?9.
LIQUoR OFFNRSs (MAEs)
Per Cent
33 ___
27 04 zi is
/6
12
9" a
o
"/5 "1M"7/
Ammismv~o oF Jus~rcE (MAL.ES)
1000
800 000 400
z00 0.
I93
176 ARTHUR E. WOOD
DISHONESTY WITH VIOLENCE (MALES)
.5 ' //6 1/5 '/7 '/8 /9
ROPERTY DESTRUcrI oN (MALES)
Poar H
PERSONAL VIOLENrCE (Nor HomiciDE) (MALES)
Pev- Cent
24 Z2
-/8 /4
/2
/0-
8-
4-
Z-/000
750
250
0
Ao
/0
6
4
2
0
Per Cent
/00
76
5O
o
Z5
0
2250
17S0
ARRESTS IN DETROIT
Po,- Cent
z1"
ld
Srum.u DsaomsY (MALEs)
Pa- Cent
161000
Ia I AZflflf
to
I
14
1_
_ _n
/.9/, /4 "" 1/6 1/7
)Year
DisRDm Oms (MAs)
1/8 119
Pet- COn
12
6
14/0
/913
FAmIY NEGL.cT (MALEs)
I/
/2000/1000
/0000 9000
8000
7000
0
740
- .o
-178 ARTIHR E. WOOD
SEX OFFENSES (FEiAEs)
/b. Cent
24 R2
zo- 200
I50
i00
50
0
Homic;DE (MALES)
Per Cent
3
-91 Is
3
0
'S 74 1IS "/6
77
Year
REGULAoRY STATUTES (MALES)
"/8 1/9
5000
4000
3000
000
o0o
/r
J"
jl - I
ARRESTS IN DETROIT 179
P. -e,'C, f . 5"5"00
/eI2 800
/0 700
9 600
a
7 500
6 400
4 -300
a -200
/ I/00
o _ _ _ _ _ _ _ _ _ _ o__
/sl 1/4 I/ S/8 " "IT "/0
roar
SAEmT, OF STATE (MALES)
Pw- Cen
/6 OO
~-~_-35000
/6*
______ £00
/2
II ..-
~'~---__.---
- -2 000/ /50000
o 0
/9/3 '/4 '/ '/98 /7" '/6 ",
TorAL ARREST (MAL.ES)
110
16 /-000
/4 solo
1_ __700
600
10 500
8 400
O 300
4 2 : 00
'- /00
01 0
/9/3 '/4 "5 '16 7 '/8 a 19
Kear
180 ARTHUR E. WOOD
III. WHAT IS THE FLUCTUATION WITHIN THE PERIOD AS REGARDS
THE RELATIVE IMPORTANCE OF EACH SPECIAL CLASS OF ARRESm?
In answer to this question the data are presented for male ar-rests only. We have the following, which gives the highest and low-est per cent that the arrlow-ests under each special classification constitute of the total yearly volume of male arrests:
Per cent
1. Safety of State ... .1 (1913)
2. Administration of Justice.. .0 (1913, 1919)
3. Disorderly ... 28.8 (1918)
4. Drunk ... 7.7 (1917)
5. Begging ... 3 (1919)
6. Vagrants ... 2 (1918)
7. Gambling ... .4.(1919)
8. Regulatory Statutes ... 2.1 (1913) 9. Liquor Offenses ... .3 (1915, 1916) 10. Simple Dishonesty ... 6.6 (1913) 11. Dishonesty by Fraud ... 2.2 (1918)
12. Dishonesty with Violence... 1.1 (1913)
13. Personal Violence ... 4.0 (1918)
14. Homicide ... .3 (1915)
15. Property Destruction ... .2 (1919) 16. Sex Offenses ... 1.3 (1919) 17. Family Neglect ... -1.1 (1919) 18. Miscellaneous ... Too few cases
Per cent 16.4 (1918)
.1 (other years)
42.9 (1914) 25.4 (1913)
5.2 (1914) 1.0 (1913, 1917) 1.7 (1914, 1915) 172 (1918)
5.2 (1919)
14.6 (1915)
3.5 (1914, 1915) 3.6 (1915) 10.1 (1914)
.7 (1916, 1917) .6 (1914, 1915; 1916)
2.2 (1916) 4.0 (1915)
IV.
WHAT WERE THE MONTHLY FLUCTUATIONS OF ARRESTS DURINGTHE PERIOD, BOTH AS TO TOTAL ARRFESTS AND FOR THE
SPECIAL CLASSIFICATIONS?
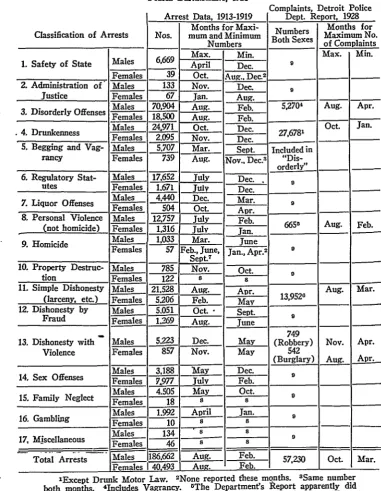
ARRESTS IN DETROIT
TABLE II
MONrHs OF MAXIMUM AND MINIMUM ARRESTS FOR SEViNTEEN MAJOR
CI.ASsI-FICATiONS OF ARREST CHARGES, 1913-1919, COMPARED wrrH MONTHS OF
MAXIMUM AND MINIMUM NuMEms OF COMPLAINTS OF CERTAIN
OFFENSES COMMITTED, ACCORDING TO REPORT OF DETROIT POLICE DEPARTMENT, 1928
Classification of Arrests
1. Safety of State
2. Administration of
Justice
3. Disorderly Offenses
4. Drunkenness
5. Begging and
Vag-rancy Males Females Males Females Males Females Males Females Males Females
Arrest Data. 1913-1919 Complaints, Detroit PoliceDent. Report. 1928
Months for Maxi- Numbers Months for
Nos. mumeand Minimum Both Sexes Maximum No.
______ Numbers Iot SeeI of Complaints
6,669 39 133 67 70,904 18,500 24,971 2.095 5.707 739 Max. April Oct. Nov. Jan. Aug. Aug. Oct. Nov. Mar. Aug.
6. Regulatory Stat- Males 17,652 July
utes Females 1.671 July
Males 4,440 Dec.
7. Liquor Offenses Females 504 Oct.
8. Personal Violence Males 12.757 July
(not homicide) Females 1.316 July
Males 1,033 Mar.
Females 57 Feb., June,
Sept7
10. Property
Destruc-tion
11. Simple Dishonesty
(larceny, etc.) 12. Dishonesty by
Fraud
13. Dishonesty with
Violence
14. Sex Offenses
Males Females Males Females Males Females 785 122 21,528 5.206 5.051 1.269
Males 5.223
Females 857
Nov. 8 Aug. Feb. Oct.-Aug. Dec. Nov. Min. Dec.
\ug.. Dec.2
Dec. Aug. Feb. Feb. Dec. Dec. Sept. ov.. Dec.5I
Dec. Dec. Mar. Aur. Feb. Jan. June Jan., Apr.2
Oct. 8 Apr. May Sept. June May May
Males 3.188 'May Dec.
Femail 7.977 Tlv IFeb.
P Max. Aug. Oct. Apr. Jan.
Aug. Feb.
Aug. Mar.
5,2704 27,6781 Included in "Dis-orderly" 9 9 66515 9 9 13,9520 9 749 (Robbery) 542 (Burglary) Apr.
Males 4.505 May Oct.
15. Family Neglect Females 18 8 8
16. Gambling Males 1.992 April Jan. 9
Females 10 s 8
Males 134 8 8
17, Miscellaneous - - 9
__________________emales 46 88
Total Arrests Males 186,662 Aug. Feb. 57,230
Females I 40,493 Aug. Feb.
'Except Drunk Motor Law. 2None reported these mQnths. 8Same number
both months. 4Includes Vagrancy. 5The Department's Report apparently did
not include here non-felonious assaults which were included in the Arrest Data. eNot including Auto thefts of which there were 8,364 with a high point in
October and a low point in March. 7Same number all three months. sToo few
Nov.
[image:15.431.26.408.119.611.2]182 ARTHUR E. WOOD
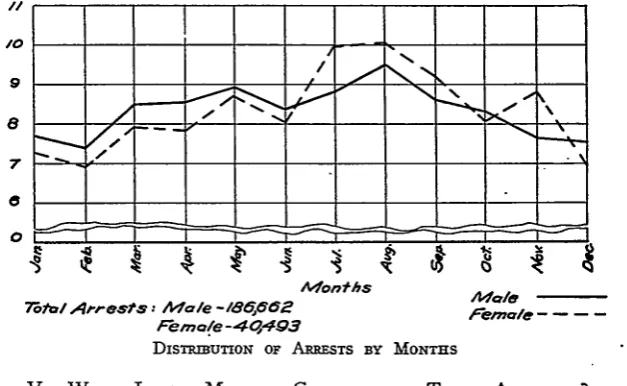
As will be seen from an examination of TABLE II in the arrest data for 1913-1919 the high and low months for total arrests for both males and females are August and February, respectively; while for the complaint data in 1928 the high and low months for total complaints are October and March, respectively. The totals in both cases are, of course, affected by the monthly distribution for particular classes of arrests and complaints. Let us, then, see how the distribution falls for some of these classes.
89,404 arrests on "disorderly" charges, including both males and females, have their maximum and minimum numbers in August and February, respectively, while 5,270 complaints of "disorderly conduct and vagrancy" have maximum and minimum numbers in August and April. "Begging and Vagrancy" in the arrest data have maximum and minimum numbers for males in March and September; but the arrests on this charge are relatively few as compared with those for "disorderly offenses." In other words, the incidence of arrests and complaints on "disorderly" charges for the two periods considered, 1913-1919 and 1928, is nearly the same.
Male "drunkenness" (24,971 in seven years) had the highest in-cidence for arrests in October and lowest in December; female arrests (2,095 in seven years) on this charge are highest in November and lowest in December. Complaints (27,678 in 1928) for both sexes on this charge are highest in October and lowest in January. Again, this closely approximates the distribution of arrests.
Male arrests (12,757 in seven years) on charges of "personal violence," not including "homicide," have high and low points in July and February; female arrests on these charges are high in July and low in January. 665 complaints for "aggravated assault" (felonious) in 1928 for both sexes are highest in August and lowest in February.
Over half the arrests on these charges during seven years were for non-felonious forms of "personal violence" (assault and battery). This makes the arrest and complaint data on these charges, strictly speak-ing, non-comparable. What the foregoing distribution shows is that
the arrests on charges of "personal violence" (felonious and
non-felonious) for a period of seven years indicate high and low points as to their monthly occurrence nearly similar to those for complaints in 1928 -for felonious forms of personal violence.
26,734 arrests (21,528 male and 5,206 female) 1913-1919, under
the general head of "simple dishonesty" are compared with 13,952
complaints of "larceny" (male and female) from the Report of the
num-ARRESTS IN DETROIT 183
bers of male arrests on these charges fall in the months of August and April; of female arrests in February and May. Complaints of "lar-ceny" (both sexes) 1928, have their maximum number in August, and their minimum number in March. Considering that male arrests are over four times the number of" female arrests on "simple dishonesty" charges, it is clear that the fluctuation of these charges is about the same for both arrests and complaints. Indeed, combining male and female
arrests for "simple dishonesty" gives the same maximum and
mini-mum incidence that is found for male arrests alone, namely, August and April. "Auto thefts" are separately classified in the complaint data, but are included with other "simple dishonesty" offenses in the
arrest data. The high and low months for complaints of "auto thefts"
are October and March.
"Dishonesty with violence" (burglary, robbery, etc.) has the most numerous arrests for males in December, and least number for males in May. Female adrests on this charge have a maximum number in November and a minimum number in May. Combining numbers for male and female, we find that the maximum and minimum numbers fall in the same months as these for males alone, namely, December and May. In the complaint data for crimes of this character we find that for both sexes "robbery" has high and low incidence in November and April, respectively; and "burglary" has a high and low incidence for complaii ts in August and April. Combining "robbery" and "burg-lary" complaints we find that the maximum complaints bn both charges occurs in November, and the minimum number in April. Again, on these charges the arrest and complaint data compare rather closely.
It will occur to the reader that the varying number of days in the month may conceivably have affected the monthly distribution of arrests as presented in the account given above. To check upon this possibility the total number of arrests for each month during the whole period, 1913-1919 was divided by the number of days in each month, respectively. The resulting quotients throws the low number for male arrests from February back into December, with only a very slight increase for January; but thereafter the trend is the same as if the differing lengths of the months had not been taken into account. That is to say, as far as these arrest data are indicative, the total vol-ume of arrests in Detroit begin at a relatively low point at the be-ginning of the year, or at the end of the previous year, rising, month
by month, until the middle of the year is reached, when there is a slight
184 ARTHUR E. WOOD
been presented showing a somewhat similar trend in the complaint data from the Detroit Police Department for a single year.
A Chart is herewith presented showing the monthly distribution of total male and female arrests for the seven year period.
The writer offers no explanation for this course of events as regards arrests. Such an attempt would involve one in a study of the shifting sociological and economic conditions from season to season in Detroit; and it would also involve a study of the shifting policies of the Police Department. Sufficient is it here to quote from the 1928 Report of this Department where it is stated in connection with the table of monthly distribution of complaints (Table IV A, page. 12). "This information is valuable in arranging vacation periods for the force."
/0/
7 _
Alon#hs ol
75tal Arests, Mole -186662 F1m6le .... F-emale -4Q493
DismiBunoN oP ARREsTs BY MoNTHs
V. WHAT IS THE MARITAL CONDITION OF THos. AR_.sTED?
Data as to the marital condition of those arrested indicates that of 186,662 males arrested 38.1 per ceit were married and 61.5 per cent were unmarried. Of 40,493 females arrested 42.8 per cent were
married, and 56.8 per cent were unmarried. This distribution for
marital status, however, varies with 15articular offenses. For example,
[image:18.431.48.362.252.445.2]ARRESTS IN DETROIT 185
arrested on this charge there is a much higher per cent of married women, namely, 56.1 per cent. For other arrest charges the distribu-tion as to marital status of offenders is somewhat as follows: married males predominate among those males arrested for "liquor offenses," "personal violence" (not homicide) and "fraudulent dishonesty." Un-married males predominate among males arrested for "property de-struction," "simple dishonesty," "dishonesty with violence ... sex of-fenses," and "gambling." Males arrested for violating "regulatory statutes" and for "homicide" are about evenly divided among the mar-ried and unmarmar-ried. Of females the larger proportion are marmar-ried who are arrested for violating "regulatory statutes," "liquor offenses,"
"personal violence" (not homicide), "homicide," " simple dishonesty," and "fraudulent dishonesty"; while there are more unmarried than married females among those arrested for "dishonesty with violence"
and for "sex offenses." The small numbers of females arrested for "property destruction" are about evenly divided among the married and unmarried.
A Chart indicating the marital condition of those arrested is here-with presented.
MA
L
ES
0 2S 610 7S /00
186 ARTHUR . WOOD
FEMALES
.K///!//,// /A
.,..
0
2. so 7S VoTO
ta
l
rrests - -04193
Mot Given
I
ARVETS CLAssnFm nY SocAL CoNDrmoN
VI. WHAT Is THE AG, DISTRIBUTION OF PERSONS ARR smn?
A summarized answer to this question is presented in what follows,
data for which are drawn from basic tables, and are presented separ-ately for Whites and Negroes:
WHITES
1. For total arrests of white males and females the age group 20-30 includes the highest percentages, the same being 44.1 per cent for the former, and 55.4 for the latter respectively. Males are a little more evenly distributed, having larger percentages in the age groups under 20, and 30 and over, than females.
.2. Particular arrests show a different distribution from total arrests as to age. For example, on the following charges the peak distribution as to age falls above the period 20-30:
"drunk" has the largest percentage for males and females in the age group 40-70, being 38.2 per cent for the former, nd 36.2 per cent for the latter respectively.
"beggars and vagrants" have the largest percentages in age group 40-70, the same being 40.1 per cent for males, and 29.5 per cent for females.
"liquor" offenses for males are concentrated in the age period 30-40 with 39.9 per cent of all male arrests on this charge. "homicide" and "property destruction" among females have highest
percentages in the age group 30-40 with 39.9 per cent for the former and 39 per cent for the latter.
ARRESTS IN DETROIT
For males,
"disorderly conduct," 10.2 per cent; "regulatory statutes," 14.5 per cent; "property destruction," 10.1 per cent; "simple dis-honesty," 18.7 per cent; "dishonesty (with violence)," 22.6 per cent; and "Miscellaneous," 20.5 per cent. These are the offenses which contribute most largely to the 15,977 white male arrests of persons under 20 years of age.
For females,
"Safety of State," 13.2 per cent; "administration of justice," 15.6 per cent; and "beggars and vagrants," 13.3 per cent.
NEGROES
1. Total arrests for negroes are even more heavily concentrated in
the age group 20-30 than white arrests, with 48.8 per cent for males and
72.9 per cent for females in this group. As in case of the whites, negro
male arrests are somewhat more evenly distributed among the different age groups than negro female arrests.
2. All arrest charges among negro females have the highest
per-centages in the age group 20-30; but among negro males the arrest charges for "drunk," "beggars and vagrants" and "family neglect" have their
highest percentages in the age group 30-40. Moreover, among negro
.females four arrest charges show relatively high percents in this age grbup.
3. Though no negro arrests for any cause have their highest
per-centages in the age group 40-70, yet the following offenses show relatively .high rates in this group:
For males,
"drunk," 34.6 per cent; "beggars and vagrants," 28.1 per cent; "liquor," 21.4 per cent.
For females,
"beggars and vagrants," 22,8 per cent.
4. Arrest charges among negroes that show relatively high per-centages in the age group under 20 are
"beggars and vagrants" (female), 17.5 per cent. "property destruction" (female), 11.8 per cent. "dishonesty with violence" (female), 12.9 per cent. "regulatory statutes" (male), 11.9 per cent. "simple dishonesty" (male), 12.4 per cent. "dishonesty with violence" (male), 14.5 per cent.
The differences that obtain between whites and negroes in regard to the age distribution for arrests are undoubtedly affected by the differences in age distribution for these two groups in the general population.
188 ARTHUR E. WOOD
ARRESTS OASSIFIED By AGE
W'rms
60
so
/
15 /0
S"
P -en t
C/nder a 0 zto30 ) ors 0 to40 of A~e
Thoa/ Arrevts: Male - 10 685 ,Fe male - Z 9,7/l9
COLORED percent
-40fO . Mand GVvP
Mqle
Jlemo'e --
--7z 60
54
so
so..
7ot/ Arreset:
}barsr ofAge
Male- 6;550
,Female -073/ Fe0,male
--VII. Is THE AGE OF THOSE ARRESTED FOR SERIOUS CRIMES BECOMING
GENERALLY YOUNGER?
One hears sometimes that it is. For the purpose of throwing. some light on the question a comparison was made of the age distribu-tion of those arrested for robbery and burglary in Detroit for the
v
ARRESTS IN DETROIT 189
period 1913-1919 and for the single year of 1928. This comparison is set forth in the following table:
TABLE III
AGE DIsRIBuTIoN FOR MALES ARREsTED FOR ROBBERY AND BURGLARY IN DETRoIT, 1913-1919 AND 1928
Total No. Age Distribution
Arrested Per Under 20 20 to 29 30 to 39 40 & over
Period (Males) Cent No. 9 No. % No. % No. %
1913-1919 4397 100 994 22.6 2358 53.6 795 18.1 250 5.7 1928 '2294 100 421 18.3 1275 55.5 442 19.2 156 6.8
From the above table we note that in the period 1913-1919 of the males arrested on charges of robbery and burglary young men under 20 constituted 22.6 per cent; whereas in 1928 of the corresponding group they constituted 18.3 per cent. This does not indicate that those now charged of these crimes are younger than was the case a decade or more ago. The impressive fact is that for both periods a little over, or a little under, one-fifth of all males arrested on these charges should be boys under twenty years of age.
VIII. How ARE ARRESTS DISTRIBUTED AMONG NATIONALITIES?
190 ARTHUR E. WOOD
n t'% NO , u NO. , l C1 t '- t N W N 0 m,
Q q- -- r. C CiC
u
P4 >o U2 ob - Q C,4 00 %o m
-- -i C; t6 jC . 4
0
0
- 02
4n,4
040
-o
-. o - - ,oo r-4 ,
-,-0 E
o tt 4 -o ' oo -- oo
-'. . . . . . . . . . . . .° .° . . . . . °
.
.... ...
!.
..
..:: q ...Nq 0) . . . .C 4
d: : : m :'
z U
~
.. :<
: C C
>' .' .
-13M
0 , 1 0 t v , CI 0ARRESTS IN DETROIT
%00 c -4
E-'4
C4H
0' to 0IU
z 04
V2
0- = 1 0 U;
-1- Z
Cd
-4-E- Nt ) m%0
E
4 N30 6c
0
.2
00; C-4 e'i cci
6 - 0 ,
ccN a0 00 b.
00 N OD I-sU
%0 (U ' 00' "
6c; cci csc a
m llN 0 0 I
eq -q- m 0'. q 0
c)~ C; ('U c; 4 C6
') m0 %0 N 0%. GO
m0 in 00 0'..4
C5 c'46Cq i c
tn'0N ' '
C54-54 -4 C '.00000'.~ CM
*'U-U'.N .it'.'.00'.
-4 -4-4-4-4 00cc U'.
'Ct- 00
*1 00
V) 0) N
00 c
,00 C13
c
m0
cc
mc 0'.C1
cc '0
N-0 .*
M : : '
-4 * ;
00 00 C C5ci d"€5i
0 ,0tC%
0 .KU.-00 00 t
-0' .: -c
oo :6-~5
C,3M' N 00.
clI c-4
0 C2
-192 ARTHUR "E WOOD
Table IV indicates for each of the sixteen arrest classifications the per cent constituted by male arrests of each nationality, or groups of nationalities, during the seven year period 1913-1919. This is not a crime rate for these nationalities, but simply an indication of the relative proportions that males of different nationalities constitute in the separate volumes of arrest charges. The data are taken from the category of "nationality" on the arrest cards. Taking the percentage distribution of the nationalities for each of the arrest classifications, the table also shows the rank of each nationality group, that is, the relative volume of arrests that can be attributed to it for a given charge.
First, the nationality distribution for all arrests. Native Ameri-cans (white and negro) rank first with 57.2 per cent of all male ar-rests. Second rank for all arrests is given to the group-Russians and Finns with 9.7 per cent. This nationality grouping is admittedly vague and misleading inasmuch as before the redistribution of territory occasioned by the War the term Russia on the arrest card was given by many Polish immigrants. This is a fundamental difficulty which obviously cannot be straightened out with greater accuracy. Third place in the total volume of male arrests is held by the group English and Canadians with 6.8 per cent. Fourth, are the Austro-Hungarians with
6.6 per cent. This group includes some who would now be classified
under Czecho-Slovakia or Jugo-Slavia. Fifth, are the Germans, with
3.5 per cent; sixth, are the Italians, with 3.2 per cent; and seventh, are
the Poles (those who gave Poland as their place of nativity), with
2.5 per cent. The remaining nationalities with rank and percentages
of arrests are as follows: Irish, eighth, 2.4%; "other foreign-born," ninth, with 1.7%; Greeks, tenth, with 1.6%; Servians, Bulgarians, Rumanians, and Turks, Armenians, eleventh, with 1.3%; Belgians, twelfth, with .9%; Norwegians, Swedes and Danes, thirteenth, with .4%; French, and Mexicans, South Americans, fourteenth, with .3%; Chinese and Japs, fifteenth, with .2%; and Swiss, sixteenth, with .1%; Spanish are seventeenth with less than .1 of 1 per cent.
ARRESTS IN DETROIT 193
For arrests on "disorderly" charges the ranking of the five high-est nationalities is (1) Native-born Americans (white and colored) 56%; (2) Russians and Finns, 11%; (3) Austro-Hungarian, 7%; (4) English and Canadians, 6%; (5) Italians, 4%.
For "drunkenness" the five highest rankings are (1) Native-born Americans (white and colored) 61.7%; (2) English and Canadians, 10.9%; (3) Irish, 7%; (4) Russians and Finns, 6%; (5) Austro-Hungarians, 4.7%.
For "begging and vagrancy'; charges we have: (1) Native Ameri-cans (white and colored), 70%; (2) English, Canadians, 10%; Irish, 10%; (3) Russians and Finns, 3%; (4) Germans, 2%; (5) Poles, .8%.
For violating "regulatory statutes" the five highest ranking are as follows: (1) Native Americans (white and colored), 68.6%; (2) English, Canadians, 8.3%; (3) Russians and Finns, 6.2%; (4) Austro-Hungarians, 3.6%; (5) Germans, 2.5%.
For "liquor offenses": (1) Native Americans (white and colored), 44.8%; (2) Russians and Finns, 15.4%; (3) Austro-Hungarians,
11.9%; (4) Germans, 6%; (5) Poles, 5.2%.
For "personal violence": (1) Native Americans (white and colored), 40.1%; (2) Russian and Finns, 17.3%; (3) Austro-Hun-garians, 12.9%; (4) Italian, 5.9%; (5) English, Canadians, 4.8%. For "homicide". (1) Native Americans (white and colored), 45.3%; (2) Italian, 23.4%; (3) Austro-Hungarians, 6.4%; (4) Rus-sians and Finns, 6.2%; (5) English, Canadians, 4.6%.
For "simple dishonesty": (1) Native Americans (white and colored), 62.4%; (2) Russians and Finns, 8%; (3) English, Canadians, 5.9%; (4) Austro-Hungarians, 5.5%; (5) Poles, 3.2%.
For "dishonesty with fraud": (1) Native Americans (white and colored), 49.9%; (2) Russians and Finns, 8.6%; (3) "Other foreign-born," 7.2%; (4) Italian, 5.9%; (5) English, Canadians, 5.7%.
For "dishonesty with violence": (1) Native Americans (white and colored), 67.9%; (2) Russians and Finns, 7.1%; (3) English, Canadians, 4.6%; (4) Italian, 3.8%; (5) Austro-Hungarians, 3.5%.
For "sex offenses": (1) Native Americans (white and colored), 56.2%; (2) Russians and Finns, 7.8%; (3) English, Canadians, 6.5% ;
(4) Austro-Hungarians, 6.3%; (5) Italian, 4.4%.
194 ARTHUR E. WOOD
A Chart is herewith presented indicating the percentage distribu-tion of arrests among the nadistribu-tionalities.
tu (U (ba 1
w&S - --- -- - - -
-C/i#ee ,...panese---;-- -- - --
-French - - - - ---- -
-mat Amerlcane, Adexrcapis -- - - - - -
Belgins,---= rvanSuBl 9'arians.,Roumanilans_ ---- ----
---TrurksA,4r nniams.-- -- -- -- --- - - -
--SG,-eek~s- -- -- ---
-o
lthe-s -- - - -
-l---
Poles---Italians
German,--- - -- - - - -
-Austrianv,
Hungarians---£n9'lish . Canaaians_ - t
Reussions ScJn ish,
-Ammie-iccns15-- -- --- - -
-0 -0 0.coo 0
o " o 0 a
DISniBuroN OF ARRESTS BY NATIONALITIES, 1913-1919
The fuller significance of the foregoing data concerning the nationality distribution among arrests may be had by comparing the nationality per cents among arrests with the percentage distribution
of nationalities for the total population of Detroit. The latter is to
be seen in the following table which is based upon the School Census
of Detroit as of June 1, 1921. A more accurate basis for comparing
ARRESTS IN DETROIT 195
TABLE V
CiTY oF DETRoIT, JUNE 1, 1921
(Population by Nativity)
Per Cent
Place of Birth Male Female Total of Pop.
U. S., White ... 324,179 317,568 641,747 68.0
Canada ... 22,656 24,866 47,522 5.1
U. S., Colored ... 23,690 20,304 43,994 4.7
Poland ... 24,824 18,928 43,752 4.7
Germany ... 14,232 14,065 28,297 3.1
Russia ... 13,741 10,977 24,718 2.6
(Present Boundaries)
Italy ... 11,122 7,305 18,427 1.9
England ... 8,666 7,349 16,015 1.7
(Proper)
Hungary ... 6,362 5,345 11,707 1.2
(Present Boundaries)
Austria ... 6,457 5,191 11,648 1.2
(Present Boundaries)
Belgium ... 3,914 3,150 7,064 .8
Scotland ... 3,553 3,104 6,657 .7
Ireland ... 3,164 2,684 5,848 .6
Roumania ... 1,979 1,518 3,497 *
Greece ... 2,497 709 3,206 *
Lithuania ... 1.514 986 2,500 *
Sweden ... 1,224 795 2,019 *
Jugo-Slavia ... 1,219 705 1,924 *
Ch-Slov ... 970 .825 1,795 *
Malta ... 1,396 346 1,742 *
France ... 899 836 1,735 *
Armenia ... 1,008 523 1,531 *
Holland ... 872 656 1,528 *
Finland ... 768 695 1,463 *
Denmark ... 706 407 1,113 *
Australia ... 620 493 1,113 *
Turkey ... 808 399 1,207 *
Switzerland ... 444 337 781 *
Norway ... 356 250 606 *
Ukraine ... 334 226 560 *
Mexico ... 352 153 505 *
Bulgaria ... 385 113 498 *
Spain ... 269 118 387 *
China ... 231 97 328 *
Latvija ... 55 46 101 *
Japan ... 63 11 74 *
Portugal ... 39 27 66 *
All other countries ... 2,789 1,909 4,698 *
Total ... 488,357 454,016 942,373
*Indicates that percentage of population is less than .5.
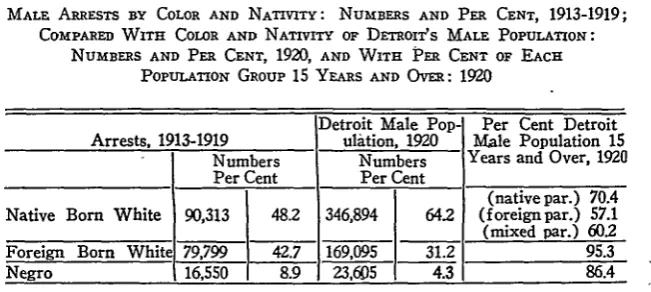
Further evidence, comparing the nationality and racial make-up of the arrest group with that of Detroit's population, may be had from
[image:29.431.53.383.57.568.2]ARTHUR E. WOOD
TABLE VI
MALE ARRESTS BY COLOR AND NATIVITY: NUMBERS AND PER CENT, 1913-1919;
COMPARED WITH COLOR AND NATIVITY OF DETRoIt's MALE POPULATION: NUMBERS AND PER CENT, 1920, AND WITH PER CENT OF EACH
POPULATION GROUP 15 YEARS AND OVER: 1920
Detroit Male Pop- Per Cent Detroit
Arrests, 1913-1919 ulation, 1920 Male Population 15
Numbers Numbers Years and Over, 1920
Per Cent Per Cent
(native par.) 70.4
Native Born White 90,313 48.2 346,894 642 (foreign par.) 57.1
(mixed par.) 602
Foreign Born White 79,799 42.7 169,095 31.2 95.3
Negro 16,550 8.9 23,605 4.3 86.4
In the above table male arrests (1913-1919) are distributed among Native-Born Whites, Foreign-Born Whites, and Negroes; and a similar division is made for the male population of Detroit, according to the Federal Census of 1920. The Foreign-Born Whites and the Negroes are seen to have far more than their legitimate quotas in the arrest group; and the Native-Born Whites, far less. These discrepancies are partly accounted for by the greater percentages of males over 15 years of age to be found among the two former groups as compared with the latter, as will be seen by examination of the final column of the table.
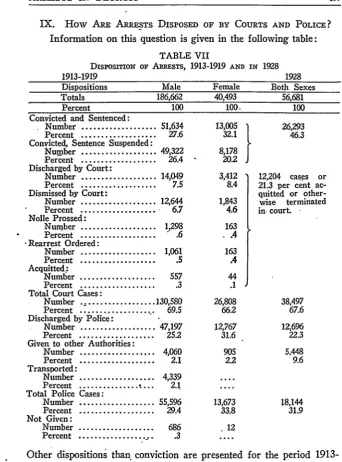
Table VII presents data relating to dispositions of arrests for the two periods 1913-1919 and 1928. The data for 1928 are taken from the report of the Detroit Police Department for that year. For the arrest data for 1913-1919 the divisions by sex are presented; but such a division was not made in the report of the Department. For the seven year period there were 186,662 male arrests and40,493 fe-male arrests. In 1928 there were 56,681 arrests of both sexes.
[image:30.431.45.371.94.240.2]ARRESTS IN DETROIT
IX. How ARE ARRESTS DISPOSED OF BY COURTS AND POLICE?
Information on this question is given in the following table:
TABLE VII
DisPosITioN or A Esrs, 1913-1919 AND IN 1928
1913-1919
Dispositions Male
Totals 186,662
Percent 100
Convicted and Sentenced:
Number ... 51,634
Percent ... 27.6 Convicted, Sentence Suspended:
Number ... 49,322
Percent ... 26.4 Discharged by Court:
Number ... 14,049
Percent ... 7.5
Dismissed by Court:
Number ... 1,644
Percent ... 6.7
Nolle Prossed:
Numrber ... 1,298
Percent ... .. 6
Rearrest Ordered:
Number ... 1,061
Percent ... . .5
Acquitted;
Number ... 557
Percent ... . .3
Total Court Cases:
Number ... 130,580
Percent ... 69.5
Discharged by Police:
Number ... 47,197
Percent ... 25.2
Given to other Authorities:
Number ... 4,060
Percent ... 2.1
Transported:
Number ... 4,339
Percent ... 2.1
Total Police Cases:
Number ... 55,596
Percent ... 29.4
Not Given:
Number ... 686
Percent ... .3
1928 Both Sexes
56,681 100 26,293 46.3 Female 40,493 100. 13,005 32.1 8,178 20.2 3,412 8.4 1,843 4.6 163 .4 163 .4 44 .1 26,808 66.2 12,767 31.6 905 2.2 13,673 33.8 12
Other dispositions than conviction are presented for the period 1913-1919. For example, 7.5 per cent of the males and 8.4 per cent of the females were discharged by the court; an additional 6.7 per cent of the males and 4.6 per cent of the females had their cases dismissed' by
'The terms "discharged" and "dismissed" both appear on the arrest cards of the Record Bureau, and mean the same thing, the former applying to the
man arrested and the latter to the "case!'
12,204 cases or
21.3 per cent
ac-quitted or
other-wise terminated
in court.
[image:31.431.44.387.55.518.2]ARTHUR E. WOOD
the court; then, .6 per cent of males and .4 per cent of females had their cases nolle prossed; in .5 per cent of the male and .4 per cent of the female cases a rearrest was ordered; and finally, .3 per cent of the males and .1 per cent of the females were acquitted at trial. Al-together 15.6 per cent of the male cases and 13.9 per cent of the fe-male cases were disposed of in court otherwise than by conviction.
In the report of the Police Department for 1928 the information regarding specific type of court disposition, other than by conviction, is not given. Altogether, however, in 1928, 12,204 cases or 21.3 per cent were disposed of in court by some other means than conviction. Only an examination of court files would reveal what happened to them.
Turning to the police dispositions of the total volume of cases for the two periods, we find that in 1913-1919, 29.4 per cent of male arrests and 33.8 per cent of female arrests were handled by the police without recourse to the courts. Thus, 25.2 per cent of the males and 31.6 per cent of the females arrested were discharged by the police, because of lack of evidence for holding them, or for some other reason. An additional 4.2 per cent of the males, and 2.2 per cent of the females were turned over to other authorities or transported to other states of countries.
In 1928, 31.9 per cent of males and females arrested were dis-posed of by the police without court action. This included 22.3 per cent who were discharged by the police, and 9.6 per cent turned over to other authorities.
The conclusion would seem to be that no very great change in
the outcome of cases of persons arrested as between 1928 and a decade or more ago. What change there is seems to indicate that a somewhat smaller per cent of cases are now convicted, and a somewhat larger per cent of cases are disposed of in court otherwise than by conviction, than was the case between 1913 and 1919.
ARRESTS IN DETROIT 199
ovo
U CJ-!4C oo u O C En O Ro%QrC
**0 00 N N~
o0 122 -
~
'N. tO Rl 0~ l
cj )~ L N.C t1
MI V4) nN Cj O o
A44
~]
-b0
*0 0) U) m- 4
C)~~ oo, C d
m) U) N.
o
cu
00
CD 0
0
O cfl \CO CU
-0 in '0 N~ NC
- 4j
-o N. '4 C
r- cl
-COCO
0
N. 0ejp
u0 v 0 l -4 Cd 0
U)
ARTHUR E. WOOD
In the above table the data for 1928 are taken from the Report of the Police Department for that year. A careful examination of the table seems to indicate that the more serious the charge the less chance there is of conviction. That is, in 1928 it is seen that there is a higher percentagd of convictions for manslaughter than there is for murder; larceny brings a larger proportion of convictions than robbery, and burglary; and non-felonious assaults than felonious assaults. More-over, in the data for 1913-1919 the convictions 6n the combined homi-cide charges of murder and manslaughter show a lower percentage than those for the two types of assaults; and, again, in 1913-1919 larceny more often brings convictions than robbery and burglary. In .1928 the 20.5 per cent of convictions for those prosecuted on charges of felonious assault, and the 25.9 per cent of convictions on charges of robbery bespeak a grievous failure of the criminal process at some point.
CONCLUSION