IJPSR (2019), Volume 10, Issue 1 (Research Article)
Received on 28 April, 2018; received in revised form, 20 June, 2018; accepted, 08 July 2018; published 01 January 2019
ANALYTICAL METHOD DEVELOPMENT AND OPTIMIZATION OF SOFOSBUVIR DRUG - A QbD APPROACH
Santosh S. Bhujbal * and Sachin L. Darkunde
Department of Pharmacognosy, Dr. D. Y. Patil Institute of Pharmaceutical Sciences and Research, Pimpri, Pune - 411018, Maharashtra, India.
ABSTRACT: Quality by Design (QbD) refers to the achievement of certain predictable quality with a predetermined and desired specification. The current studies details QbD enable development of a simple, rapid, sensitive and cost-effective High-Performance Liquid Chromatographic method for estimation of Sofosbuvir. The factor screening studies were performed using 5-factor 8-run 2-level factorial design. System thematic optimization was performed employing split-plot design by selecting the mobile phase ratio, buffer pH, and column type as the critical method parameter (CMPs) identified from screening studies, thus evaluating a critical analytical attributes (CAAs) namely, retention time, peak tailing, and theoretical plate as per the parameter of the method robustness. The optimal chromatographic separation was achieved using acetonitrile and ammonium acetate buffer (pH 4) 48:52 v/v as the mobile phase with a flow rate of 1.1 ml/min by using a PDA detector at 262 nm. The method was validated as per the ICH-recommended conditions, which ensure a high degree of linearity, accuracy, precision, sensitivity, and robustness over the exiting liquid chromatography methods of the drug. Moreover, the lower solvent consumption along with the short analytical run time of 10 min leads to a cost-effective and environment-friendly chromatographic procedure. Thus, the proposed method reviled that rapid and represented a good procedure for Sofosbuvir.
INTRODUCTION: Sofosbuvir is a prodrug of 2‟-deoxy-2‟ -fluoro-2‟ -C- methyluridine mono-phosphate which is phosphorylated intracellularly to the active triphosphate form. Sofosbuvir is generally used for the treatment of chronic hepatitis C. Hepatitis C is a chronic infection affiliate with considerable mortality and morbidity. The treatment of hepatitis C virus (HCV) was based on the use of interferon.
QUICK RESPONSE CODE
DOI:
10.13040/IJPSR.0975-8232.10(1).108-16
The article can be accessed online on
www.ijpsr.com
DOI link: http://dx.doi.org/10.13040/IJPSR.0975-8232.10(1).108-16
The IUPAC name of Sofosbuvir (S )-isopropyl-2-(S)-(2R, 3R, 4R, 5R)-5-(2, 4-dioxo-3,4-dihydro pyrimidine-1(2H)-yl)- fluoro- 3- hydroxy- 4-methyl tetra hydrofuran -2- yl) methoxy)- zphenoxy) phosphorylamino) propanoate Fig. 1. Sofosbuvir is nucleotide analogue polymerase inhibitors of non-structural protein and is among novel, recent, potent and safe. Sofosbuvir drug used in combination with other medicinal products for the treatment of HCV infections.
Hepatitis C virus affects about three to four present of the global population. Sofosbuvir shows effective activity against all HCV genotypes. Sofosbuvir is generally used in the treatment of chronic HCV genotype 1, 2 3, or 4 infections in adults which including those with hepatocellular Keywords:
QbD, CMPs, CAAs, Sofosbuvir
Correspondence to Author: Dr. Santosh S. Bhujbal
Professor and Head,
Department of Pharmacognosy, Dr. D. Y. Patil Institute of Pharmaceutical Sciences and Research, Pimpri, Pune - 411018, Maharashtra, India.
carcinoma awaiting liver transplantation and those with HIV co-infection. Sofosbuvir is a white to off-white non-hygroscopic crystalline solid powder. This is slightly soluble in water, freely soluble in methanol, acetone, and ethanol, insoluble in heptane.
FIG. 1: STRUCTURE OF SOFOSBUVIR
The conception of “Quality by Design” (QbD) was outlined as an approach which covers a better scientific understanding of critical process and product qualities, designing controls and tests based on the scientific limits of understanding during the development phase and using the knowledge obtained during the life-cycle of the product to work on a constant improvement environment. QbD doesn‟t essentially mean less analytical testing; rather it means that proper analysis at the right time, and is based on science and risk assessment. Implementation of QbD helps to develop a rugged and robust (strong) method that helps to go with ICH, therefore, for that reason pharmaceutical industries are adopting the concept of QbD. Factors that affect the robustness are considered for development of the analytical method in QbD environment.
According to the information extracted from literature to data, there is not even a single method reported for the RP-HPLC of Sofosbuvir using Quality by Design (QbD) approach in the pharmaceutical formulation. The novelty of the present method includes the development of a newer solvent system using acetonitrile: ammonium acetate buffer. The method was validated for linearity, accuracy, precision, LOD, LOQ, system suitability and selectivity as per ICH guideline. The primary objective of this study was to implement QbD approach to develop and validate the RP-HPLC method and to established and in-depth understanding of the method and build in the quality during the method development to
ensure optimum method performance over the lifetime of the product.
EXPERIMENTAL:
Standards and Reagents: Sofosbuvir provided from Alembic Pharmaceutical Ltd., Vadodara, India. The commercially available tablet formulation of Sofosbuvir, MyHep (Mylan Pharmaceuticals Private Limited, Taloja, Panvel, Raigad, India) was used for the assay. HPLC grade acetonitrile obtained from Merck Specialities Pvt. Ltd., Worli, and Mumbai was used for the study, while all other chemicals and reagents were used as obtained.
Instrumentation and Chromatographic Conditions: A Shimadzu (Model no. LC20AD) High-Performance Liquid Chromatographic system fitted with the quaternary solvent manager, sample manager, PDA detector controlled by LC-Solution software, the analytical column used for the method development. Chromatographic separations were performed on a reversed phase C8 column of dimension 4.6 × 250 mm, particle size 5.0 µm, (kromasil 100-5C8 part no. M05CMA25). The isocratic solution was employed with acetonitrile and ammonium acetate buffer pH 4 in the ratio of 48:52 v/v as the mobile phase with PDA detector at 262 nm. The column was equilibrated with mobile phase for saturation of the stationary phase to chromatographic analysis.
Preparation of Solvent and Solution:
Buffer Preparation: 3.85 g of ammonium acetate was weighed and dissolved in 500 ml of distilled water and add 2.8 ml GAA. Then it was sonicated and vacuum filtered through 0.45 µm filter. The pH was adjusted with 10% OPA.
Standard Stock Solution Preparation (400ppm): An accurately weighed quantity of Sofosbuvir API, 10 mg was transferred into 25 ml volumetric flask and then made up to volume with mobile phase.
Sample Solution Preparation: 1 ml of stock solution was diluted to 10 ml with the mobile phase to prepare 40 ppm.
rate, types of column C8 and C18. A five-factor eight-run 2-level factorial design was employed for factor screening studies to identify the CMPs/CPPs critically affecting the method CAAs (i.e., peak tailing and retention time). Table 1 depicts the design matrix enlisting the studied factors and the decoded translation of their respective low (-1) and high (+1) levels. A total of eight experimental runs were performed, and the design was analyzed for understanding the influence of studied factors on the CAAs as shown in Table 2. Mathematical data analysis was carried out by fitting the obtained experimental data to the linear polynomial model
by obviating the interaction term(s). As screening is primarily based on the principle of factor scarcity, the half-normal plot and Pareto charts were employed for quantitatively identifying the effect of each factor on the selected CAAs.
TABLE 1: FACTORS AND THEIR RANGES (LEVELS) S.
no.
Factors Levels
Low (-1) High (1)
1 Mobile phase ratio (% v/v) 40:60 50:50 2 Flow rate (ml/min) 0.9 1.1
3 Buffer pH 3 4
4 Buffer strength 20 40
[image:3.612.47.565.267.386.2]5 Column type C8 C18
TABLE 2: EXPERIMENTS SUGGESTED BY FIVE-FACTOR EIGHT-RUN 2-LEVEL FACTORIAL DESIGN FOR SCREENING OF METHOD VARIABLES AND PROCESS PARAMETERS AT THEIR RESPECT LOW AND HIGH LEVELS
Factors (independent variables) Responses (dependent variables)
Runs Mobile phase ratio (% v/v)
Flow rate (ml/min)
Buffer pH
Buffer strength
Column type
Rt Peak
tailing
Theoretical plates
1 50:50 1.1 4 40 18 7.47 1.33 3174
2 40:60 0.9 4 20 18 26.23 1.20 4810
3 40:60 1.1 3 20 18 39.7 1.18 7384
4 50:50 0.9 3 40 18 17.9 1.53 9401
5 50:50 1.1 4 20 8 8.98 1.27 3186
6 40:60 1.1 3 40 8 37.93 1.34 2080
7 50:50 0.9 3 20 8 17.16 1.38 8047
8 40:60 0.9 4 40 8 24.05 1.40 2989
Method Development as per the Experimental Design: By the factor screening studies, selection of the CMPs affecting the method performance was optimized using a three-factor at two equidistant levels, i.e., low (-1) and high (+1) levels. Table 4 summarizes the design matrix as per the Split-plot design with 14 experimental runs along with quintuplicate studies of the center point (0, 0) runs. A standard concentration of 40 µg/mL was used for all experimental runs, which were analyzed for method CAAs, i.e., retention time, peak tailing and theoretical plates.
Optimization Data Analysis and Model Validation: The optimization data analysis was carried out by multiple linear regression analysis using Design Expert® ver.10 software (M/s Stat-Ease Inc., MN, USA) for fitting the experimental data to the second-order quadratic polynomial model for estimating both the main effects and interaction effects. The model coefficients with statistical significance <0.05 were considered in framing the polynomial equation. The model aptness was finally ratified by analyzing various parameters like coefficient of correlation (r2), predicted error sum of squares (PRESS) and lack of
fit analysis. Response surface analysis was carried out from the 2D-contour and 3D-response surface plots to discern the factor-response relationship and plausible interaction effect(s) if any. Search for the optimum chromatographic solution was carried out to obtain efficient method performance by numerical optimization and desirability function by “trading-off” of various CAAs as per the desired acceptance criteria, i.e., minimization of retention time and peak tailing, and maximization of theoretical plates, respectively. On the heels of numerical optimization, the graphical optimization was also carried out to embark upon the analytical design space and location of the optimized solution.
Method Validation: For confirming the suitability of the method for its intended purpose, method validation is carried out as per ICH guidelines for assessing system suitability, linearity, accuracy and recovery, limits of detection (LOD), limits of quantitation (LOQ), intra-day precision, inter-day precision and robustness.
Precision: Precision represents the measurement of the degree of reproducibility or repeatability of test results for the analytical method. It has two types, repeatability (intra-day precision) and intermediate precision (inter-day precision). The precision of the method was evaluated on six same concentrations such as 40 µg ml-1. For intra-day precision, sets of three replicates of the above concentrations were analyzed on the same day; while for inter-day precision sets of same replicates were analyzed on multiple days by multiple analysts in the same laboratory.
Accuracy and Recovery: Accuracy of the method was determined to employ the standard addition method. Five different concentrations were used. Three replicates of each concentration level were analyzed.
LOD and LOQ: The determination of LOD and LOQ was estimated using formulae; LOD = 3.3 × ASD/S and LOQ = 10 × ASD/S; where „ASD‟ is the average standard deviation and „S‟ is the slope of the corresponding calibration curve.
System Suitability: For ensuring adequate performance of the method, system suitability was considered as a vital parameter. Retention time (Rt), a number of theoretical plates (N) and tailing factor (T) were evaluated for six replicate injections of the drug at a concentration of 40 µg ml-1.
Robustness: A method is said to be robust if it is unaffected by small but deliberate variations in the operating parameters. Selected parameters were the amount of organic phase concentration, pH of the buffer, flow rate and wavelength. Each selected
parameter was varied by traditional one factor at a time approach while other parameters kept at a constant level. Wavelength varied at 265 and 269 nm, flow rate at 0.9 to 1.1 ml/min, organic phase concentration at 40 and 60% v/v and pH of the buffer at 3 and 4.
RESULT AND DISCUSSION:
Screening Design for Suitable Chromatographic Conditions: Determine of the suitable column and solvent system based on peak parameters methanol: water / methanol: buffer (potassium phosphate) / acetonitrile: water and acetonitrile: ammonium acetate buffer this four mobile phase were selected for screening study on C8 and C18 column at pH 3 and 4. These mobile phases were screened by varying the organic phase composition from 40 to 50% v/v and flow rate from 0.9 to 1.1 ml/min.
Optimization Phase: Response surface design was utilized for method development to evaluate the effect of mobile phase ratio, buffer pH, and column type. The software suggested total 14 runs. Factors and responses considered for the study were shown in Table 4 ranges considered were based upon previous univariate chromatographic separation studies.
TABLE 3: INDEPENDENT VARIABLES, DEPENDENT VARIABLES, AND LEVELS OF THE SPLIT-PLOT DESIGN
Factor Symbol Level (−1) Level (+1)
Independent
Mobile phase ratio % v/v A 40 50
pH of buffer B 3 4
Column type C C8 C18
Dependent
Retention time Y1
Tailing factor Y2
Theoretical plates Y3
TABLE 4: OPTIMIZED CONDITIONS SUGGESTED BY CENTRAL COMPOSITE DESIGN AND OBSERVED RESPONSE VALUES
Runs Mobile phase
composition (v/v %)
pH of buffer
Column type
Retention time
Peak tailing
Theoretical plate
1 40 3.5 8 30.38 1.1 4201
2 40 3 18 37.59 1.56 7156
3 40 4 18 15.98 1.66 3940
4 50 3 8 13.33 1.51 6973
5 50 3.49 18 12.14 1.9 7961
6 50 4 8 8.2 1.47 5113
7 40 4 8 20.59 0.77 9513
8 40 3 8 37.2 1.28 4756
9 40 3.5 18 36.03 1.42 4995
10 45 3.5 8 21.3 1.3 6024
11 45 3 18 19.83 1.61 6408
12 50 4 18 6.46 1.89 4980
13 50 3 18 13.06 2.04 7570
[image:4.612.314.565.438.546.2] [image:4.612.47.571.581.750.2]The data generated were analyzed using Design Expert software.
Quadratic model was suggested by the software and the general equation for this model is as follows:
Y = β0 + β1X1 + β2X2 + β3X3 + β12X1X2+ β13X1X3 + β23X2X3 + β1X12 + β2X22+ β3X32
Where β0 represents the arithmetic averages of all the quantitative outcomes of all experimental runs; β1, β2, and β3 are the coefficients computed from the observed experimental values of Y; and X1, X2 and X3 are the coded levels of factors. The equation
represents the quantitative effect of factors X1, X2 and X3 upon each of the responses; Y1, Y2, and Y3. Mathematical models were generated by ANOVA for each dependent variable, and then 3D surface graphs were obtained for each of them along with their equations.
The effect of independent variables (X1, X2, and X3) and their interaction terms (X1X2, X1X3 and X2X3) were assessed on each dependent variable. For identifying non-linearity, exponential terms are investigated.
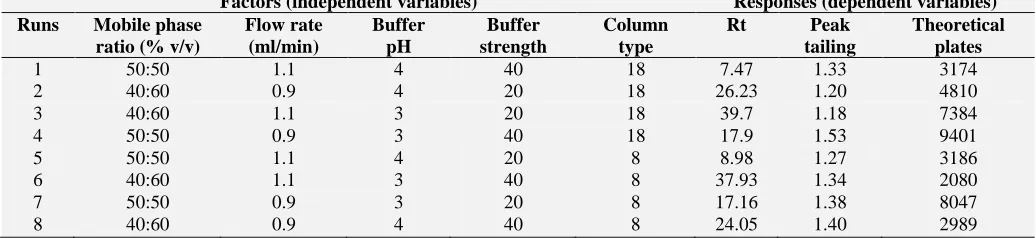
Selection of Column:
Observations:
In C18 column found very high peak tailing.
Also, it gives very less retention time which produces a problem during force degradation study to peak separation.
Due to these reasons, we select C8 column for further study.
Software Validation: To confirm the authenticity of software few trials provided by software MODR were run practically.
FIG. 4: METHOD SUGGESTED BY SOFTWARE ON C8 COLUMN
Trial 01:
FIG. 5: CHROMATOGRAM ACETONITRILE: BUFFER (45:55), pH 4.02, COLUMN C8
TABLE 5: COMPARISON OF DATA FOR TRIAL
SUGGESTED BY SOFTWARE VS EXPERIMENTAL-01
Mobile phase provided by software
pH of the buffer provided by software
Column used
45:55 4.02 C8
Rt provided by software
Asymmetry provided by software
T. plate provided by software
8.4 1.15 6464
Rt observed after actual experiment
Asymmetry observed after actual experiment
T. plate provided by the experiment
7.27 1.6 6502
FIG. 2: 3D GRAPH SHOWS COLUMN C18 GIVES HIGH EFFECT ON PEAK TAILING
[image:5.612.44.570.271.741.2] [image:5.612.57.559.275.411.2]Trial 02:
FIG. 6: CHROMATOGRAM ACETONITRILE: BUFFER (48:52), pH 4.02, COLUMN C8
TABLE 6: COMPARISON OF DATA FOR TRIAL
SUGGESTED BY SOFTWARE VS EXPERIMENTAL-02
Mobile phase provided by software
pH of the buffer provided by software
Column used
48:52 4.02 C8
Rt provided by software
Asymmetry provided by software
T. plate provided by software
7.5 1.26 6107
Rt observed after actual experiment
Asymmetry observed after actual experiment
T. plate provided by experiment
8.3 1.6 6188
The standard solutions of Sofosbuvir were run using the optimized condition to evaluate the prediction accuracy.
Observation: Practical data obtained for both the trials approximately matches with the data provided by software which shows the authenticity of the software.
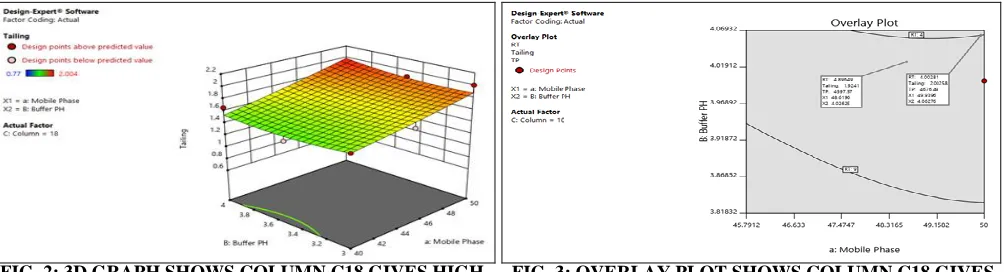
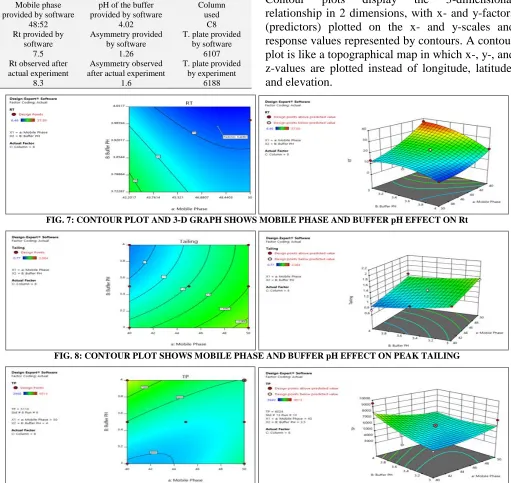
The responses obtained after carrying out trail runs were entered back to DOE software and the contour plots as well as 3D graph of retention time (Rt), tailing factor (TF) and theoretical plates (TP) were plotted as shown in Fig. 7 - 9.
Contour plots display the 3-dimensional relationship in 2 dimensions, with x- and y-factors (predictors) plotted on the x- and y-scales and response values represented by contours. A contour plot is like a topographical map in which x-, y-, and z-values are plotted instead of longitude, latitude, and elevation.
FIG. 7: CONTOUR PLOT AND 3-D GRAPH SHOWS MOBILE PHASE AND BUFFER pH EFFECT ON Rt
FIG. 8: CONTOUR PLOT SHOWS MOBILE PHASE AND BUFFER pH EFFECT ON PEAK TAILING
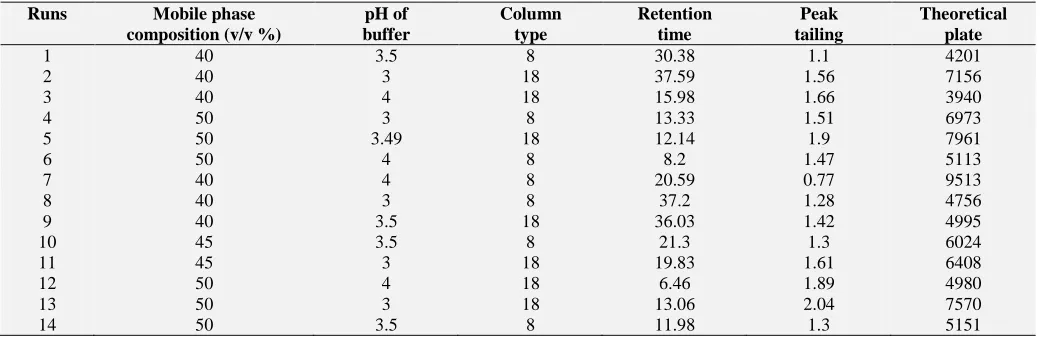
[image:6.612.49.300.70.201.2] [image:6.612.49.560.258.741.2]The final optimization plot indicates that the optimum chromatographic conditions can be achieved by using % of organic phase 48%, buffer pH 4, column C8 will give the required response.
[image:7.612.48.558.168.469.2]Optimum Chromatographic Conditions: The Optimum chromatographic conditions determined by the DOE are shown in Table 7.
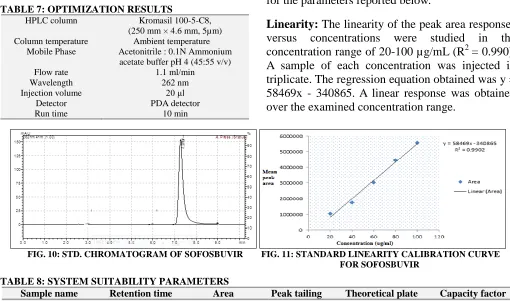
TABLE 7: OPTIMIZATION RESULTS
HPLC column Kromasil 100-5-C8,
(250 mm × 4.6 mm, 5µm)
Column temperature Ambient temperature
Mobile Phase Acetonitrile : 0.1N Ammonium
acetate buffer pH 4 (45:55 v/v)
Flow rate 1.1 ml/min
Wavelength 262 nm
Injection volume 20 μl
Detector PDA detector
Run time 10 min
The standard solutions of Sofosbuvir were run using the optimized condition to evaluate the prediction accuracy.
Method Validation: The applied chromatographic conditions permitted a good separation of Sofosbuvir, no drug decomposition was observed during the analysis. The LC method was validated for the parameters reported below.
Linearity: The linearity of the peak area responses versus concentrations were studied in the concentration range of 20-100 µg/mL (R2 = 0.990). A sample of each concentration was injected in triplicate. The regression equation obtained was y = 58469x - 340865. A linear response was obtained over the examined concentration range.
FIG. 10: STD. CHROMATOGRAM OF SOFOSBUVIR FIG. 11: STANDARD LINEARITY CALIBRATION CURVE FOR SOFOSBUVIR
TABLE 8: SYSTEM SUITABILITY PARAMETERS
Sample name Retention time Area Peak tailing Theoretical plate Capacity factor
Sofosbuvir 7.2 1832001 1.4 3029 2.2
Accuracy: Accuracy data showed good percent recovery between 99.49 and 101.51 and % RSD value NMT 2%, which unequivocally vouch for a
high degree of accuracy of the development method. Table 9 illustrates the accuracy data for various quality control samples of Sofosbuvir.
TABLE 9: ACCURACY DATA FOR DEVELOPMENT OF HPLC METHOD Std.
Concentration
Level of recovery %
Amount of drug added (mg)
Amount of drug recovered (mg)
% Recovery
% RSD
40 g/ml 80 8 7.91 99.37 0.328
100 10 10.03 100.33 0.539
120 12 12.13 100.55 1.15
Precision: The intraday and inter-day precision showed the higher value of percent recovery of Sofosbuvir, ranging between 98.73 and 99.1%, respectively. Further, the % RSD for Sofosbuvir assat as per repeatability and intermediate precision
were well within in 1%. These results confirmed the high degree of precision of the developed method. Table 10 illustrates inter-day and intraday data for various quality control samples of Sofosbuvir.
TABLE 10: INTRA-AND INTERDAY PRECISION DATA FOR THE DEVELOPED HPLC METHOD OF SOFOSBUVIR
Drug Intra-day precision Inter-day precision
% Label claim S.D. (±) R.S.D. % Label claim S.D. (±) R.S.D.
LOD and LOQ: The determination of LOD and LOQ was based on the standard deviations of the responses and slopes of constructed calibration curves (n = 3) as described by ICH guidelines Q2 (R1). The LOD and LOQ values found were 0.5846µg/ml and 1.395µg/ml respectively.
System Suitability Study: According to USP, system suitability tests are an integral part of liquid chromatographic methods. Retention time, peak tailing and number of theoretical plates were calculated for standard solutions. The values for retention time, peak area and theoretical plates obtained from system suitability study were found to be 8.4 min, 1.4 and 3029 respectively. The data was found to be within acceptable limits.
Robustness: In all varied chromatographic conditions for parameters such as alteration in the volume of acetonitrile, flow rate, column type, buffer pH there was a lack of significant difference in the peak area, retention time, theoretical plates and peak tailing. The magnitudes of % RSD and SEM were found to be well within the limit, i.e., <2%.
CONCLUSION: A robust RP-HPLC method for Sofosbuvir was developed using a Quality by Design approach on Design-Expert® software, version-10. Three independent factors were used such as mobile phase ratio, buffer pH, column type. Totally 14 experimental runs were suggested by the software for analyzing the interaction of each response i.e. retention time, peak tailing, number of theoretical plates were considered as dependent factors.
The method was validated according to ICH guidelines. Validation of analytical QbD method corroborated excellent linearity, accuracy, precision, LOD, LOQ, system suitability and robust and rugged for determination based on the knowledge of method obtained through the method development and the result of risk assessment. The approach can be successfully used in the laboratory to develop RP-HPLC method for Sofosbuvir.
ACKNOWLEDGEMENT: The authors are thankful to Alembic Pharmaceuticals Ltd., for kindly providing the standard drug of Sofosbuvir and Dr. D. Y. Patil Institute of Pharmaceutical
Sciences and Research, Pimpri, Pune (India), for providing the research facilities.
CONFLICT OF INTEREST: Nil
REFERENCES:
1. Vikas PM, Vikas PM, Satyanarayana DT, Kumar DV, Mounika E, Latha MS, Anusha R and Sathish Y: Development and validation of new RP-HPLC method for the determination of Sofosbuvir in pure form. Wor J of Pharmacy and Pharmaceutical Sci 2016; 5(5): 775-81.
2. Goodman LS and Gilman AG: The Pharmacological Basis
of Therapeutics, By Hardman, McGraw - Hill, Edition 9th, 1996.
3. Draft Guidance Analytical Procedures and Method
Validation, US Food and Drug Administration, Centre for Drugs and Biologics, Department of Health and Human Services 2000. http://www.fda.gov/cder/guidance/2396 dft.htm#111.
4. Validation of analytical procedures text and Methodology Q2(R1), November 2005, International conference on harmonization of technical requirements for registration of pharmaceuticals for human use (ICH).
5. Abdel-Gawad SA: Simple chromatographic and spectro-photometric determination of Sofosbuvir in pure and tablet forms. European Journal of Chemistry 2016; 7(3): 375-9. 6. Sandhu PS, Beg S, Katare OP and Singh B: QbD-driven
development and validation of an HPLC method for
estimation of Tamoxifen citrate with improved
performance. J of Chromatogra Sci 2016; 54(8): 1373-84. 7. Lavanchy D: Evolving epidemiology of hepatitis C virus.
Clinical Microbiology and Infection 2011; 17(2): 107-15. 8. Shepard CW, Finelli L and Alter MJ: Global epidemiology
of hepatitis C virus infection. Lancet Infect Dis 2005; 5: 558-567.
9. Vejendla R, Subramanyam CV and Veerabhadram G:
Estimation and validation of Sofosbuvir in bulk and tablet dosage form by RP-HPLC. International Journal of Pharmacy 2016; 6(2): 121-7.
10. Berden FA, Kievit W, Baak LC, Bakker CM, Beuers U, Boucher CA, Brouwer JT, Burger DM, van Erpecum KJ, van Hoek B and Hoepelman AI: Dutch guidance for the treatment of chronic hepatitis C virus infection in a new therapeutic era. Neth J Med 2014; 72(8): 388-400. 11. Cholongitas E and Papatheodoridis GV: Sofosbuvir: a
novel oral agent for chronic hepatitis C. Annals of Gastroenterology: Quarterly Publication of the Hellenic Society of Gastroenterology 2014; 27(4): 331.
12. Tran TT: A review of standard and newer treatment strategies in hepatitis C. The American Journal of Managed Care 2012; 18(S-14): S340-9.
13. New drug Sovaldi heralds the end of Hepatitis-C in Britain, Daily Mail 2014.
14. Sofosbuvir Full Prescribing Information”. www.Gilead.com. Retrieved 28 October 2014.
15. Nemaderm, Dole MN and Sawant SD: Development and
validation of UV-spectrophotometric method for
estimation of Sofosbuvir in bulk form by absorbance maxima method.
16. Skoog, Holler and Nieman: Molecular spectroscopy In Principles of Instrumental Analysis, Thomson Asia Pvt. Ltd., Singapore, Edition 5th, 2004: 342-344.
18. Beckett AH and Stenlake JB: Practical Pharmaceutical Chemistry. New Delhi: CBS Publishers and Distributors, Edition 4th 2002; 2: 275-288.
19. Shaikh SN and Dabhade MP: Development and validation of RP-HPLC method for quantitative analysis of Sofosbuvir in a pure and pharmaceutical formulation. 20. Spina A, Eramova I and Lazarus JV: Policy responses to
viral hepatitis B and C among people who inject drugs in
Member States of the WHO European region: a sub-analysis of the WHO 2013 global hepatitis policy survey. BMC Infectious Diseases 2014; 14(6): S15.
21. Lawitz E, Mangia A, Wyles D, Rodriguez-Torres M, Hassanein T, Gordon SC, Schultz M, Davis MN, Kayali Z, Reddy KR and Jacobson IM: Sofosbuvir for previously untreated chronic hepatitis C infection. New England Journal of Medicine 2013; 368(20): 1878-87.
All © 2013 are reserved by International Journal of Pharmaceutical Sciences and Research. This Journal licensed under a Creative Commons Attribution-NonCommercial-ShareAlike 3.0 Unported License.
This article can be downloaded to ANDROID OS based mobile. Scan QR Code using Code/Bar Scanner from your mobile. (Scanners are available on Google Play store)
How to cite this article: