N A N O E X P R E S S
Open Access
Dependence of
Z
Parameter for Tensile
Strength of Multi-Layered Interphase in
Polymer Nanocomposites to Material and
Interphase Properties
Yasser Zare
1and Kyong Yop Rhee
2*Abstract
In this work, theZinterphase parameter which determines the tensile strength of interphase layers in polymer nanocomposites is presented as a function of various material and interphase properties. In this regard, the simple
Pukanszky model for tensile strength of polymer nanocomposites is applied and the dependency ofZto different
characteristics of constituents and interphase are illustrated by contour plots. The interphase strength (σi) andB interfacial parameter in Pukanszky model show direct links withZparameter. Also, it is found that the volume fractions of nanoparticles and interphase reveal dissimilar effects onZ. A highZis obtained by a low nanoparticle volume fraction and high content of interphase, but the best values ofZare associated with the level ofB parameter.
Keywords:Polymer nanocomposites, Interphase layer, Material properties, Tensile strength
Background
The exceptional improvements of mechanical properties at low nanofiller contents have introduced significant interest in the use of nanoparticles in polymer matrices [1–6]. The different types of nanofillers have been used to strengthen and toughen the polymers. The most in-teresting aspect related to nanofiller is that they can im-prove the properties of polymers at very low filler concentrations compared to micro-particles and fibers [7–9]. This phenomenon can be described as nanoeffect which is the interactions at the atomic scale. When the particle size decreases to the nanoscale, the specific sur-face area rapidly increases, making the sursur-face properties as the dominant factors and providing unique character-istics with widespread applications in many industrial parts. Additionally, when the filler size is similar to that of polymer chains, molecular interactions between nano-particles and polymer matrix produce a third phase as interphase which has different properties from both
polymer and nanoparticles [10, 11]. The properties of interphase play a main role in the level of dissipated en-ergy by different damaging mechanisms which take place at the nanoscale [12, 13]. As a result, the mechanical properties of the nanocomposites significantly depend on the interphase level.
Many researchers have tried to characterize the inter-phase properties by modeling of the general properties of nanocomposites because the interphase is affected by many factors, and it cannot be characterized by simple techniques [14, 15]. The theoretical surveys in the recent years provided a large amount of information about interphase and interfacial interactions in polymer nanocomposites.
Several researchers have considered a multi-layered interphase in polymer nanocomposites. They assumed that each layer in interphase has different properties from others. The characteristics of interphase layers were hypothetically studied and their influences on the nanocomposite behavior were discussed in many papers [16–18]. In one study, the thickness of interphase was assumed as a characteristic length scale and the main ef-fects of interphase on stiffness and yield stress of
* Correspondence:[email protected]
2Department of Mechanical Engineering, College of Engineering, Kyung Hee University, Yongin 446-701, Republic of Korea
Full list of author information is available at the end of the article
polymer nanocomposites were evaluated [19]. The the-oretical results showed a good agreement with the ex-perimental data for polymer/SiO2 nanocomposites in
that study.
In our previous study [20], it was found that the ten-sile strength of interphase layers changes by a power function of the distance between nanoparticles and poly-mer matrix. It was also shown that the calculations of this equation depend on Z parameter which shows the interphase properties. Additionally, it was discussed that the extent ofZdetermines the level of mechanical prop-erties in the polymer nanocomposites. In this paper, the
Z interphase parameter is defined by the material and interphase properties in polymer nanocomposites. The Pukanszky model and many useful equations are applied which only need to tensile strength of polymer nano-composites and the properties of nanocomposite compo-nents. The dependency of Z to different material and interphase characteristics are illustrated by contour plots based on the resultant equations. The obtained results for different types of polymer nanocomposites are also explained by practical views in this area.
Methods
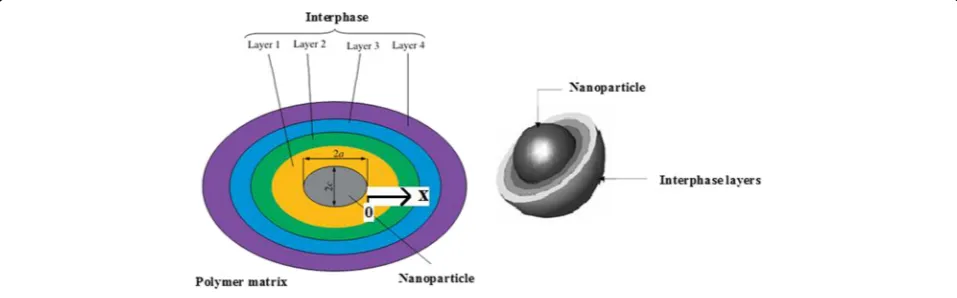
The general properties of the interphase between poly-mer matrix and nanoparticles such as coefficient of ther-mal expansion, stiffness, and strength depend on the properties of nanoparticles and polymer matrix. The interphase can be divided intonlayers, where each layer has different properties (Fig. 1). Assuming a same thick-ness for interphase layers, the thickthick-ness of the kth layer is expressed by:
tk¼ t
n ð1Þ
wheretis the total thickness of interphase.xchanges from a nanoparticle surface (x= 0) to polymer matrix (x=t). Thexfor central point of thekthlayer is given by:
xk¼ktk−t2k ð2Þ
In our previous work [20], it was reported that the tensile strength of interphase layers changes as a power function ofxkas:
σk¼σp− σp−σm
xk
t
Z
ð3Þ
where σm and σp are the tensile strength of matrix and nanoparticles, respectively, and Z is an interphase par-ameter which shows the properties of interphase. This equation is true for all polymer nanocomposites contain-ing well-dispersed nanoparticles. The average strength of interphase (σi) can be assumed as the tensile strength of the central layer, i.e.,σkatxk=t/2. Accordingly, σiis
de-fined as:
σi¼σp− σp−σm
0:5
ð ÞZ ð4Þ
From rearranging of the above equation, Z can be expressed as:
Z¼−1:44 ln σp−σi
σp−σm
ð5Þ
Pukanszky [21] suggested a model which relates the tensile strength of composites toBinterfacial parameter. Pukanszky model is stated as:
σR¼
1−φf
1þ2:5φf expðBφfÞ ð6Þ
where σR is the relative tensile strength as σc/σm (σc is the tensile strength of composite) and φf is the volume fraction of nanofiller. This model has been successfully applied for many types of polymer nanocomposites [22, 23]. This model can be well applied to nanocom-posites when ln σR1þ1−2:φ5fφf
vs. φf results in a line with B slope.
[image:2.595.58.537.568.717.2]B which shows the level of interfacial adhesion be-tween matrix and filler is presented as:
B¼ð1þAcρftÞln
σi
σm ð
7Þ
whereAc andρfare the specific surface area and density
of filler, respectively. By rearranging of the latter equa-tion,σican be formulated as:
σi¼σmexp B
1þAcρft
ð8Þ
Substituting Eq. 8 into Eq. 5 results in:
Z¼−1:44 ln σp−σm
exp 1þAB
cρft
σp−σm
2 4
3
5 ð9Þ
which relates the Z parameter to material and inter-facial/interphase characteristics.
Additionally, Ac can be defined for spherical (1),
lay-ered (2), and cylindrical (3) nanoparticles as:
Ac1¼A
m¼ A
ρfv
¼ρ4πr2
f43πr3
¼ρ3
fr
ð10Þ
Ac2¼A
m¼ A
ρfv
≅ 2l2
ρfl2d
¼ρ2
fd
ð11Þ
Ac¼ A
m¼ A
ρfv
¼ρ2πrl
fπr2l
¼ρ2
fr
ð12Þ
whereA,m,v, andlare the surface area, mass, volume, and length of particles, respectively. randdare also the radius and thickness of nanofiller.
By substituting Eqs. 10, 11, and 12 into Eq. 9, Z is expressed for different nanocomposites as:
Z1¼−1:44 ln
σp−σmexp 1þB3t r
σp−σm
2 4
3
5 ð13Þ
Z2¼−1:44 ln
σp−σmexp 1þB2t d
σp−σm
2 4
3
5 ð14Þ
Z3¼−1:44 ln
σp−σmexp 1þB2t r
σp−σm
2 4
3
5 ð15Þ
Additionally, the volume fractions of interphase in different polymer nanocomposites are given by:
φi1¼φf
rþt r
3
−1
ð16Þ
φi2¼φf
2t
d ð17Þ
φi3¼φf
rþt r
2
−1
ð18Þ
As a result, Bparameter is expressed by φiand φffor
dissimilar samples as:
B1 ¼ 3 φφi f
þ1
1=3
−2
" #
ln σi
σm ð
19Þ
B2 ¼ 1þφφi f
ln σi
σm ð
20Þ
B3 ¼ 2 φi
φf
þ1
1=2
−1
" #
ln σi
σm ð
21Þ
By rearranging Eqs. 19, 20, and 21,σican be expressed
for different nanocomposites as:
σi1¼σmexp B
3 φi φfþ1 1=3
−2 2 6 4 3 7
5 ð22Þ
σi2¼σmexp B
1þφi φf !
ð23Þ
σi3¼σmexp B
2 φi φfþ1 1=2
−1 2 6 4 3 7
5 ð24Þ
The Z parameter for different nanocomposites can be given by substituting Eqs. 22, 23, and 24 into Eq. 5 as:
Z1¼−1:44 ln
σp−σmexp B 3 φi
φfþ1
1=3 −2 0 B @ 1 C A
σp−σm
2 6 6 6 6 6 6 6 6 4 3 7 7 7 7 7 7 7 7 5
ð25Þ
Z2¼−1:44 ln
σp−σmexp 1þBφi φf
σp−σm
2 6 6 4 3 7 7
5 ð26Þ
Z3¼−1:44 ln
σp−σmexp B 2 φi
φfþ1 1=2
−1 0 B @ 1 C A
σp−σm
2 6 6 6 6 6 6 6 6 4 3 7 7 7 7 7 7 7 7 5
which correlate the Z parameter to volume fractions of nanofiller and interphase in polymer nanocomposites.
Results and Discussion
The effects of material and interphase properties on the
Z parameter are explained according to the proposed equations by contour plots which illustrate the Z as functions of different variables.
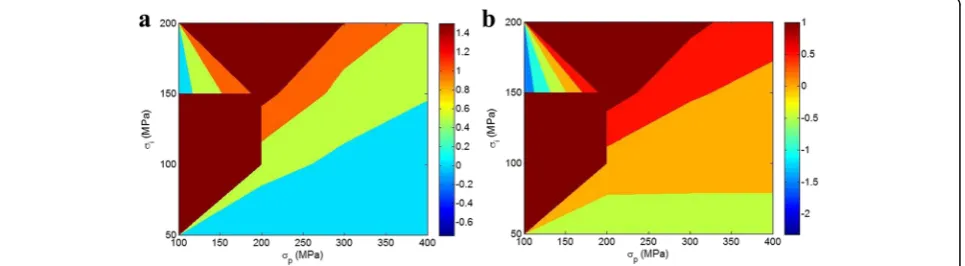
Figure 2 illustrates the effects of σp and σi on the Z
parameter (Eq. 5) at two various values of σm. At σm=
40 MPa (Fig. 2a), a high level ofZis commonly obtained by a high σi. It is understood that a strong interphase
and a high Zshow a direct relation which confirms the dependency of theZto interphase properties. Also, it is obvious that a high σp suggests a small Z. As a result,
the positive and negative roles of σiand σp inZ
param-eter are derived by this illustration.
The different effect of a very highσiand a very lowσp
onZis not correct, becauseσi>σpcannot be practically
occurred in polymer nanocomposites. The calculated Z
at σm= 80 MPa (Fig. 2b) also show similar values to
those ofσm= 40 MPa. Accordingly, a high Zis obtained
by high interphase strength (σi) and low level of σp at
different strength of matrix demonstrating the different influences ofσiandσponZparameter.
Figure 3 shows the Z parameter as a function of Ac
andBat twoσpvalues based on Eq. 9 atσm= 40 MPa,t
= 20 nm, andρf= 3 g/cm3. Atσp= 200 MPa (Fig. 3a), the
highest values ofZare obtained by the lowest level ofAc
atB= 6. The other values ofAcandBshow a decreased
Z parameter in this condition. The lowest values of Z
are also reported by very low B (B< 3) or by very high
Ac (Ac> 150 m2/g) at all extents of another parameter.
As a result, Ac andBshow dissimilar effects on the Z
parameter and the other factors which define the values of B such as t and σi (Eq. 7) determine the
final level of Z.
At σp= 300 MPa (Fig. 3b), it is found that both the
highest B value and the lowest Ac level cause the best
value of Z. Also, B< 4 or Ac> 120 m2/g suggests the
smallest Z value at all levels of another parameter. In this condition, an increase inAcand a decrease inB
re-duce the value of Z. It is obvious that the Ac plays a
negative role in the value of Z at different σp, but the
high levels of Bparameter show various Z attributed to the value ofσp. Therefore, the value ofσpplays a critical
role in the final level ofZ at different Ac and Bextents.
The Z parameter shows a direct link with B parameter which expresses the level of interfacial adhesion in nano-composite. Additionally, the high levels of Z and B sig-nificantly increase the level of σR in polymer
nanocomposites (see Eqs. 4 and 6). So, the expression of
Zparameter as an interphase parameter is true.
The effects of r and t on the Z parameter in nano-composites containing spherical nanoparticles (Eq. 13) are illustrated in Fig. 4 at B= 5, σm= 40 MPa, and
different σp. In the first state in Fig. 4a (σp= 150 MPa
such as for SiO2), a negative Z is calculated by bigger
nanoparticles and thin interphase (low t). The best levels of Z are obtained when both rand t have simi-lar values. It means that the bigger nanoparticles show a great Z by a thick interphase, while the smal-lest nanoparticles can introduce a good Z by a thin interphase (less t). This evidence demonstrates that the smaller nanoparticles and the thicker interphase can suggest a high Z parameter in this condition. The smaller nanoparticles make a large interfacial area be-tween polymer and nanoparticles, and a thick inter-phase provides a high level of B (see Eq. 7). Therefore, they can improve the mechanical proper-ties of nanocomposites which may be expressed by a high Z parameter in this study.
The effects ofrandtonZparameter are also plotted in Fig. 4b whenσp= 360 MPa such as for TiO2. In this
condi-tion, the negative effect of bigger nanoparticles onZ par-ameter is also illustrated similar to the previous situation, but thetplays different role compared to the former con-dition. In this state, the best levels ofZare achieved byr
= 10 nm andt= 5 nm,r= 20 nm andt= 10 nm, and the bigger nanoparticles at medium level oft(14 <t< 21 nm).
[image:4.595.58.541.580.713.2]These observations indicate that the size of nanoparti-cles and interphase differently affect the Z parameter based on the value of σp. In other words, a highσp
[image:5.595.58.540.87.229.2]dic-tates different roles for nanoparticle size and interphase thickness in the level of Z parameter. Accordingly, an optimization should be performed in this case based on the type of nanofiller used in nanocomposite.
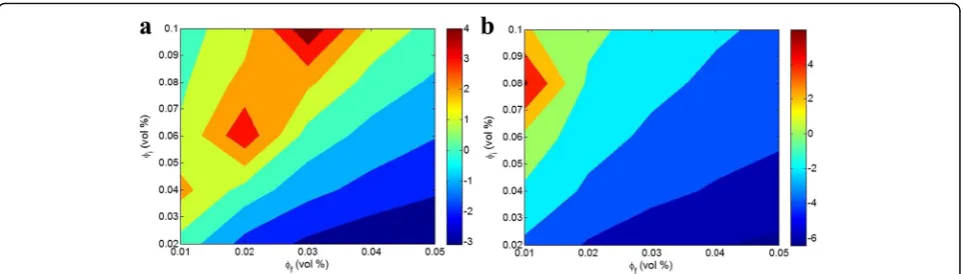
Figure 5 illustrates the roles ofφiandφfinZparameter
for nanocomposites reinforced with cylindrical nanofiller (Eq. 27) at σm= 40 MPa, σp= 200 MPa, and different B
values. WhenB= 5 (Fig. 5a), the high fractions of nanofil-ler as well as the low contents of interphase produce a negativeZvalue. Also, very highφiand very lowφfwhich
create a low Z are not practically obtained in polymer nanocomposites (see Eqs. 16, 17, and 18). In this condition (B= 5), the best values of Z are found at high φi and
medium values of φf. The predictions of this illustration
are correct from practical points of view. A highφi
posi-tively contributes to the strengthening of polymer nano-composite, due to the main role of the interphase properties in the final behavior of polymer nanocompos-ites [14, 24]. Also, a high φf typically introduces
undesir-able properties in nanocomposites, due to the aggregation of nanoparticles at high contents which decreases the
interfacial area and promotes the stress concentration in polymer nanocomposites [25, 26].
At B= 8 (Fig. 5b), the same roles of φf and φi in Z
value are also shown. However, a high φi at the lowest
level ofφfcauses the best Z, while the former condition
(B= 5) exhibits the best values of Z at high φi and
medium values ofφf. This occurrence gives the different
effects of φiand φfon Zparameter attributed to B
par-ameter. Conclusively, the value ofBplays a main role in the calculated results of Z by the suggested equations which should be considered in experiments.
Conclusions
The Z interphase parameter for the tensile strength of interphase layers was expressed by material and inter-phase properties. The Pukanszky model for tensile strength of polymer nanocomposites was applied, and the dependency of Z to characteristics of constituents and interphase were explained by contour plots.
The main results reported in this article can be sum-marized as:
Theσiandσpshow positive and negative roles inZ parameter at all values ofσm, respectively.
Fig. 3Zparameter as a function ofAcandBby Eq. 9 atσm= 40 MPa,t= 20 nm,ρf= 3 g/cm3andaσp= 200 MPa andbσp= 300 MPa
[image:5.595.54.539.567.703.2]TheσiandBreveal direct links withZparameter. TheAcplays a negative role inZvalue at different
σp, but the dependency ofZtoBparameter is associated with the value ofσp. Therefore,σpaffects the final level ofZat differentAcandB.
Thedandtaffect theZparameter based on the value ofσpin different manners. A highσpcauses different roles for nanoparticle size and interphase thickness inZparameter.
The volume fractions of nanofiller and interphase dissimilarly affect theZparameter. A highZis obtained by a low nanoparticle volume fraction and a high content of interphase, but the bestZis obtained based on the level ofBparameter.
Abbreviations
φf:Volume fraction of filler;Ac: Specific surface area of filler;B: Interfacial adhesion parameter;d: Thickness of nanofiller;kth: Number of interphase
layer;r: Filler radius;t: Total thickness of interphase;x: Distance;Z: Interphase parameter;ρf: Density of filler;σc: Tensile strength of composite;σi: Strength
of interphase;σm: Tensile strength of matrix;σp: Tensile strength of filler;
σR: Relative strength
Funding
No funding.
Authors’Contributions
Both authors contributed to the calculations and discussion. Both authors read and approved the final manuscript.
Competing Interests
The authors declare that they have no competing interests.
Author details
1Young Researchers and Elites Club, Science and Research Branch, Islamic Azad University, Tehran, Iran.2Department of Mechanical Engineering, College of Engineering, Kyung Hee University, Yongin 446-701, Republic of Korea.
Received: 23 November 2016 Accepted: 26 December 2016
References
1. Bershtein V, Fainleib A, Egorova L, Gusakova K, Grigoryeva O, Kirilenko D et al (2015) The impact of ultra-low amounts of amino-modified MMT on dynamics and properties of densely cross-linked cyanate ester resins. Nanoscale Res Lett 10(1):1
2. Zare Y (2016) Shear, bulk, and Young’s moduli of clay/polymer nanocomposites containing the stacks of intercalated layers as pseudoparticles. Nanoscale Res Lett 11(1):479
3. Ganguly A, Bhowmick AK (2007) Sulfonated styrene-(ethylene-co-butylene)-styrene/montmorillonite clay nanocomposites: synthesis, morphology, and properties. Nanoscale Res Lett 3(1):36
4. Deka H, Karak N (2009) Vegetable oil-based hyperbranched thermosetting polyurethane/clay nanocomposites. Nanoscale Res Lett 4(7):758
5. Rudko G, Kovalchuk A, Fediv V, Chen WM, Buyanova IA (2015) Enhancement of polymer endurance to UV light by incorporation of semiconductor nanoparticles. Nanoscale Res Lett 10(1):1
6. Hu B, Hu N, Li Y, Akagi K, Yuan W, Watanabe T et al (2012) Multi-scale numerical simulations on piezoresistivity of CNT/polymer nanocomposites. Nanoscale Res Lett 7(1):1–11
7. Chouit F, Guellati O, Boukhezar S, Harat A, Guerioune M, Badi N (2014) Synthesis and characterization of HDPE/N-MWNT nanocomposite films. Nanoscale Res Lett 9(1):1
8. Souier T, Santos S, Al Ghaferi A, Stefancich M, Chiesa M (2012) Enhanced electrical properties of vertically aligned carbon nanotube-epoxy nanocomposites with high packing density. Nanoscale Res Lett 7(1):1 9. Carabineiro SA, Pereira MF, Pereira JN, Caparros C, Sencadas V,
Lanceros-Mendez S (2011) Effect of the carbon nanotube surface characteristics on the conductivity and dielectric constant of carbon nanotube/poly (vinylidene fluoride) composites. Nanoscale Res Lett 6(1):1–5
10. Zare Y, Garmabi H (2015) Thickness, modulus and strength of interphase in clay/polymer nanocomposites. Applied Clay Science 105:66–70
11. Zare Y (2016) A two-step method based on micromechanical models to predict the Young’s modulus of polymer nanocomposites. Macromolecular Materials and Engineering 301:846–852
12. Zare Y (2015) Assumption of interphase properties in classical Christensen– Lo model for Young's modulus of polymer nanocomposites reinforced with spherical nanoparticles. RSC Advances 5(116):95532–95538
13. Zare Y (2016) Development of Halpin-Tsai model for polymer nanocomposites assuming interphase properties and nanofiller size. Polymer Testing 51:69–73
14. Rafiee R, Pourazizi R (2014) Influence of CNT functionalization on the interphase region between CNT and polymer, Computational Materials Science
15. Zare Y (2015) A simple technique for determination of interphase properties in polymer nanocomposites reinforced with spherical nanoparticles. Polymer 72:93–97
16. Romanowicz M (2010) Progressive failure analysis of unidirectional fiber-reinforced polymers with inhomogeneous interphase and randomly distributed fibers under transverse tensile loading. Compos Part A Appl Sci Manuf 41(12):1829–1838
17. Zare Y (2016) Modeling the strength and thickness of the interphase in polymer nanocomposite reinforced with spherical nanoparticles by a coupling methodology. J Colloid Interface Sci 465:342–346
18. Zare Y (2016) Modeling the yield strength of polymer nanocomposites based upon nanoparticle agglomeration and polymer–filler interphase. J Colloid Interface Sci 467:165–169
Fig. 5Zparameter as a function ofφiandφffor nanocomposites reinforced with cylindrical nanofiller (Eq. 27) atσm= 40 MPa,σp= 200 MPa and
[image:6.595.58.540.87.224.2]19. Boutaleb S, Zaïri F, Mesbah A, Naït-Abdelaziz M, Gloaguen J-M, Boukharouba T et al (2009) Micromechanics-based modelling of stiffness and yield stress for silica/polymer nanocomposites. International Journal of Solids and Structures 46(7):1716–1726
20. Zare Y (2016) Modeling approach for tensile strength of interphase layers in polymer nanocomposites. J Colloid Interface Sci 471:89–93
21. Pukanszky B (1990) Influence of interface interaction on the ultimate tensile properties of polymer composites. Composites 21(3):255–262
22. Rostami M, Mohseni M, Ranjbar Z (2012) An attempt to quantitatively predict the interfacial adhesion of differently surface treated nanosilicas in a polyurethane coating matrix using tensile strength and DMTA analysis. International Journal of Adhesion and Adhesives 34:24–31
23. Zare Y (2016) Study on interfacial properties in polymer blend ternary nanocomposites: role of nanofiller content. Comput Mater Sci 111:334–338 24. Jahanmard P, Shojaei A (2015) Mechanical properties and structure of
solvent processed novolac resin/layered silicate: development of interphase region. RSC Advances 5(98):80875–80883
25. Zare Y (2016) Study of nanoparticles aggregation/agglomeration in polymer particulate nanocomposites by mechanical properties. Compos Part A Appl Sci Manuf 84:158–164
26. Kallay N,Žalac S (2002) Stability of nanodispersions: a model for kinetics of aggregation of nanoparticles. J Colloid Interface Sci 253(1):70–76
Submit your manuscript to a
journal and benefi t from:
7Convenient online submission
7Rigorous peer review
7Immediate publication on acceptance
7Open access: articles freely available online
7High visibility within the fi eld
7Retaining the copyright to your article