The Impact of Different Market Transparency
Standards on the Success of Momentum Strategies
Using the Example of the German Stock Market
Katharina Beyenburg1, Dirk Braun2,*, Lina Kuckelkorn3
1Department of Business Administration, FOM University of Applied Sciences, Campus Cologne, Germany 2Department of Business Administration, FOM University of Applied Sciences, Campus Aachen, Germany
3Faculty of Business Sciences & Economics, RWTH Aachen University, Aachen, Germany
Copyright©2018 by authors, all rights reserved. Authors agree that this article remains permanently open access under the terms of the Creative Commons Attribution License 4.0 International License
Abstract
This study primarily focuses on the explanation of momentum effects regarding different transparency standards of particular stock segments.Based on theories of efficient markets and information diffusion it can be expected that a momentum can rather be observed in those stock segments which do not require high transparency obligations. Regarding the results of this study on the effect of transparency, no significant correlation can be proven for the intensity of transparency obligations and the level of the momentum. Hence, the theory on the intensity of transparency obligations affecting the level of the momentum has to be rejected. However, it has to be pointed out that in contrary to the theoretical assumption, the momentum of Prime Standard has not only been most constant but also highest. Especially in times of strong market turbulences, high volatility and uncertainties in the market, investors seem to invest in titles which show highest transparency and for which a lot of public information is accessible. Thus, they regard stocks of Prime Standard as security values.Keywords
Momentum Strategy, Market Transparency Standards, German Stock Market Performance, Information Asymmetry, Stock Market Anomalies, Stock Market Volatility1. Introduction
Neoclassical theory turns out to be the predominating assumption in the assessment of capital market titles such as stocks, since it has significantly influenced further explanatory approaches. [1] Among other things, it assumes efficient markets and rational participants. Hence, current asset prices contain all information that influences
the market environment. [2-4] However, neoclassical theory is often put into question, since several anomalies on the capital market contradict it.
This paper focuses on the momentum effect, which can often be proven in equity markets. [5, 6] In the awareness of this anomaly, a so-called momentum strategy for speculative (short-term) equity investments is derived which takes into account the expectations of market participants regarding future share performances. [7, 8] On the basis of past studies, this paper examines the realization of this strategy in the German stock market for a time period from 2005 to 2015. For the first time, different market transparency standards are taken into account.
2. Theoretical Background
Following the argumentation of neoclassical capital market theory, no anomalies would exist in capital markets, since e.g. equity markets would be flawless. Hence, the market price of a stock would reflect rational expectations regarding future cash flows at any time. [2] Systematic deviations like under- or overreactions could thus be excluded. [4] If the neoclassical approach is taken as a basis, modern financial markets will be confronted with several anomalies from various directions [9, 10] because systematic deviations of market prices from fundamentally justified values can be observed repeatedly. [11, 12]
the result that in short-term previously well-performing stocks will continue winning and previously low- performing stocks will continue losing. [14] Literature explains this effect especially with herd mentality [15, 16] and lagged information processing by market participants. [17, 18]
In the awareness of this anomaly, the rule of relative strength can be derived. [5] Momentum strategies are based on this theory. [19] The model of relative strength implies that stocks are not measured by benchmarks but by the stock’s performance. [5, 20] This means that a correlation of stock performance is assumed which implies that stocks, which have developed above average in a certain period of time, will continue to do so in the future due to trend- following. As a consequence, stocks, which have under-performed in this time period, develop to the contrary. [8, 19] Hence, an investor who anticipates this development is likely to follow a pro-cyclical investment [13] which is based on the fact that market participants need a longer time period to process new information and implement them into their investment- and trade strategies
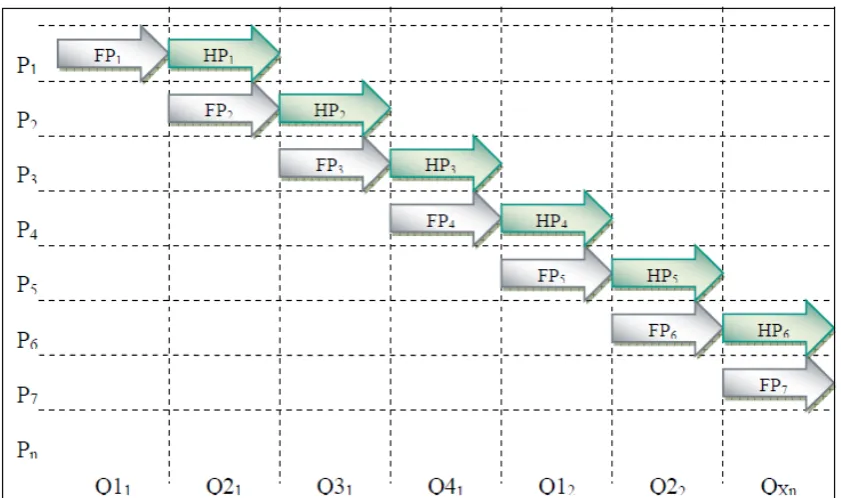
reliably, especially when they contradict to their individual opinion. [11, 19] Furthermore, herd mentality has been identified to support the momentum effect because market participants follow a trend consciously or unconsciously to eliminate their own insecurities. [14] This is why the momentum strategy could be equivalent to the systematic implementation of the rule of thumb “the trend is your friend”. Applying the momentum strategy, market participants do not make their investment decisions based on a company’s fundamental values but based on past development of the corresponding stock. [20] To gain the highest possible excess returns market participants choose stocks which have outperformed in the past time period (analogue to the model of relative strength). Therefore, a so-called formation period (FP) is defined at first. The performance in FP is crucial for the investment in winning stocks that are bought or held in the so-called holding period (HP). HP comprises the same time period as FP or more. After stocks have been held for one HP, new winning stocks are classified and held for the following time period. [8] Figure1 shows this classification:
3. Literature Review
In the past, the existence and characteristics of momentum effects have been investigated throughout different observation periods and with different emphases. Hereafter, an overview over the current state of knowledge is given. As a result, the existing research gap or rather the desired findings are being derived.
Several studies have shown a systematic excess return of a pro-cyclical momentum strategy amounting to 5-15% over all market segments and different time periods in an observation period from 1926-2003. [5, 6, 21, 22] Comparable effects could be proven for different European stock markets in an observation period from 1961-2011. [7, 8, 23, 24] Furthermore, momentum effects have been validated for investment funds [15] and different industries. [25] Other investigated coherences show for example the grade of investors’ overconfidence [26], the correlation of momentum with previous trading volumes [27], risk adjustments [22] and the ability to predict momentum crashes [22] as well as the presentation of hidden risks of such a strategy. [28]
Furthermore, several studies dealt with the question of an optimal momentum strategy to reach the highest possible excess return depending of the duration of formation and holding periods. According to those studies, stable trends last for 12-15 months. This is why several authors derive optimal formation periods of 3-6 months and optimal holding periods of 6-9 months. [7, 13, 29, 30] Current research states the supply and processing of information to be one of the most important factors, which is why it has been a popular research subject in the past. Thus, the momentum effect is stated to be an under-reaction in processing available information. [22, 31- 33] These studies argue that the optimal choice of formation and holding periods crucially depends on the processing of information in individual markets.
4. Research Gap and Hypotheses
Based on previous research findings, this paper examines the application of a momentum strategy regarding transparency on the German stock market. It examines different forms of the momentum effect depending on different transparency standards of the German stock market’s trading segments. Therefore, different information asymmetries might exist. The examined time period is 2005-2015. In this time period, the German stock market was divided into three segments: Prime Standard, General Standard and Entry Standard. These are examined regarding the existence of a momentum, its level and its duration.
Since literature regards the momentum effect as a proven anomaly in the capital market, the first hypothesis states that there is a corresponding effect in all three market segments during the examined time period:
H1: Momentum per market segment > 0
Furthermore, all three segments of the German stock market are especially examined towards their transparency and its impact on the momentum effect. The studies of Hong/Stein [32] and Hong/Lim/Stein [33] developed and tested a model which deals with the diffusion of information. From these studies it can be concluded that stocks, whose information spreads slower, show a higher momentum since there is an under-reaction to information of these companies. From this, the second hypothesis is being derived. It states that the higher the transparency standard of the segment in which the stock is traded, the quicker the information relevant to the stock spreads and accordingly, the momentum effect is lower:
H2: Level momentum Prime Standard < level momentum General Standard < momentum Entry Standard
At this point we would like to state that the requirements for information transparency and the publication of information are highest in Prime Standard. Companies whose stocks are listed in Prime Standard are obliged to publish all information in German and English whereas companies whose stocks are listed in General and Entry Standard only have to publish information in German. In general, the obligation to the publication of information in Entry Standard is very low. [34] This is why it is assumed that information about companies in Prime Standard spreads quicker than those regarding General or Entry Standard. Hence, the level of momentum should be lowest in Prime Standard. General Standard has second-highest requirements and thus, Entry Standard has to fulfill the lowest requirements of the three segments. This is the reason for the sequence of H2.
The third and last hypothesis examines the duration of the momentum effect. The model of information diffusion assumes that the slower the information of a stock spreads the higher is the momentum. It might also come to a longer period of under-reaction. [32, 33] This study considers the momentum to spread slower the lower the transparency obligations for the particular stock segment are. This is why in Entry Standard the momentum should not only be higher than in General and Prime Standard but should also span a longer observation period:
H3: Duration momentum Prime Standard < duration momentum General Standard < duration momentum entry Standard
5. Data Selection and Methodology
prices of Prime, General and Entry Standard are needed on the one hand. On the other hand, we require the calculated performance of these closing prices in different ranges. The performance of a stock is being calculated for four holding periods respectively: three, six, nine and twelve months. The formation period is always three months. This approach corresponds to past studies. [7, 35, 36] The analysis over four holding periods aims at the determination of a momentum’s duration and therefrom the derivation of the optimal ratio of formation and holding periods. Thus, 44 performance time series over four periods per segment result for the observation period from 2005-2015. This period has been chosen due to the fact that the three stock segments existed in this period of time and all needed stock dates are available. Additionally, an observation period of 11 years represents empirical statistic relevance. Thus, general validity can be concluded from the findings of the special sample. The analysis only takes into account stocks whose data were available for the whole observation period and which can be matched to the German stock market (selection via German identification number). The result is an adjusted data base of 348 stocks: 199 in Prime Standard, 114 in General Standard and 35 in Entry Standard.
In the first place, the adjusted database is examined towards the existence of a momentum. Therefore, the performance of the thee-month formation period for 44 single periods in the time period from 2005-2015 is calculated. Per formation period, 10% of those stocks are chosen which are part of the best (winner) and worst (loser) of all stocks, as measured by their performance in the formation period. These stocks are then being held for a period of three, six, nine and twelve months. The average performance per holding period is calculated. The shares are held equally weighted in the portfolios. By the means of the average performance, a course of time can be outlined which can determine the duration of a potential momentum as well as possible under- or overreactions for the whole observation period. For this purpose, measures of central tendencies such as maximum, minimum, median, arithmetic mean, quartiles as well as the correlation of data are examined. Performance data of the individual stock segments’ four holding periods are being tested towards coherence and content of information. Afterwards, the determined correlation is being tested towards significance. Therefore, the correlation of the individual variables “winner”, “loser” and “index” are tested against each other separately. The statistical analysis is completed by the Shapiro Wilk test for normal distribution. This test is made for each time line individually. The Shapiro Wilk test is a test for significance which examines the assumption that the underlying population of a sample is normally distributed. [37]
6. Results
Hereafter, the central results of the data evaluation with
[image:4.595.301.542.134.326.2]regard to the three hypotheses are presented. At first, the average performance of winning and losing stocks is determined and compared to the average performance of the respective stock segment. Tables 1-3 show the results:
Table 1. Momentum Prime Standard
HP in months HP 3 HP 6 HP 9 HP 12 winner 3,69 8,79 14,16 18,48 loser 1,96 5,51 7,85 11,41 average performance 2,87 6,38 9,97 13,92
Table 2. Momentum General Standard
HP in months HP 3 HP 6 HP 9 HP 12 winner 2,87 -1,11 0,86 3,64
loser 10,91 15,43 16,80 13,15 average performance 4,22 7,24 8,47 10,04
Table 3. Momentum Entry Standard
HP in months HP 3 HP 6 HP 9 HP 12 winner 0,62 2,43 2,91 3,69
loser 2,32 2,13 7,15 6,84 average performance 1,57 3,05 4,42 5,50
[image:4.595.305.542.417.552.2]For winning as well as for losing stocks a positive momentum could be proven for all market segments and holding periods (with one exception) throughout the observation period. Thus, the first hypothesis can be validated. Momentum effects can therefore be observed for younger review periods as well, as illustrated in figures 2 and 3.
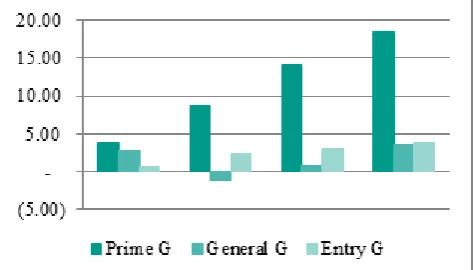
[image:4.595.305.542.593.730.2]Figure 2. Momentum of winning portfolios (winner) of Prime, General and Entry Standard in comparison per average
However, the second hypothesis has to be rejected. The first part of this hypothesis implied the momentum to be lowest in Prime Standard. This could not be proven. The momentum of winning stocks in Prime Standard has even turned out to be highest on average. The highest momentum for losing stocks could be proven for General Standard. The second part assumed complete order. This could also not be validated regarding transparency obligations since the order of the average momentum for winning stocks turns out to be inconsistent:
Momentum Prime Standard 11.28% > Momentum General Standard 1,57% < Momentum Entry Standard 2,41%.
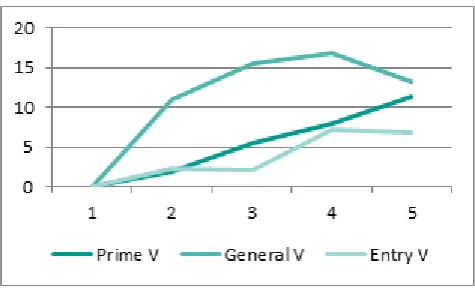
[image:5.595.301.541.162.236.2]The third hypothesis has to be rejected as well, for both, winning and losing stocks, because the duration of a momentum for winning stocks in the observation period is equal for all three stock segments. Additionally, the duration of a momentum seems to be shorter in General and Entry Standard than in Prime Standard for losing stocks, as to be shown in the following figures 4 and 5.
Figure 4. Momentum of winning portfolios (winner) of Prime, General and Entry Standard in comparison in time course
Figure 5. Momentum of losing portfolios (loser) of Prime, General and Entry Standard in comparison in time course
Subsequent statistical evaluation could furthermore prove a significantly positive correlation of winning and losing stocks as well as of the index. The strongest positive correlation of those variables could be observed in Prime Standard with values between 0.67-0.91. General Standard showed second-highest correlation. The values ranged
[image:5.595.57.290.322.466.2]from 0.29 to 0.78. The weakest correlation of variables could be observed in Entry Standard. In this stock segment, values ranged from 0.19 to 0.8 throughout all holding periods. Table 4 provides an overview over the particular correlations:
Table 4. Correlation matrix for all stock segments and holding periods Market Standard Prime General Entry
3 months HP 0,75-0,92 0,34-0,78 0,19-0,75 6 months HP 0,67-0,90 0,29-0,64 0,19-0,75 9 months HP 0,71-0,91 0,42-0,70 0,25-0,80 12 months HP 0,69-0,89 0,42-0,69 0,30-0,73
The strong positive correlation of stocks in the different segments speaks for the fact that there is a dependency between the development of a momentum for winning and losing stocks. The dependency seems to be highest in Prime Standard and decreasing with declining transparency obligations.
After that, the data was tested for normal distribution. Regarding the average of the individual stock segments, normal distribution can be assumed. Generally speaking, normal distribution can also be assumed for the performance distribution of winning and losing stocks as well as for the index of the individual stock segments. The only exception is the performance of winning stocks in General Standard. An average value of 0.02 can be observed here, which lies below the significance level α = 0,05. Table 5 shows the average values of the Shapiro Walk Test for normal distribution.
Table 5. Correlation matrix for all stock segments and holding periods Market Standard Winner Loser Index
Prime 0,56 0,07 0,42 General 0,02 0,12 0,22 Entry 0,62 0,25 0,12
7. Discussion and Conclusions
[image:5.595.57.295.499.644.2]were defined with regard to the intensity of transparency obligations. It was assumed that momentum effects prove to be shorter and less pronounced the higher transparency obligations are. This assumption was based on models and past studies. For instance, Hong and Stein [32] established the theory that private information spreads slower than public information and thus leads to a longer and stronger overreaction in the market. They proved their idea empirically in another study. [33]
Nevertheless, the examinations of this study could not prove longer overreactions for stock segments with less public accessible information. A longer momentum could not be proven for those stock segments as well. Hong, Lim and Stein [33] examined the American stock market which is why a deviation from the German stock market is certainly possible. An alternative explanatory approach could be the high volatility of the German stock market within the observation period. January 2008, August 2011 and August 2015 showed exceptionally strong negative developments whereas stocks developed strongly positive in January, February and October 2015.
Regarding the strong volatility of the market within the observation period, the results of this study can be compared to those of Daniel and Moskowitz [22]. For a time period of 1927 to 2013 they proved that in the American stock market the momentum effect does not generate a positive momentum if the market shows a phase of high volatility. In those times, losing portfolios would even gain higher revenues than winning portfolios. Those so-called momentum crashes could be observed for General and Entry Standard in the present examination. Meanwhile, the momentum strategy could successfully be implemented in Prime Standard. These results indicate that Prime Standard is more resistant to the effects of volatility and thus is not significantly influenced by those. Hence, the implementation of a momentum strategy only works limitedly in times of high volatility like the examined observation period. Even though a positive return can be generated, higher returns are possible with an investment in losing portfolios in stock segments with low transparency obligations. Regarding the results on the effect of transparency, no significant correlation can be proven for the intensity of transparency obligations and the level of the momentum. Hence, the theory on the intensity of transparency obligations affecting the level of the momentum has to be rejected. However, it has to be pointed out that in contrary to the theoretical assumption, the momentum of Prime Standard has not only been most constant but also highest. Especially in times of strong market turbulences, high volatility and uncertainties in the market, investors seem to invest in titles which show highest transparency and for which a lot of public information is accessible. Thus, they regard stocks of Prime Standard as security values. Referring to the idea of regarding the momentum effect as a kind of herd mentality to eliminate insecurities of the investors [14, 16] this action
coincides with comparably insecure times like these.
8. Possible Implementation in Trading
Strategies
A deduction for specific trading strategies or recommended actions for institutional and private investors, which can be derived from the findings of this study, could be the fact that a momentum in the standard values of a stock market turns out to be highest and more persistent especially in volatile market phases. Thus, salient reporting in combination with the size of the companies seem to result in a stronger feeling of control of (private) investors. [11, 21] An investor could anticipate this trend and reallocate his portfolio to standard values with a positive momentum when volatility in markets increases. [13, 24] However, these market phases come along with a higher risk of momentum crashes. [8, 22] This is why the investor should closely monitor the development of his portfolio.
In general, it can be stated that this study - in analogy with several preliminary studies [23, 26, 27, 29] - also shows that good momentum strategies still yield excess returns as compared to their benchmark. Nevertheless, the realization of a momentum strategy for individual investors (especially without access to databases to run a market analysis and knowledge of statistical programs to determine efficient portfolios) come along with high expenditures for cost and control since a market analysis for the identification of losing and winning stocks and a (partial) reallocation of the portfolio have to be conducted approximately every three months. [cf. previous statements in section 5 of this article and reference 13] This is why relevant funds (so-called „momentum funds“) can be a good investment alternative for private investors which are convinced of the momentum effect in markets. Several investment companies hold respective funds. [38]
REFERENCES
[1] Barberis, N., Thaler, R. (2003). A survey of behavioral finance. Handbook of the Economics of Finance, 1, 1053-1128.
[2] Fama, E. F. (1970). Efficient capital markets: A review of theory and empirical work. The journal of Finance, 25(2), 383-417.
[3] Rau, R. (2010): Market Inefficiency, in Baker, K.; Nofsinger, J. (Hrsg.): Behavioral Finance – Investor, Corporations and Markets, 333-350.
[4] Daxhammer, R.J., Fascar, M. (2012): Behavioral Finance - verhaltenswissenschaftliche Finanzmarktforschung im Lichte begrenzt rationaler Marktteilnehmer, UVK Lucius Konstanz.
Investment Selection. The Journal of Finance, 22(4), 595-610.
[6] De Bondt, W. F., Thaler, R. (1985). Does the stock market overreact? The Journal of finance, 40(3), 793-805.
[7] Rouwenhorst, K. G. (1998). International momentum strategies. The Journal of Finance, 53(1), 267-284.
[8] Holtfort, T., Martin, T. (2011): Efficient Momentum Portfolios – An empirical Analysis of the German Stock Market. Corporate Finance biz, 2011(7), 414-420.
[9] Haugen, R.A. (1999): The Inefficient Stock Market, New Jersey: Prentice Hall, 2008.
[10]Kahneman, D. (2011). Thinking, Fast and Slow. Farrar, Straus and Giroux.
[11]Goldberg, J., von Nitzsch, R. (2004). Behavioral finance: Gewinnen mit Kompetenz. Finanz Buch Verlag Frankfurt. [12]Kampshoff, P., von Nitzsch, R., Braun, D. (2012): Herding
Behaviour of Investors after the Disclosure of Individual Short Positions: Evidence from the Japanese Stock Market, in: Journal of International Business and Economics (JIBE), 12(2), 1-15.
[13]Holtfort, T., Nelles, M., Užik, M. (2007): Rollierende Momentum-Strategien am deutschen Aktienmarkt. Finanz Betrieb, 2007(7-8), 444-449.
[14]Guo, Z. (2002): Behavioral Finance: Die empirische Überprüfbarkeit behavioraler Modelle, Sankt Gallen: HSG (Dissertation, Universität St. Gallen, 2002)
[15]Grinblatt, M., Titman, S., Wermers, R. (1995). Momentum investment strategies, portfolio performance, and herding: A study of mutual fund behavior. The American economic review, 1088-1105.
[16]Wermers, R. (1999). Mutual fund herding and the impact on stock prices. the Journal of Finance, 54(2), 581-622. [17]Heuser, U. (Humanomics, 2008): Humanomics - Die
Entdeckung des Menschen in der Wirtschaft, Frankfurt: Campus Verlag, 2008
[18]Cooper, M. J., Gutierrez, R. C., Hameed, A. (2004). Market states and momentum. The Journal of Finance, 59(3), 1345-1365.
[19]Parplies, S., Westermann, F. (2016): Momentum-Strategie: Sieben Aktien, die jetzt durchstarten,
http://www.finanzen.net/nachricht/aktien/Euroam-Sonntag-Titel-Momentum-Strategie-Sieben-Aktien-die-jetzt-durchst arten-4920477, Zugriff 2017-02-18.
[20]Cutler, D.M., Poterba, J.M., Summers, L. H. (1990): Speculative Dynamics and the Role of Feedback Traders. American Economic Review, 80(2), 63-68.
[21]Jegadeesh, N., Titman, S. (2001): Profitability of Momentum Strategies: An Evaluation of Alternative Explanations. The Journal of Finance, 56(2), 699-720. [22]Daniel, K., Moskowitz, T. J. (2016). Momentum crashes.
Journal of Financial Economics, 122(2), 221-247.
[23]Schiereck, D., De Bondt, W., Weber, M. (1999). Contrarian and momentum strategies in Germany. Financial Analysts Journal, 55(6), 104-116.
[24]August, R., Schiereck, D., Weber, M. (2000).
Momentumstrategien am deutschen Aktienmarkt: Neue empirische Evidenz zur Erklärung des Erfolgs (No. 35294). Darmstadt Technical University, Department of Business Administration, Economics and Law, Institute for Business Studies.
[25]Moskowitz, T. J., Grinblatt, M. (1999). Do industries explain momentum?. The Journal of Finance, 54(4), 1249-1290. [26]Daniel, K., Hirshleifer, D., Subrahmanyam, A. (1998):
Investor Psychology and Security Market Under- and Overreactions. The Journal of Finance, 53 (6), 1839-1885. [27]Lee, C., Swaminathan, B. (2000). Price momentum and
trading volume. The Journal of Finance, 55(5), 2017-2069. [28]Daniel, K., Jagannathan, R., Kim, S. (2012). Tail risk in
momentum strategy returns (No. w18169). National Bureau of Economic Research.
[29]Jegadeesh, N., Titman, S. (1993). Returns to buying winners and selling losers: Implications for stock market efficiency.
The Journal of finance, 48(1), 65-91.
[30]Bernard, V., Thomas, J., Wahlen, J. (1997): Accounting-Based Stock Price Anomalies: Separating Market Inefficiencies from Risk. Contemporary Accounting Research, 14(2), 89-136.
[31]Chan, L. K., Jegadeesh, N., Lakonishok, J. (1996). Momentum strategies. The Journal of Finance, 51(5), 1681-1713.
[32]Hong, H., Stein, J.C. (1999): A Unified Theory of Underreaction, Momentum Trading, and Overreaction in Asset Markets. The Journal of Finance, 54 (6), 2143-2184. [33]Hong, H., Lim, T., Stein, J.C. (2000): Bad News Travels
Slowly: Size, Analyst Coverage, and the Profitability of Momentum Strategies. The Journal of Finance, 55 (1), 265-295.
[34]Deutsche Börse (2016): EU-regulierter Markt: Prime Standard – Wesentliche Zulassungsvoraussetzungen und Folgepflichten,
http://www.deutsche-boerse-cashmarket.com/blob/1564348 /2049a696a04a7387a0c42d12debdd48b/data/Factsheet--Pri me-Standard-fuer-Aktien.pdf, 2017-04-23.
[35]Chan, L. K., Jegadeesh, N., Lakonishok, J. (1999). The profitability of momentum strategies. Financial Analysts Journal, 55(6), 80-90.
[36]Jegadeesh, N., Titman, S. (2002). Cross-sectional and time-series determinants of momentum returns. The Review of Financial Studies, 15(1), 143-157.
[37]Wollschlager, D. (2012): Grundlagen der Datenanalyse mit R – Eine Anwenderorientierte Einführung, 2. Ed., Springer-Verlag Berlin.