Push-to-Talk over LTE Modeling and
Performance Evaluation
Hisham Zorghani*, Ivica Kostanic
Department of Electrical and Computer Engineering, Florida Institute of Technology, USA
Copyright©2019 by authors, all rights reserved. Authors agree that this article remains permanently open access under the terms of the Creative Commons Attribution License 4.0 International License
Abstract
Public Safety organizations play a vital role in disaster recovery and public protection. First responders rely on their communication systems to perform their mission. Their communication systems are considered mission critical which puts special requirements on their underlying enabling technologies. Nowadays, most of the communication systems used in public safety are narrowband and were mainly developed for voice communication. Push-to-Talk is a multicast (group call) half-duplex type of communication that emergency first responders heavily rely on. When first responders request to speak by pushing the button on their handset, during emergencies, they must be confident that their requests will go through and not blocked. LTE technology has been chosen in many countries, including the US, to be the platform for the next generation public safety communication systems. LTE is a broadband wireless communication technology that public safety communication may benefit from the high data rates LTE technology offers. This paper proposes an analytical model of Push-to-Talk over LTE networks to study their performance by using queueing theory. The model is validated against a discrete event simulation (SimEvents). The study provides some guidelines to improve the Grade of Service (GOS) of Push-to-Talk over LTE systems.Keywords
Push-to-Talk PTT, Next Generation Public Safety Networks, Call Blocking Probability1. Introduction
Push-to-Talk PTT over LTE is a group call voice communication service over mobile wireless networks. LTE is an all-IP system architecture. Voice communication service in LTE networks is based on Voice over IP technology (VoIP). IP Multimedia Subsystem is required to implement PTT service over LTE networks [1], [2]. Nowadays, PTT application is widely deployed over narrowband Trunking communication systems such as
2. The Analytic Model
The model of N PTT groups residing in one cell site of the LTE network as illustrated in Fig. 1. Any group member can initiate a group call session by pushing a button on their handset to invite its group to join the session. Any group can only initiate a group call session if there is at least one channel available at eNodeB. If all channels of eNodeB are busy, the group call session will be blocked. One channel serves the entire group call session and it is released when the session is completed. Push-to-Talk is a half-duplex type of communication meaning that only one group member can talk at a time while others are listeners. The PTT group share the same channel for their communication and at any time no more than one channel is allocated to the same group. It is intuitive that blocking probability is zero in the case where the number of channels allocated for the service at eNodeB equals to or is greater than the number of PTT groups (N≥s). One ends up with Erlang model in the case where the number of PTT groups is much greater than the number of channels (N>>s). In such a case, the average arrival rate of the group call sessions λG is state independent. In other words, the
population size of the model may be considered as infinite. Such a case is not considered in this study. The more realistic approach to PTT over LTE is the case where the number of PTT groups is greater than the number of allocated channels (N>s) but not (N>>s). Therefore, the arrival rate of the group call session λG is state dependent,
and the population size is finite.
Figure 1. Push-to-Talk over LTE network cell site
[image:2.595.307.540.172.543.2]The assumption is that each PTT group, whatever its size is, generates a random group call session period follows an exponential distribution with an average of 1/µ = 30 sec. The arrival rate of the group calls follows Poisson arrival. Therefore, the interarrival rate follows an exponential distribution with an average of 1/λg
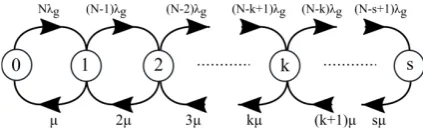
[image:2.595.65.281.443.586.2]Figure 2. State Transition diagram of the model
Fig. 2 shows a simple state transition diagram, where λg
is the average birth rate of the group call session per PTT group and µ is the death rate. In other words, µ is the average of the number of group call sessions that the system can serve per channel per unit time. In equilibrium, the probability flows across any system state are balanced, which means the net flow equals to zero. The balance equations are as follows:
g 0 1
Nλ P = μP (1)
g k k-1 g k+1
[(N-k+1)λ +(k+1)μ]P = kμP +(N-k)λ P (2) g s-1 s
(N-s+1)λ P = sμP (3) From (1), (2) and (3):
g g g
k 0
Nλ (N-1)λ ...(N-k+1)λ
P = P , s k 1
μ.2μ...kμ ≥ ≥ (4)
Letλ /μ=ρg g, and Nk =(N-k)!N!
Then
k
k N g 0
P = (ρ ) P , s k 1 k
≥ ≥
(5)
By using the normalization property:
0 1 s
P +P +...+P =1 (6) -1 s h 0 g h=0 N
P = (ρ )
h
∑
(7)Substituting (7) in (5)
k g k s h g h=0 N (ρ ) k P = N (ρ ) h
∑
(8)2.1. Blocking Probability BP
Blocking Probability BP (time congestion) of this queue system is the probability of the system being in states. When all (s) servers (Uplinks) are occupied by s PTT groups, any other PTT group member tries to initiate a new group call session will fail. In infinite population queue systems such as Erlang B system, the Blocking Probability BP (time congestion) is the same as the Loss Probability LP (call congestion) [15]. The Blocking Probability BP (time congestion) of the model:
s g s s h g h=0 N (ρ ) s BP = P =
N (ρ ) h
[image:2.595.67.279.681.747.2]2.2. Loss Probability LP
Loss Probability LP (call congestion) is the ratio of the actual number of group call session lost because of the lack of resources to the total number of group call sessions requested. However, in a finite population queue system, the Loss Probability LP is less than or equal the Blocking Probability BP. The reason LP is less than or equal to BP is that the average arrival rate of the queue system is state dependent, and the lowest arrival rate occurs when the system is in the state of blocking state (s). The Loss Probability LP (call congestion) of the model:
Lost Traffic LP =
Tottal offered Traffic (10)
Figure 3. State Transition diagram (Lost traffic) g s
g 0 g 1 g s-1 g s
(N-s)λ P LP=
Nλ P +(N-1)λ P +...+(N-s+1)λ P +(N-s)λ P (11) Substituting (5) in (11)
s g s h g h=0 N-1 (ρ ) s LP = N-1 (ρ ) h
∑
(12)The analytic model assumes that PTT groups can initiate a new group call session according to Poisson arrivals. However, there were times when a new group call session initiated while the previous one has not yet completed. These group call sessions will be pending until the previous one is completed. Moreover, there are times when group call session delayed because their previous session has just ended and the new one is about to start (channel release and reallocate). Because the queue system is state dependent, the arrival rate will end up being not Poisson. To determine the actually offered traffic of the model, two cases must be analyzed.
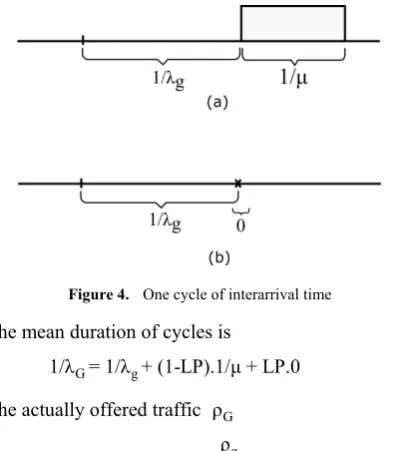
Case 1: an idle period of 1/ λg followed by service period
of 1/µ Fig. 4 (a)
Case 2: an idle period of 1/ λg followed by blocking
period of 0 Fig. 4 (b)
Figure 4. One cycle of interarrival time The mean duration of cycles is
G g
1/λ = 1/λ + (1-LP).1/μ + LP.0 (13) The actually offered traffic ρG
g G
g
ρ
ρ =
1+ (1+LP) ρ (14)
Even though the actual arrival rate per PTT group λG is
lower, the behavior of the system (non-Poisson arrivals) leads to higher blocking and loss probability. The reaction of the system to this behavior is as if the arrival rate of the queue system is higher. The main performance measure for the model is the actual traffic loss or LP. The model shows accurate LP for the complete range of ρg (0-0.2) Erlang
when s equals one. However, for s greater than one and ρg
is between (0.1-0.2), the analytic model underestimates the LP as the results of the non-Poisson arrival. Therefore, m (correction factor ) is proposed to compensate the impact of this behavior.
Let G g
1
λ =
1/λ + m (15) Where:
m: is the correction factor.
λg is the group call session arrival rate.
g G
G
1/(1/λ - m)
λ
ρ = =
μ μ (16)
g G
g
ρ
ρ =
1 - mμρ
(17)
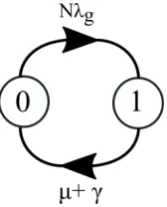
[image:3.595.321.522.77.303.2] [image:3.595.312.539.484.624.2]Figure 5. State Transition diagram with Timeout
The death rate will be µ+γ, where γ is the average rate of revoked group call sessions that exceed the preset timeout To. The Blocking Probability BP of the model is P1 and it is
as follows [10].
0
0
G -μT
G -μT
Nλ
BP =
μe
μ + + Nλ
(1-e )
(18)
following the same procedure as in (10), the Loss Probability LP is
0
0
G -μT
G -μT
(N-1)λ
LP =
μe
μ + + (N-1)λ
(1-e )
(19)
3. Simulation Results
3.1. Simulation Setup
SimEvents, Simulink, State flow and MATLAB scripts have been used to set up the discrete event simulation. One cell site has been considered as a queue system. One Time-based entity generator SimEvents block represents one PTT over LTE group with a total of N PTT groups. One Simulink function block serves all PTT groups N to generate a group call session arrival rate follows Poisson arrival with mean 1/ λg. One Simulink function block
serves all groups’ call sessions service time to follow an exponential distribution with mean 1/µ = 30 sec. One SimEvents Server block is used to represent the available uplink channels. A state flow chart is used to control each Enable Gate to prevent a specific PTT group from injecting a new group call session to the system while the previous one is still being served. The Loss probability is measured by the ratio between the group call sessions initiated when all servers (channels) are occupied to the total number of group call session requests.
3.2. Simulation Parameters
Table 1 and 2 show the simulation parameters that have been set up to study the PTT over LTE Loss Probability LP as the performance measure of the system.
Table 1. Simulation parameters for the model
N (# of PTT groups) s (# of servers) µ (Service Time) ρg (Offered Traffic) Erlang Simulation Time
5
1
2/min 0.0 – 0.2 50x103 sec
2 3
10
1 2 3
Table 2. Simulation parameters for Timeout model
N (# of PTT groups) s (# of servers) µ (Service Time) ρg (Offered Traffic) Erlang Timeout Simulation Time
5 1 2/min 0.1 Erlang
30 sec
50x103 sec
[image:4.595.133.217.78.182.2] [image:4.595.70.528.454.564.2]Figure 6. Simulation results of Loss Probability for s=1 and N=5
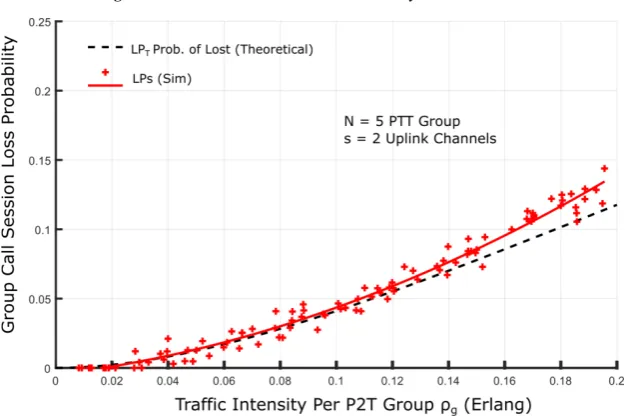
Figure 7. Simulation results of Loss Probability s=2 and N=5
[image:5.595.141.454.535.734.2]From figure 6, the model shows a high level of accuracy of Loss Probability LP over the entire range of offered traffic ρg (0-0.2) Erlang for s = 1. The accuracy of the
model has also been achieved when s > 1 but only over a limited range of offered traffic ρg (0-0.1) Erlang. As you
can see from Fig 7 and Fig 8, the analytic model underestimates LP when (ρg > 0.1) Erlang because it
assumes Poisson arrival which is not the case when PTT groups can not initiate a new group call session while the previous one is being active. In reality, this behavior leads to higher Loss than if the model maintains the assumption of Poisson arrival. The compensation of the impact of this behavior on the model can be greatly achieved for m (correction factor = 10) as shown in Fig. 9. Since PTT over LTE is a mission-critical system, its Loss Probability must be very low. Mission-critical systems must be very reliable.
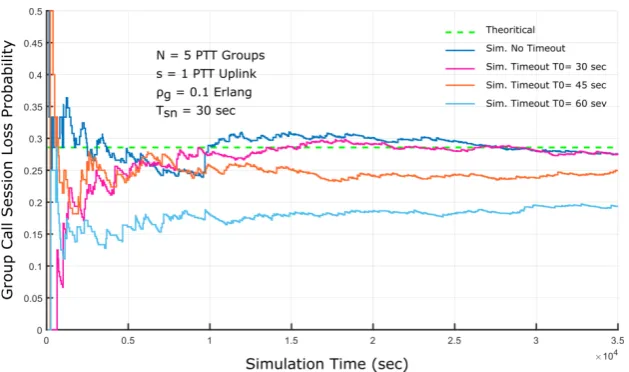
For instance, in case of N = 10 PTT groups, the traffic intensity per PTT group must be in the range of a maximum 0.02 Erlang and 0.05 Erlang for s = 2 and s = 3 respectively in order to maintain a grade of service GOS less than 1%. When upgrading the system is not an option to maintain this GOS, timeout model can help enhance the system performance in terms of Loss Probability. Fig 10, illustrates a comparison between the simulation and theoretical results of Loss Probability LP when implementing various values of timeout for long group call sessions. It is clear as the timeout value decreases, the LP decreases. LP is about 20% when timeout T0 is 30sec with
enhancement of 28.5% when timeout is not in place. This comes with a penalty of having more group call sessions terminated because of their service time exceeding the pre-set timeout.
[image:6.595.141.455.279.464.2]Figure 9. Simulation results with correction factor m = 10
[image:6.595.141.456.496.682.2](a)
(b)
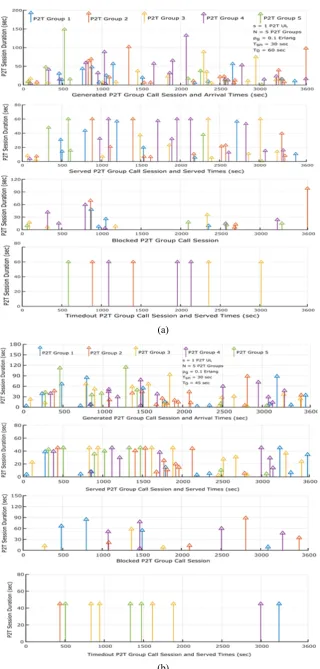
[image:7.595.139.460.73.744.2]Fig. 11 shows the events of generated, served, blocked and timed out group call sessions during the first hour of simulation time. It can be noticed from Fig.11(a) and Fig.11(b) that a better GOS is when T0=45sec, where only
16 group call sessions denied service because of resource unavailability. However, more sessions have been ended because they were longer than the pre-set timeout of 45sec.
4. Conclusions
Public safety communication systems are mission-critical systems. These systems have to provide very reliable services. 3GPP is working on making Push-to-Talk application over LTE for public safety a reality very soon. Since Push-to-Talk over LTE is different from regular phone calls, Erlang-B model does not well describe the actual PTT over LTE scenario. Therefore, it cannot accurately work out its call blocking probability. This paper investigates the performance of Push-to-Talk over LTE by using queueing theory. A more accurate State-dependent queue system is mathematically derived and implemented by using discrete event simulation (SimEvents). Simulation results have been validated against theoretical results. The results demonstrated that Loss Probability LP is more appropriate performance measure than Blocking Probability BP. The model is further enhanced and tuned to be more reliable. A considerable enhancement in Grade of Service (GOS) can be seen when implementing timeout model.
REFERENCES
[1] A. Kuwadekar, K. Al-Begain, A Real World Evaluation of Push to Talk Service Over IMS and LTE for Public Safety Systems, 10th IEEE International Conference on Wireless and Mobile Computing, Networking and Communications
(WiMob), 2014, 365 - 370.
[2] Li Hai, Wang Luman, Ye Benli, Wang Peng, Performance evaluation of group call in IMS-based TETRA core networks, IEEE Information Technology, Networking,
Electronic and Automation Control Conference, 2016, 118 -
122
[3] Abhaykumar Kumbhar, Farshad Koohifar, İsmail Güvenç, Bruce Mueller, A Survey on Legacy and Emerging Technologies for Public Safety Communications, IEEE Communications Surveys & Tutorials, 2017, 97 - 124. [4] Anna Paulson, Thomas Schwengler, A review of public
safety communications, from LMR to voice over LTE (VoLT E), 24th IEEE Annual International Symposium on
Personal, Indoor, and Mobile Radio Communications
(PIMRC), 2013, 3513 – 3517
[5] Qi Wang, Hai Jiang, Albert K. Wong, Jun Li, Zhongcheng Li, A Full-Distributed Architecture for PoC Application in Data Packet Voice Communication, 11th IEEE International
Conference on Computer and Information Technology, 2011,
231 - 237
[6] Tewfik Doumi, Mike F. Dolan, Said Tatesh, Alessio Casati, George Tsirtsis, Kiran Anchan, Dino Flore, LTE for public safety networks, IEEE Communications Magazine, 2013, 106 - 112
[7] Lin‐Yi Wu, Meng‐Hsun Tsai, Yi‐Bing Lin, Jen‐Shun Yang, A client-side design and implementation for push to talk over cellular service, Wireless Communication and
Mobile Computing, Vol. 7, No 5, 2007, 539 -552
[8] A. Parthasarathy, Push to talk over cellular (PoC) server,
IEEE Networking, Sensing and Control, 2005, 772 - 776
[9] W.-P. Chen, S. Licking, T. Ohno, S. Okuyama, T. Hamada, Performance Measurement, Evaluation and Analysis of Push-to-Talk in 3G Networks, IEEE International
Conference on Communications, 2007, 1893 - 1898
[10]Meng-hsun Tsai, Yi-bing Lin, Talk burst control for push-to-talk over cellular, IEEE Transactions on Wireless
Communications, Vol 7, Issue 7, 2008, 2612 – 2618
[11]Khandakar Rashedul Arefin, Tapio Erke, Kalevi Kilkki, Downlink Traffic Modeling and Analysis for Push to Talk over Cellular, IEEE International Conference on
Communications (MICC), 2009, 635 – 640
[12]Ma Lin, Wei Shouming, Qiang Wei, A novel traffic analysis method For PoC over LTE based on retrial calling model, IEEE Conference on Communications and Networking in China (CHINACOM), 2011, 771 – 775
[13] Hisham Zorghani, Ivica Kostanic, Performance evaluation of Push-to-Talk Application over LTE Networks,
International Journal of Engineering Research and Application, Vol. 8, Issue5, 2018, 88-92
[14]E.W.M. Wong, Andrew Zalesky, Moshe Zukerman, A state-dependent approximation for the generalized Engset model, IEEE Communications Letters, Vol 13, Issue 12, 2009, 962 - 964