Superficial and Deep Structure of Central Asia as
Example of Continental Lithosphere Heterogeneity
Yu.G. Gatinsky
1,*, T.V. Prokhorova
21Vernadsky State Geological Museum RAS, Moscow
2Institute of Earthquake Prediction Theory and Mathematical Geophysics RAS, Moscow *Corresponding Author: [email protected]
Copyright © 2014 Horizon Research Publishing All rights reserved.
Abstract
The north part of central Asia belongs to the north Eurasian lithosphere plate separated from neighboring plates by some transit zones. These zones consist of numerous crust blocks limited by active faults and interblock zones, in which maximal volumes of the seismic energy release. The examination of different geophysical fields of central Asia shows that interblock zones coincide with some anomalies in magnetic and partly gravity fields. Heat-flow values increase up to 80-100 μW/m-2 and more in interblock zones in boundaries of Hangay, Amurian, Tibet’s, and Tarim blocks as well as in some inner continental rifts. Some of heat-flow anomalies can be connected with mantle plumes under Hangay and north part of the Amurian Block.Within the central Asian transit zone the up-to-date tectonic compression distinctly predominates, while in the east Asian zone it changes partly on extension and slipping with extension. The crust thickness changes from 25-30 km in the east of central Asia up to 50-75 km in the west under Tibet and neighboring blocks. The lithosphere thickness changes in the same direction from 60-80 km up to 120-150 km, but it decreases up to 100 km and less under inner continental rifts coinciding with interblock zones. The direction of the P- and S-waves anisotropy shows within the great part of the region the coupling deformation in the lithosphere upper mantle and crust. But east of the east Himalayan syntax differently directed vectors of horizontal displacement are established in the crust and upper mantle indicating decoupling these layers under the influence of the Hindustan-Asia collision and “a threshold” of the SE China thick lithosphere, coinciding with the interblock zone between SE China and Tibet’s blocks. The majority of above-mentioned geophysical and geological data prove the heterogeneity of the central Asia lithosphere and its direct connection with interblock zones.
Keywords
Lithosphere Plates, Transit Zones, Blocks, Active Faults, Seismicity, Block Structure, Geophysical Fields, Deep Structure, Plate and Block Kinematics, Heat Flow, Upper Mantle Anisotropy1. Introduction
Central Asia includes a territory situated between the Lake Baikal, upper Enisei, Ob and Irtish in the north, east Kazakhstan, Tienshan and the Pamirs in the west, southwest China and the Himalayas in the south, the middle course of the Amur River and costs of the east and south China seas in the east (Figure 1). The territory is characterized by a complicated geologic structure and history with development of numerous suture zones of different ages. They limit blocks joined to Eurasia (before that to Laurasia) from the late Precambrian to Cenozoic. Boundaries of blocks are formed now as a rule by active faults. The geodynamic heterogeneity of central Asia and whole Eurasia was established also by the analysis of seismicity, which resulted in the attribution a part of the continent to the north American Plate and revelation of the central Asian, Amurian, Okhotsk, Indochina and other subplates or blocks after works of [Molnar, and Tapponier, 1975; Zonenshain, and Savostin, 1981; Gatinsky, 1986; Gatinsky, and Rundquist, 2004; Rundquist et al., 2005] and many others.
Some scientists noted illegibility, “washing away” and high penetrating of boundaries between main plates, in that number in Asia, and named them “diffuse boundaries” [Wiens et al., 1985]. Primarily such boundaries were established for the Indian Plate, later there was shown their abundance. This aspect was based on space geodetic data [Gordon, and Stein, 1992], plate non-rigidity [Gordon, 1998], isostasy data [Watts, 2001], digital modeling [Bird, 2003]. Yu.G. Gatinsky and his co-authors suggested to name territories with block mosaic development as “transit zones” [Gatinsky et al, 2005], because they divide large lithosphere plates and provide transfer and/or relaxation of tectonic stresses that arise between these plates.
existence of which is proved by the widespread development of active faults and epicenters of earthquakes ascertaining geodynamic heterogeneity of central Asia. In our paper we’ll consider briefly the block structure of central Asia, which was made more precise now during last year’s, and after that shall try to examine its connection, especially in interblock zones, with geophysical characteristics of this territory. The main purpose of our investigation is to show, how the modern lithosphere heterogeneity of central Asia is reflected in its superficial and deep structure.
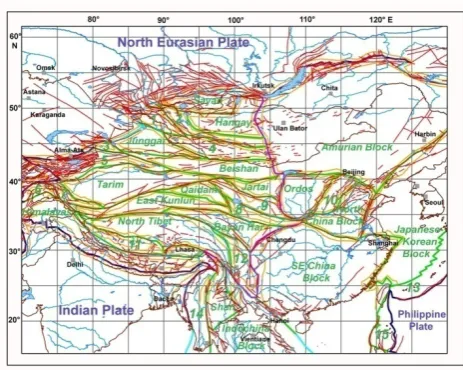
Figure 1. Modern block structure of central Asia and adjacent territories.
Red lines – active faults after [Xu and Deng, 1996; Trifonov et al., 2002;
Yin, 2010; Sherman et al., 2011], blue lines – rivers. Boundaries: dark blue – lithosphere plates, green – blocks, yellow – interblock zones; violet – boundary between central Asian and east Asian transit zones; light blue –
supposed boundaries [Gatinsky et al., 2005, 2009]. Not signed blocks
(numerals in figure): (1) Altai, (2) west Mongolian, (3) Ebi Nur, (4) south Gobi, (5) Tienshan, (6) Pamirs, (7) west Kunlun, (8) west Qinlin, (9) Qilian, (10) Taihangshan, (11) south Tibet, (12) Kam Dian, (13) Ryukyu – central Honshu, (14) Andaman’s – west Myanmar, (15) north Luzon. Note, active faults restrict the majority of blocks.
2. Block Structure and Geokinematics of
Central Asia
The main blocks can be distinguished already by analysis of active faults in the considering territory (Figure 1). Among them following units are visible the most clearly: Hangay, Junggar, Tarim, Qaidam, Ordos, Amurian, north Tibet, SE China. Blocks within transit zones differ each from other by their composition. Tarim, Junggar, Hangay, north and south Tibet, Ordos, and some others correspond to single tectonic units, as a rule to the old Precambrian massifs. Blocks like Tienshan, Sayan, Altai, south Gobi, Beishan, Qilian, east Kunlun, west Qinlin, and the Himalayas include fragments of some older fold belts. More large Amurian, SE China and Japanese-Korean blocks in the east Asian transit zone have a complex composition including different tectonic units: old massifs, fragments of fold belts, sometimes island arcs and deep water marginal basins. But in all cases the blocks are limited by active faults with rather
high seismicity.
Note that boundaries of some block up-to-now are under discussion. So the east boundary of the Amurian Block (Amurian Plate in other interpretation) is drawn in this work along the active Tanlu Fault and its continuation in the Russia territory (Figure 1). At the same time some geologists suppose, that it passes more east along the Sakhalin Fault and a segment of the Japanese subduction zone [Ashurkov et al., 2011]. But in such case the east part of the south boundary of this structure will cross nearly perpendicularly NNE active faults in the east China Sea and within the Korean Peninsula. It is worth to note that the central Asian zone is broken down on relatively smaller blocks in comparison with the east Asian zone. It is more probably connected with the influence of the Hindustan indenter pressure. Besides that some scientists suppose existing here double subduction process: one to the north from the Indian Plate and the other to the south from Tarim and Qaidam [Kao et al., 2001; Chung et al., 2005]. So the Himalayas -Tibet orogenic belt can represent a compression region between two subduction
[image:2.595.316.550.359.530.2]zones. We think that due to such process model velocities of the horizontal displacement sharply diminish north of Tarim (Figure 2).
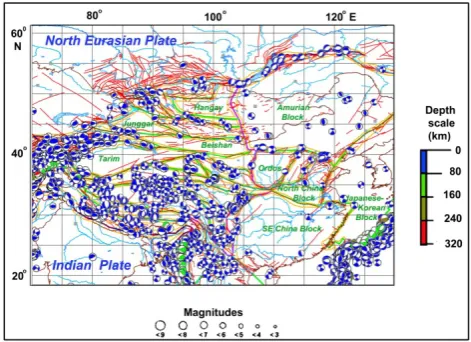
Figure 2. The seismicity of central Asia and vectors of the crust horizontal displacement. Each increasing of the color intensity corresponds to
increasing seismic energy volume on 1x101-1 or 1x10⁻¹J. Some energy
values are shown in the scheme in jouls. Epicentres: circle – instrumental
(NEIC), stars – historical from VIII to XIX century [Xu, and Deng, 1996].
Earthquakes magnitude: violet – 6.0-6.9, black -7.0-7.9, red - ≥ 8.0.Arrows:
red – experimental ITRF vectors of horizontal and blue – of vertical displacement, black – model vectors with respect to stable Eurasia. Boundaries and names of not signed blocks see in the Figure 1.
At the same time model vectors of horizontal displacement form a characteristic divergence with a west deflection (10° NE-350° NW) near the west syntax of the Himalayas in NW Tibet and Tienshan and east deflection up
possible influence of stress from the relatively rigid Tarim and SE China blocks. Some geologists explain the vectors divergence by a slab tear model, in which the Indian lithosphere has split into two slabs. A northward moving slab subducts steeply beneath the western sector of the Tibet Plateau and Pamirs, and a northeastward moving slab subducts at a low angle beneath the eastern sector of the Plateau and the Three Rivers region [Xiao et al., 2007; Hu et al., 2012; Liang et al., 2012].
3. Seismicity and Seismic Energy
Distribution in Central Asia
The areal spreading of seismic energy intensity in central Asia (Figure 2) was calculated by the formula from [Kanamori, andAnderson, 1975]:
logEs = aMs+b,where a = 1.5, b = 11.8.
The magnitude (Ms) of surface seismic waves was taken
from the NEIC Catalog 2011(http://earthquake.usgs.gov/regional/neic) by summarizing all earthquakes in the considering territory for
the period of 1966–2011 without exception for aftershocks. In our case, areas confined by 1x1 degree on either side were taken into account. The volume of energy in concrete interblock zones was considered for areas confined approximately to a 50-km distance on either side of the block boundary. Both the total energy within each interblock zone and the specific energy were calculated. The latter was taken per 1 km of the zone length or, at adopted parameters of the zone width and the hypocenter position, as a rule, not deeper than 40 km, per the 4000 km3 volume.
The inner parts of lithosphere plates and large blocks in transit zones (Amurian, SE China and some others) are practically aseismic. Inside of transit zones the releasing energy volume changes from 1x10⁻²-1x10⁵ J (Amurian Block) up to 1x10¹²-1x10¹⁵ J (Tienshan, Pamirs, Himalayas, north Tibet). The most active interblock zones limit the latter blocks and Bayan Har, where the majority of active faults are developed together with epicenters of strong earthquakes, as instrumental measured as historical beginning from VIII Century (Figure 2). A volume of seismic energy releasing
along each of mentioned zones reaches ≥ 5x10¹⁵ J, while along other boundaries it doesn’t exceed 3x10¹² - 2x10¹⁵ J. In the east boundary of the Bayan Har block it comes to > 9x10¹⁶J after the Wenchuan earthquake in May 2008 by our calculation [Gatinsky et al., 2011]. The latter figure can be compared with the energy of the most active Pacific subduction zones [Gatinsky, and Vladova, 2008]. The same interblock zones are characterized by a maximal specific energy par 1 km of their length (> 5.3x10¹² J) and by a maximal deviation of GPS vectors from average vector values of main plates. Seismic transects constructed across some of studied interblock zones [Gatinsky et al., 2009] show energy increasing in low horizons of the lithosphere in the case of the sharp slab deeping (west Pamirs, partly the
Japanese-Korean Block) and relatively even distribution of the energy, when there is a shallow sloping slab (Himalayas, south and north Tibet). Contrast energy increasing characterizes also boundary faults of other interblock zones (Tienshan, Bayan Har, and north boundary of the Amurian Block).
[image:3.595.314.550.423.594.2]4. The Reflection of Block Boundaries
and Interblock Zones in Stress Field
The predominance of compression within the central Asian transit zone results in the development of the transpressive regime due to pressure from the Hindustan indenter. Comparison between focal mechanisms in epicenters of earthquakes by CMT data from the Catalog of Global Centroid Moment Tensor Project 2013 (http://www.globalcmt.org/CMTfiles.html), model and GPS vectors (http://itrf.ensg.ign.fr/ITRF_solutions/2008 /ITRF2008.php) shows the development in this zone mainly thrusts and slips with compression in the north – NNE direction (Figures 3 and 4). Velocities of the model displacement with respect to stable Eurasia decrease from 30-35 mm/yr near the Hindustan –Eurasia collision zone down to 4-10 mm/yr north in the Sayan Block. Experimental vectors in the ITRF System are directed mainly northeast with velocities from 48 mm/yr in the south of Tibet down to 23-25 mm/yr withdrawn from the collision zone.Figure 3. The correlation between block structure of central Asia and types of the seismic stress after data on mechanisms in earthquake epicenters (CMT 2013). For boundaries, town names and not signed blocks see the Figure 1. Note the distinct predominance of compression in the central Asian transit zone (besides central part of Tibet, where tension is connected with rifting) and relatively wide development of tension in the east Asian zone.
transit zones [Rundquist et al., 2004]. A transtension tectonic regime predominates in the east Asian zone with development of numerous rifts in the Baikal System, around the Ordos, inside the Japanese-Korean and SEChina blocks.
Figure 4. Stress axes [World Stress Map, 2008] and vectors of horizontal displacement in central Asia. Stress axes correspond to: thrust (blue), slip (green), and normal fault (red). Colored arrows show ITRF2008 vectors: GPS (red), DORIS (blue), and SLR (green). Black arrows correspond to
model vectors in respect to stable Eurasia. 102-103° E lineament [Rundquist
et al., 2004] is shown by the hatched gray stripe. For boundaries, town
names and not signed blocks see the Figure 1. Note the distinct prevalence thrusts in the central Asian transit zone, at first within the majority of blocks boundaries. The same type of stress prevails in Pacific subduction zones in the SE part of the figure. The noticeable change of ITRF and model vectors can be seen from north -NNE in the central Asian transit zone up to east and SE in the east Asian zone.
The change of GPS vector directions can be the most distinct seen west and east of the south edge of the Baikal Lake, where it coincides with the change of the stress regiment (Figure 4). Transpression predominates in the west in Sayan Mountains, where NE thrusts are developed proved by orientation of stress axes. East from there in the Tunka Trough left-lateral strike-slips predominates, which is clearly seen in the displacement of streamlet thalwegs and left-lateral moving along the Main Sayan Fault after earthquake mechanisms. Further east strike-slips are replaced by normal faults in flanks of the Baikal Rift and Barguzin depression, which is also included in this rift system. The latter dislocations already correspond to the transtension tectonic regime [Gatinsky et al., 2009, 2011].
The mentioned sharp change of vectors and stress axes direction has different explanations: squeezing out some blocks including Amurian one to the east under influence of the collision process and a mantle flow generated by distant influence of the Pacific subduction slab [Barruol et al., 2008; Parfeevets, and Sankov, 2012], and besides that rising of mantle plumes underneath north Mongolia and the Lake Baikal [Grachev, 2000; Gatinsky et al., 2009]. As concern the same changes of vectors in the more south region, some scientists suppose a gravitational rolling down of crust layers from the highly emerged Tibet Plateau [Copley, 2008].
5. Terrestrial Magnetism and Gravity
Anomalies in Central Asia
The majority of blocks are limited by high positive striped magnetic anomalies up to +50 - +100 n [World Digital …, 2007], which coincide with interblock zones and faults within them (Figure 5). These anomalies characterize some large faults, among them Altun Tagh on the boundary of Tarim, Qaidam and north Tibet, Tanlu between Amurian and Japanese-Korean blocks and the most part of the102-103° E lineament. The same anomalies predominate over blocks Tarim, Junggar, Beishan and in Pacific subduction zones. Interchange of wider northeast strips take place over Ordos, Amurian and north China blocks, where magnetic field values fluctuates between +100 – -100 nT. This field corresponds apparently to the strike of early Precambrian basement structures.
A poorly differentiated magnetic field is established over SE China and Tibet’s blocks. Steady intensive negative anomalies (-20 – -100 nT) are developed over Tibet and between Himalayas and the Indian plate. Interchange of intensive positive and negative anomalies may be observed
over Indian and north Eurasian lithosphere plates. Within the latter the Main Sayan Fault of the NW strike is distinctly
seen west from the Baikal Lake by the contrast linear change of different sizes anomalies (Figure 5).
Figure 5. The magnetic field of central Asia. Boundaries, names of blocks and lithosphere plates see in the Figure 1.
[image:4.595.318.548.401.609.2]Bay in the south to the Okhotsk Sea coast in the north with changing of above mentioned negative values in the west by more high ones in the east (-50-0 mGal and up to +50 mGal in shelves). This change is connected with the sharp decreasing of the continental crust thickness in east Asia and in its coastal part. At the same time the connection of interblock zones and the lineament of 102-103° E with gravitational anomalies is not established.
Figure 6. Gravitational anomalies of central Asia and adjacent territories in the Bouguer reduction. Boundaries and not signed block’s see in the Figure 1.
6. The Heat-Flow and Seismic
Tomography of Central Asia
Heat-flow values often increase up to 80-100 μW/m-2 and more under interblock zones, which limit Amurian, Tibet’s, Tarim, Ordos, SE China and some other blocks (Figure 7). Maximal values correspond to interblock zones, which are in the tension regime with developing continental rifts, especially under the Lake Baikal (up to 80-120 μW/m-2) and under Ordos north boundaries (80-160 μW/m-2). Other heat-flow anomalies are known under the boundary of Amurian and Japanese-Korean blocks along the large Tanlu Fault and in its flanks (up to 80-120 μW/m-2), to the lesser extent under the boundary of Tarim with Kunlun and Qaidam along the Altun Tagh Fault, at the boundary of Bayan Har with SE China blocks (up to 90-120 μW/m-2) and under some other interblock zones. At boundaries of south and north Tibet the temperature increasing near the Moho discontinuity up to 800-1100 o C results in the wide development the Quaternary basalt volcanism [Gornov et al., 2009; Xia et al., 2011]. Heat-flow values in rifts of the central part of the Tibet Plateau reach 150-190 μW/m-2.
But besides that we can see increasing of heat-flow values underneath inner part of some blocks: Tienshan (up to 100-140 μW/m-2), Hangay (up to 120-190 μW/m-2), Amurian (up to 80-100 μW/m-2), SE China (up to 120-190 μW/m-2),
where they often coincide with areas of S-velocities slowing-down. This increasing supposedly corresponds to the influence ofmantle plumes on the lithosphere of central Asia. One of these plumes can be selected under Hangay and Sayan blocks at the depth 100-150 km. Here the thickness of the lithosphere decreases down to 70-50 km, and the temperature at the depth of 50 km can be about 1000-1200o C according to correlation 3He/ 4He isotopes [Lysak, 2009;
[image:5.595.64.293.183.375.2]Duchkov et al., 2010]. At the more depth down to 200-300 km this plume moves aside east under the Lake Baikal and Transbaikalia (Figure 7), where intensive Neogene’s and Quaternary basalt volcanism can be connected with it [Grachev, 2000]. Heat-flow anomalies under Qilian and east Qinlin blocks can be supposedly connected with the existence a low velocity channel of the asthenosphere material at the depth 125-200 km [Zhang et al., 2011].
Figure 7. The heat-flow and seismic tomography of central Asia. Values
of heat-flow are given from [Map of heat-flow..., 1980; The Global
Heat-Flow …, 2011]. Fields of the high heat-flow (≥ 70-80 μW/m-2) are
limited by red lines on the basis of the values size and after works [Sokolova,
and Duchkov, 2008; Tan, and Shen, 2008; Gornov et al., 2009; Lysak, 2009;
Duchkov et al.,2012]. Dotted red line corresponds to the suppose boundary
of fields. Thin gray and black lines of different types limit projections of
S-waves' velocity slowing-down up to ≤ 4.2-4.25 km/sec-1 on 50, 100, 150,
200, 250, and 300 km depth levels [Kozhevnikov, Yanovskaya, 2005]. Note
that the majority of the high heat-flow areas coincide with S-waves velocity slowing-down projections. For boundaries and not signed blocks see the Figure 1.
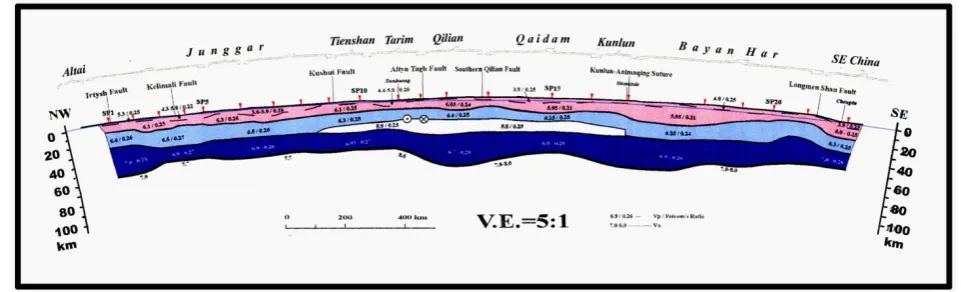
7. Central Asian Crust Structure
[image:5.595.317.546.279.449.2]from 50 up to 65-70 km. In the east coastal part of the Asian continent the crust thickness doesn’t exceed 25-30 km [Zhang et al., 2011]. But it increases up to 46-75 km in the west under Ordos, Tibet and neighboring blocks [Hu et al., 2011; Yu et al., 2012]. This increasing is connected with crust doubling in consequence of underthrusting the Indian Plate under Asia.
The total 40 km crust thickness remains at both sides of the interblock zone between Bayan Har and SE China blocks, but at the same time the upper crust twice increases there to SE together with noticeable decreasing the middle and especially lower crust (Figure 8). The east boundary of the Bayanhar Block coincides with a global lineament of 102-103º E [Gatinsky et al., 2009, 2011], which passes here along the Longmen Shan fault zone. It is just the same zone, where catastrophic earthquakes occurred in May 2008 and April 2013. A steep step corresponds to this fault in the crust
and whole lithosphere [Yuan et al., 2000].
[image:6.595.63.544.313.459.2]The sharp increasing of the upper crust east of the Longmen Shan Fault in SE China Block is supposedly connected with flowing and uprising there the plastic material composing the lower and middle crust under Bayan Har and Tibet [Li et al., 2011; Zhang et al., 2009]. Because of that the upper crust tears away and moves independently east along the more plastic middle and low crust [Flesch et al., 2005; Shen et al., 2005]. This process is proved by existing layers of high electric conductivity in the south Tibet crust at the 20-45 km depth, which supposedly corresponds to the partial melting of the crust material [Li et al., 2003; Solon et al., 2005; Oreshin et al., 2011]. Mentioned data show the direct connection of interblock zones with crust thickness gradients, especially in boundaries of Amurian, Ordos, Bayan Har and Tibet’s blocks.
9. The Central Asia Lithosphere and its
Kinematics
As concern the whole lithosphere thickness it comes to not more than 60-80 km in the east continental margin of Asia. That was established by studying upper mantle xenoliths and can be connected with thinning out the lithosphere due to intensive Mesozoic tension processes [Chen, 2009; Li and
Yang, 2011;Zhang et al., 2012]. Tomography data and
analysis of the hypocenters depth make it possible to suppose that the Pacific subduction slab gradates at the depth about 600 km along the boundary between upper and lower mantle. After that it continues west approximately up to the 102-103ۨۨ
lineament at the distance more than 1500 km. That results in the lithosphere heating with development of the inner continental volcanism and formation of tension basins in the east Asian transit zone [Huang, and Zhao, 2009].
[image:7.595.64.295.437.585.2]However the lithosphere thickness increases under Taihangshan, Ordos and some other old blocks up to 120-200 km. Gradients of its increasing corresponds to interblock zones, which coincide with rifts, where lithosphere thickness decreases down to 100 km [Bao et al., 2011]. The shortened lithosphere thickness exists under Tienshan (80-90 km against 200 km under Tarim and the north Asian Plate). Low-ohm zones of density losing and plastic deformation coincide with the low crust in Tienshan interblock zones, where the most intensive earthquakes are connected with gradients of electric resistance and S-wave velocities [Batalev et al., 2011].
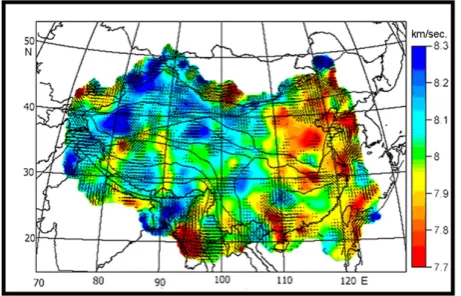
Figure 9. The anisotropy of P-waves in the upper mantle of China and adjacent territories after works [Sol et al., 2007; Pei et al., 2007; Huang, and
Zhao, 2009]. Colors correspond to fast Pn-wave velocities, thin black lines –
to the direction of splitted waves. The length of lines is proportional to the anisotropy amplitude. Note, that the mantle anisotropy direction is mainly
WNW within the most part of the Himalayas, Pamirs and south Tibet
corresponding to the longwise spreading of the mantle material, which
results in the beginning collapse of the collisional orogen [Shen et al., 2000,
2005]. To the north of there NNE anisotropy directions coincides with GPS
vectors indicating conjugation of the strain direction in the crust and lithosphere mantle. Latitudinal and NE anisotropy direction in south China and in the north part of the Indochina Peninsula don’t conform with the clock-wise turn of GPS vectors in this region and allow to suppose existing non-conjugation of the crust and lithosphere mantle displacement there.
Data on anisotropy are the indicator of the strain and
solidity for the mantle depths. These data are established by splitting of seismic waves from remote earthquakes. Pn-wave velocities are mainly low in the east part of central Asia and higher in the west (Figure 9). The highest Pn-wave velocities are noted in the upper mantle under old blocks: Tarim, Junggar, and Qaidam, northwest part of SE China and under the great part of north Tibet [Huang et al., 2011; Wang et al., 2013]. Relatively high velocities characterize the 102-103ۨۨ lineament near meridian rifts in Tibet and partly Ordos [Li et al, 2011]. The most intensive anisotropy is established under Tarim and in neighboring parts of the central Asian transit zone, where the NNE direction of fast splitting Pn-waves coincides with the direction of the maximal compression [Pei et al., 2007] and GPS vectors. The authors of the work [San’kov et al., 2011] come to the same conclusion for the Baikal, north and central Mongolia region noting the complete conjugation of the strain direction in the crust and lithosphere mantle.
The direction of the P- and S-waves anisotropy shows coupling deformations in the lithosphere upper mantle and crust within the great part of the region, but different vectors of horizontal displacement in crust and mantle east of the east Himalayan syntax indicate decoupling these layers under the influence of the Hindustan - Asia collision. The thickness of the east Tibet lithosphere is 100-120 km against 130-170 km under the Sichuan Basin of SE China [Zhao et al., 2010; Hu et al., 2012]. The thinner lithosphere may indicate that the lower part of eastern Tibet lithosphere is heated and delaminated by the underlying hot asthenosphere flow, which is resisted by the cold rigid Sichuan Basin lithosphere, thus branching into northeastward and southeastward parts. The east extrusion of the Tibet lithosphere was at first assumed in the work [Molnar, Tapponnier, 1975].
The Tibet lithosphere delaminating results in its fragmentation during interaction with the rigid and cold SE Asia Block. GPS data show the intensive clock-wise turning of the crust within Bayan Har, Kam Dian, Shan and SE China blocks. The dynamic model for the lithosphere shows that the Yunnan and Indochina crust is moving SE and south with respect to the mantle at velocities as high as ~30 mm/yr, while the mantle is displaced NE. At the same time beneath the more west part of Tibet both move north (Flesch et al., 2005; Sol et al., 2007).
10. Conclusion
geodynamic activity of interblock zones including development within them epicenters of the most catastrophic earthquakes and prove the modern heterogeneity of the lithosphere structure in this region.
Following interblock zones of central Asia can be mentioned as the most seismically active: at boundaries of
the Tienshan Block in Kazakhstan, Kirghizia and NW part of
the Xinjiang Province of China (the volume of the specific energy reaches 2.88-3.97x10**13 J); at boundaries of Hangay and Amurian blocks in the Baikal region in Russia and Mongolia (2.9x10**12 J); at north and south boundaries
of the Pamirs in Tajikistan and Afghanistan (≥ 1.44x10**13
J); at the boundary between the Himalayas Block and Indian Plate in Tibet and north India (9.51x10**12); and at all boundaries of the Bayan Har Block in China (3.99x10**13 – 9.25x10**16 J). The majority of catastrophic earthquakes took place within above-mentioned interblock zones during some last centuries (Figure 2). This emphasizes the applied significance of the detail studying seismicity and geodynamics of interblock zones with attraction of data from international catalogs of earthquakes, analysis of active faults, geophysical fields, GPS vectors, as well as deep structures of the lithosphere.
Main causes of the high inner continental seismicity development in interblock zones connect with the deep continuation of collision slabs as it takes place under Tibet and the Pamirs, the intensive displacement of rheology layered crust horizons along faults under the influence of collision processes as at southeast boundary of the Bayan Har Block, existence of the large lithosphere unhomogeneity
including mantle plumes as in Sayan, Hangay, and NW part
of the Amurian Block. The dependence of the seismic activity increasing from the relatively long seismic gap was established for the southeast boundary of the Bayan Har Block [Gatinsky et al., 2008, 2009, 2011], where catastrophic earthquakes are repeated now every 5 years after near 40 years interval.
So the detail investigation of interblock zones geological structure, geophysical fields, and seismicity has the great significance for the prediction of catastrophic earthquakes and selection of specific areas of the most possible occurrence of highly seismic events.
Acknowledgement
This investigation is fulfilled with assistance of the Presidium RAS, Moscow (Program 4, Project “Appraisal and means of decreasing consequences of up-to-date tectonic movements and earthquakes in main mining regions and strategic power-stations in the Asian part of Russia and neighboring foreign countries”) and Russian Foundation for Basic Research (Project No. 13-05-00109).
REFERENCES
[1] Ashurkov S.V., San’kov V.A., Miroshnichenko A.I. et al. GPS geodetic constrains of the Amurian Plate // Russian Geology and Geophysics. Vol. 52. Issue 2. 2011, pp. 239-249. [2] Bao X., Xu M., Wang L., Mi N., Yu D., and Li H.
Lithospheric structure of the Ordos Block and its boundary areas inferred from Rayleigh wave dispersion // Tectonophysics. Vol. 499. Issue 1-4. 2011, pp. 132-141. [3] Barruol G., Deschamps A., Deverchere J. et al. Upper mantle
flow beneath and around the Hangay dome, Central Mongolia // Earth and Planetary Sci. Letters. Vol. 274. Issue 1-2. 2008, pp.221-233.
[4] Batalev V.Yu., BatalevaE.A., Egorova V.V. et al. The lithospheric structure of the Central and Southern Tien Shan: MTS data correlated with petrology and laboratory studies of lower-crust and upper-mantle xenoliths // Russian Geology and Geophysics. Vol. 52. Issue 1-2. 2011, pp. 1592-1599. [5] Bird P. An Updated Digital Model of Plate Boundaries //
Geochemistry, Geophysics, Geosystems. Vol. 3. No. 4. 2003. doi:10.1029/2001GC000252
[6] Bonvalot S., Balmino G., Briais A., et al. World Gravity Map,
1:50000000 map / Eds.: BGI-CGMW-CNES-IRD. Paris, 2012.
http://bgi.obs-mip.fr/activities/Projects/world_gravity_map_ wgm
[7] Chen L. Lithospheric structure variations between the eastern and central North China Craton from S- and P-receiver function migration // Physics of the Earth and Planet. Interiors. Vol. 173. Issue 3-4. 2009, pp. 216-227.
[8] Chung S.-L., Chu M.-F., Zhang Y. et al. Tibetian Tectonic Evolution Inffered from Spatial and Temporal Variations in Post-Collisional Magmatism // Earth Sci. Review. Vol. 68. No. 3-4. 2005, pp. 173-196. doi:10.1016/j.earscirev.2004.05.001
[9] Copley A. Kinematics and Dynamics of the Southeastern Margin of the Tibetan Plateau // Geophys. J. International. Vol. 174. No. 3. 2008, pp. 1081- 1100.
[10] Crustal Structure of China from Deep Seismic Sounding
Profile. 2001. http://earthquake.usgs.gov/research/structure/crust/china.php
[11] Duchkov A.D., Rychkova K.M., Lebedev V.I. et al. Appraisal of the Tuva heat-flow after data on helium isotopes in thermal mineral springs // Geology and geophysics. Vol. 51. No 2. 2010, pp. 264-276 (in Russian).
[12] Duchkov A.D., Zheleznyak M.N., Ayunov D.E. et al.. Geothermal Atlas of Siberia and Far East (2009-2012). 2012, http://maps.nrcgit.ru/geoterm/.
[13] Flesch L.M., Holt W.E., Silver P.G. et al. Constraining the extent of crust–mantle coupling in central Asia using GPS, geologic, and shear wave splitting data // Earth and Planet. Sci. Letters. Vol. 238. 2005, pp. 248– 268.
[14] Gatinsky Yu.G. Geodynamics of SE Asia in Relation to the Evolution of Ocean Basins // Palaeogeography, Palaeoclimatology, Palaeoecology. Vol. 55. No. 2-4. 1986, pp.127-144. doi:10.1016/0031-0182(86)90148-3
[16] Gatinsky Yu.G., Rundquist D. V., and. Tyupkin Yu. S, Block Structure and Kinematics of Eastern and Central Asia from GPS Data // Geotectonics. Vol. 39. No. 5. 2005, pp. 333-348. [17] Gatinsky Yu.G., and Vladova G.L. Subduction zones of SE Asia: main types, seismicity and mineralization // Proceed. of the VAG International Symposium 2008, 7-9 November 2008, Hanoi. Vietnam. Special issue of J. Geology: Intern. Year of Planet Earth. 2008, pp. 9-16.
[18] Gatinsky Yu. G., Rundquist D. V., Vladova G. L., and Prokhorova T.V. Geodynamics of the Sichuan Earthquake Region in May 12, 2008. Doklady Earth Sciences. Vol. 423A.
No. 9. 2008, pp.1507-1509.
doi:10.1134/S1028334X08090419
[19] Gatinsky Yu.G., Prokhorova T.V., Rundquist D.V., and Vladova G.L. Zones of Catastrophic Earthquakes of Central Asia: Geodynamics and Seismic Energy // Russ. J. Earth Sci.
Vol. 11. No 1. 2009. http://dx.doi.org/10.2205/2009ES000326
[20] Gatinsky Yu., Rundquist D., Vladova G., and Prokhorova T. Up-to-date geodynamics and seismicity of Central Asia // International Journal of Geosciences. 2011. No 2. P. 1-12. http://www.SciRP.org/journal/ijg
[21] Gordon R. G. The Plate Tectonic Approximation: Plate Non-rigidity, Diffuse Plate Boundaries, and Global Plate Motions // Annual Review of Earth and Planetary Sciences, Vol. 26, No. 1, 1998, pp. 615-642. doi:10.1146/annurev.earth.26.1.615
[22] Gordon R. G., and Stein S. Global Tectonics and Space Geodesy // Science, Vol. 256, No. 5055, 1992, pp. 333-342. doi:10.1126/science.256.5055.333
[23] Gornov P.Yu., Goroshko M.V., Malyshev Yu.F. et al. Thermal structure of lithosphere in Central Asian and Pacific belts and their adjacent cratons, from data of geoscience transects // Russian Geology and Geophysics. Vol. 50. Issue 5. 2009, pp. 485-499.
[24] Grachev A.F. Modern Volcanism, Mantle Plumes, and Their Connection with the Stress Intensity in the Lithosphere. In: A. F. Grachev, Ed., Neotectonics, Geodynamics and Seismicity of Northern Eurasia, Moscow: Probel, 2000, pp. 245-266 (in Russian).
[25] Hu J., Yang H., Xu X., Wen L., and Li G. Lithospheric
structure and crust – mantle decoupling in the southeast edge of the Tibetan Plateau // Gondwana Research. Vol. 22. Is. 3-4. 2012, pp. 1060-1067. doi:10.1016/j.epsl.2011.03.034 [26] Huang J., and Zhao D. Seismic imaging of the crust and upper
mantle under Beijing and surrounding regions // Physics of the Earth and Planetary Interiors. Vol.173. Issues 3-4. 2009, pp. 330-348.
[27] Huang Zh., Wang L., Zhao D. et al. Seismic anisotropy and mantle dynamics beneath China // Ears and Planet. Sci. Lett. Vol. 306. Issue 1-2. 2011, pp. 105-117.
[28] Kanamori H., and Anderson D. L. Theoretical Basis of Some Empirical Relations in Seismology // Bull. Seismol. Soc. Am. Vol. 65. No. 5. 1975, pp. 1073-1109.
[29] Kao H., Rui, G., Rau R.-J. et al. Seismic Image of the Tarim Basin and Its Collision with Tibet // Geology. Vol. 29. No. 7. 2001, pp. 575-578. doi:10.1130/0091-7613(2001)029<0575
[30] Map of heat flow for USSR territory and adjacent regions. Sc. 1:10000000 / Ed. Ya.B. Smirnov. Geological Institute USSR AS. The Central Board of Geodesy and Cartography attached to the USSR Council of Ministers. 1980 (in Russian). [31] Kozhevnikov V. M., and Yanovskaya T. B. S-wave velocities
distribution in the lithosphere of the Asian continent after data of surface Rayleigh waves // Actual problems of modern geodynamics of central Asia / Eds.: K. G. Levi, and S.I. Sherman. Novosibirsk: Sibirean Branch RAS. 2005, pp. 46-64 (in Russian).
[32] Li S., Unsworth M. J., Booker J. R. et al. Partial Melt or Aqueous Fluid in the Mid-Crust of Southern Tibet? Constraints from INDEPTH magnetotelluric data // Geophysical J. Intern. Vol. 153. No. 2. 2003, pp. 289-304. doi:10.1046/j.1365-246X.2003.01850.x
[33] Li Yu., and Yang Yu. Gravity data inversion for the lithospheric density structure beneath North China Craton from EGM 2008 model // Physics of the Earth and Planet. Interiors. Vol. 189. Issue 1-2. 2011, pp. 9-26.
[34] Li J., Wang X., and Niu F. Seismic anisotropy and implication for mantle deformation Beneath the NE margin of the Tibet plateau and Ordos plateau // Physics of the Earth and Planet. Interiors. Vol. 189. Issue 3-4. 2011, pp. 157-170. [35] Liang X., Sandvol E,. Chen Y.J. et al. A complex Tibetan
upper mantle: A fragmented Indian slab and no south verging subduction of Eurasian lithosphere // Earth and Planetary Sci. Letters. Vol. 333-334. 2012, pp. 101-111. http://dx.doi.org/10.1016/j.epsl.2012.03.036
[36] Lysak S.V. Thermal history, geodynamics, and current thermal activity of lithosphere in China // Russian Geology and Geophysics. Vol. 50. Issue 2. 2009, pp. 485-499. [37] Molnar P., and Tapponier P. Cenozoic Tectonics of Asia //
Science. Vol. 189. No. 4201. 1975, pp. 419-426. doi:10.1126/science.189.4201.419
[38] Oreshin S.I., Vinnik L.P., Kiselev S.G. et al. Deep seismic structure of the Indian shield, western Himalaya, Ladakh and Tibet // Earth and Planetary Sci. Letters. Vol. 307. Issues 3-4. 2011, pp. 415-429. doi:10.1016/j.epsl.2011.05.016
[39] Parfeevets A.V., and Sankov V.A. Late Cenozoic tectonic stress fields of the Mongolian microplate // C.R. Geoscience. Vol. 344. 2012, pp. 227-238.
[40] Pei S., Zhao J., Sun Yo et al. Upper mantle seismic velocities and anisotropy in China determined through Pn and Sn tomography // J. Geophys. Res. Vol. 112. No B05312. 2007.
[41] Rundquist D.V., Gatinsky Yu.G., and Cherkasov S.V. The natural trans-Eurasian divider: structural and metallogenic evidences // Abstracts 32-IGC, Florence. Part 2. 2004, p. 620. [42] Rundkvist D.V., Gatinsky Yu.G., Bush W.A., and
Kossobokov V.G. The area of Russia in the present-day structure of Eurasia: Geodynamics and seismicity // Computational Seismology and Geodynamics / Ed. D.K.
Chowdhury. Washington D.C.: Am. Geophys. Union. Vol. 7.
2005, pp. 224-233.
[44] Shen Z., Zhao C., Yin A. et al. Contemporary Crustal Deformation in East Asia Constrained by Global Positioning System Measurements // J. Geophys. Res. Vol. 105. No. B3. 2000, pp. 5721-5734. doi:10.1029/1999JB900391
[45] Shen Z., Lu J., Wang M., and Burgmann R., 2005.
Contemporary crustal deformation around the southeast borderland of the Tibetan Plateau // J. Geophys. Res. - Solid Earth. Vol. 110. No B11409. 2005, pp. 1-17.
[46] Sherman S. I., Sorokin A. P., Sorokina A. T. et al. New Data on the Active Faults and Zones of Modern Lithosphere Destruction in the Amur Region // Doklady Earth Sciences. Vol. 439. Part 2. 2011, pp. 1146–1151.
[47] Sokolova L.S., and Duchkov A.D. Heat flow in the Altai-Sayan area: new data // Russian Geology and Geophysics. Vol. 40. Issue 12. 2008, pp. 940-950.
[48] Sol S., Meltze A., Bürgmann R. et al. Geodynamics of the southeastern Tibetan Plateau from seismic anisotropy and geodesy // Geology. Vol. 35. No 6. 2007, pp. 563–566. doi: 10.1130/G23408A.1
[49] Solon K. D., Jones A. G., Nelson K. D. et al. Structure of the Crust in the Vicinity of the Banggong-Nujiang Suture in Central Tibet from INDEPTH Magnetotelluric Data // J. Geophys. Res. Vol. 110 No.B10102, 2005. doi:10.1029/2003JB002405
[50] Tao, W., and Shen, Z. Heat flow distribution in Chinese continent and its adjacent areas // Progress in Natural Science. Vol. 18. Issue 7. 2008, pp. 843–849. http://dx.doi.org/10.1016/j.pnsc.2008.01.018
[51] The Global Heat Flow Database // International Heat Flow Commission. University of North Dakota. 2011. http://www.heatflow.und.edu
[52] Trifonov V. G., Soboleva O. V., Trifonov R. V., and Vostrikov G. A. Recent Geodynamics of the Alpine-Himalayan Collision Belt, Transactions of the Geological Institute RAS Issue 541 / Ed. Yu.G. Leonov. 2002, 225 p. (in Russian).
[53] Wang S., Niu F., and Zhang G. Velocity structure of the
uppermost mantle beneath East Asia from Pn tomography and its dynamic implications // J. Geophys. Res.: Solid Earth. Vol. 118. 2013, pp. 290-301. doi:10.1002/jgrb.50085
[54] Watts A. B. Isostasy and Flexure of the Lithosphere // Cambridge University Press, Cambridge, 2001.
[55] Wiens D. A., DeMets C., Gordon R. G. et al. Diffuse Plate Boundary Model for Indian Ocean Tectonics // Geophys. Res. Letters, Vol. 12, No. 7, 1985, pp. 429-432. doi:10.1029/GL012i007p00429
[56] World Digital Magnetic Anomaly Map. 2007. http://projects.gtk.fi/WDMAM/project/perugia/index.html
[57] World Stress Map. A Project of the Heidelberg Academy of Sciences and Humanities / Eds. O. Heidbach, M. Tingay, A. Barth et al. // Commission for the Geological Map of the
World, WSM Release 2008.
http://www.world-stress-map.org
[58] Xia L., Lia X., Maa Zh., Xua X., and Xia Z. Cenozoic volcanism and tectonic evolution of the Tibetan plateau // Gondwana Research. Vol. 19. Issue 4. 2011, pp. 850-86. [59] Xiao L., Wang C., and Pirajno F. Is the Underthrust Indian
Lithosphere Split Beneath the Tibetan Plateau? // Intern. Geol. Review. Vol. 49. No. 1. 2007, pp. 90-98. doi:10.2747/0020-6814.49.1.90
[60] Xu X., and Deng Q. Nonlinear Characteristics of Paleoseismicity in China, // J. Geophys. Res. Vol. 101. No. B3. 1996, pp. 6209-6231. doi:10.1029/95JB01238
[61] Yin A. Cenozoic tectonic evolution of Asia: A preliminary synthesis // Tectonophysics. Vol. 488. Issues 1-4. 2010, pp. 293-325.
[62] Yu Ch.-Q., Chen W-P., Ning J-Yu. et al. Thick crust beneath the Ordos plateau: Implications for instability of the North China craton // Earth and Planetary Sci. Letters. Vol. 357-358. 2012, pp. 366-375.
[63] Yuan X., Egorov A.S., and GEMOC. A short introduction to Global Geoscience Transect 21: Arctic Ocean – Eurasia – Pacific Ocean // Science Press. 2000, 32 p.
[64] Zhang Zh., Bai Zh., Mooney W. et al. Crustal structure across the Three Gorges area of the Yangtze platform, central China, from seismic refraction/wide-angle reflection data // Tectonophysics. Vol. 475. Issues 3-4. 2009, pp. 423-437. [65] Zhang Zh., Chen Q., Bai Zh. et al. Crustal structure and
extensional deformation of thinned lithosphere in Northern China // Tectonophysics. Vol. 508. Issues 1-4. 2011, pp. 62-72.
[66] Zhang Zh., Wu J., Deng Ya. et al. Lateral variation of the strength of lithosphere across the eastern North China Craton: New constraints on lithospheric disruption // Gondwana Res. Vol. 22. Issues 3-4. 2012, pp. 1047-1059.
[67] Zhao D., Xu M., Mi N. et al. Upper mantle structure and dynamics beneath Southeast China // Physics of the Earth and Planet. Interiors. Vol. 182. Issues 3-4. 2010, pp. 161-169. [68] Zonenshain L. P., and Savostin L. A. Geodynamics of the
![Figure 4. Stress axes [World Stress Map, 2008] and vectors of horizontal](https://thumb-us.123doks.com/thumbv2/123dok_us/8790648.909112/4.595.318.548.401.609/figure-stress-axes-world-stress-map-vectors-horizontal.webp)