Kundan P Chaudhari Department of Pharmaceutics,
TVES’s Honorable Loksevak Madhukarrao Chaudhari College of Pharmacy, Faizpur, (India)
Email:[email protected] Address for correspondence
Access this article online www.japer.in
Formulation and Evaluation of Albendazole Microspheres by
Ionotropic Gelation method
INTRODUCTION
Microencapsulation is described as a process of
enclosing micron-sized particles of solids or droplets
of liquids or gasses in an inert shell, which in turn
isolates and protects them from the external
environment [1].The products obtained by this process,
are called micro particles microcapsules and
microspheres which differentiate in morphology and
internal structure. When the particle size is below 1
mm they are known as nanoparticles, nanocapsules,
nanospheres, respectively and particles having
diameter between3–800 mm are known as
microparticles, microcapsules or microspheres [2].
Particles larger than 1000 mm are known as
macroparticles.
Microparticles have been widely accepted as a means
to achieve oral and parenteral controlled release [3, 4].
The microsphere requires a polymeric substance as a
coat material or carrier. A number of different
substances biodegradable as well as non-
biodegradable have been investigated for the
preparation of Microparticles [5]. It not only reduces
the dose of the drug, reaching to the effective
biological sites rapidly but also results in reduced
toxicity of the targeting. In the past few years,
pharmacists have been focused their research in
colloidal drug delivery system/colloidal carriers, like
Liposomes, Microspheres and Nanoparticles as a
targeting carriers, which has given selective targeting.
Albendazole [6, 7] is an Anthelmintic agent, is mainly
used in the management of Helminthiasis. It has
biological half-life of up to 8.5 hrs. It is poorly
absorbed from the gastrointestinal tract due to low
aqueous solubility. The aim of the present work was
to develop the A l b e n d a z o l e Microparticles by
using sodium alginate [8]and tamarind polysaccharide
[9] as a polymer for colonic delivery of albendazole to
obtain better pharmacological effect and avoiding side
effects associated with albendazole therapy. Tamarind
seed polysaccharide [10] (TSP) obtained from the seed
kernel of Tamarindus indica, possesses properties like The objectives of the present studies was to developed Albendazole microparticles by using sodium alginate and tamarind polysaccharide as polymer for colonic delivery of albendazole. microspheres were prepared using TSP and Sodium alginate as blend in different ratios with different calcium chloride concentration as a cross linker by ionotropic gelation. The microspheres were characterized for drug content, percentage yield, particle size analysis and surface morphology. The results of all the physiochemical tests of all formulations were found to be favourable. The swelling index study was shows that low conc. of cross linking agent give higher swelling due to lower degree of cross linking. FT-IR studies indicated that there were no reactions between albendazole, and polymers used. Different formulations of microspheres showed prolonged in-vitro
release profiles over 12 hours in both stomach and intestinal pH. It was found that the albendazole release in gastric pH was comparatively slow and sustained than intestinal pH. SEM photographs showed that the microspheres were spherical with no visible major surface irregularity. The kinetic study was carried out and the best fitted kinetic model for F-2 batch was Korsmeyer peppas have R value 0.961 and k value was 5.808.
Keywords: Albendazole, tamarind seed polysaccharide, sodium alginate, microspheres.
ABSTRACT ABSTRACT ABSTRACT ABSTRACT Umesh. B. Patil , Kundan P.
Chaudhari*, Umesh T.Jadhao, Vinod M.Thakare, Bharat W. Tekade
Department of Pharmaceutics, TVES’s Honorable Loksevak Madhukarrao Chaudhari College of Pharmacy, Faizpur, (India)
high viscosity mucilage, broad pH tolerance, no
carcinogenicity, mucoadhesive nature, and
biocompatibility.
MATERIAL AND METHOD
Albendazole was obtained as kind gift sample by Brassica pharma, Boisar. (Maharashtra) India.
Tamarind seed polysaccharide was obtained as gift sample by Hari Om Gum Industries, Surat. All other materials and solvents used were of analytical grade.
Formulation of Microspheres:
Preparation of Albendazole loaded TSP-alginate Microsphere.
Ionotropic Gelation Method:
Sodium alginate and TSP aqueous dispersion were
prepared separately using distilled water. This
dispersion was well mixed with stirring for 10 min. at
1000 rpm using electronic stirrer. Afterwards
albendazole was added to this dispersion mixture. The
ratio of drug to polymer was maintained 1:1 in all
formulations. The final TSP-alginate dispersion
containing albendazole was homogenized till it
completely mixed together at 1000 rpm. The resulting
dispersion were sonicate for 5 min. to debubbling. The
resulting dispersion was then added via a 26 gauge
needle. The added droplets were retained into CaCl2
solution for 20 minute complete the curing reaction
and to produced spherical rigid microsphere. The
microsphere were collected by decantation and
washed thrice with distilled water and dried at 450 C
for 12 hrs [11]. The formulation details are given in
table no.1.
The preliminary study performed for microspheres
formulation with 1:0.5, 1:1, 1:1.5 ratio for drug to
polymer. It was found that 1:0.5 ratio for drug to
polymer release the drug faster and 1:1.5 ratio for
drug to polymer retard the release of drug, while 1:1
ratio for drug to polymer release the drug
appropriately so, 1:1 ratio was decided for the final
batches of microsphere formulations by using 5%,
10% calcium chloride as cross linking agent.
Table 1: Formulation batches of TSP-Alginate microsphere
Formulation Code TSP : Sodium alginate CaCl2
F1 1:1
5%
F2 1:2
F4 1:1
10%
F4 1:2
Evaluation of microspheres:
-The microsphere was formulated with above
composition were evaluated for following
micromeritics properties.
Angle of repose
:-Angle of repose is defined as the maximum angle
possible between the surface of pile of powder and
horizontal plane. The angle of repose for the
microsphere of each formulation was determined by
the funnel method [12]. The microsphere was allowed
to flow out of the funnel orifice on a plane paper kept
on the horizontal surface, this forms a pile of
microspheres on the paper.The angle of repose was
calculated by substituting the values of the base radius
‘R’ and pile height ‘H’ in the following equation.
Tanθθθθ = H / R
Where, H = pile height, R = radius of pile
Therefore; θ = tan –1 _ H _ R
Bulk density and tapped density:
Both loose bulk density (LBD) and tapped bulk
density (TBD) were determined. A quantity of 2g of
microsphere from each formula was lightly shaken to
break agglomerates if any and then was introduced
into a 10 ml-measuring cylinder. It was allowed to fall
under its own weight onto a hard surface from the
height of 2.5 cm at 2- second intervals. The tapping
was continued until no further change in volume was
noted. Loose bulk density (LBD) and tapped bulk
density (TBD) were calculated using the following
formulae [13, 14].
LBD = Weight of the microsphere/volume of the
packing
TBD= Weight of the microspheres/tapped volume of
Compressibility index:
The compressibility indices of the formulation blends
were determined using Carr’s compressibility index
formula [11].
(TBD – LBD)
Carr’s compressibility index (%) = X 100 TBD
Hausner’s ratio:
Hausner’s ratio of microspheres was determined by
comparing the tapped density to the bulk density
using the equation [11].
Tapped density Hausner’s Ratio = Bulk density
Particle size analysis:
The particle size was measured using a stage
micrometer, and the mean particle size was calculated
by measuring 200 particles with the help of a
calibrated stage micrometer. A small amount of dry
microspheres was suspended in liquid paraffin (10
ml). A small drop of suspension thus obtained was
placed on a clean glass slide. The slide containing
microspheres was mounted on the stage of the
microscope and diameter of at least 100 particles was
measured using a calibrated optical micrometer [14].
Percentage yield:
The percentage yield of different formulations was
determined by weighing the microspheres after
drying. The percentage yield was shown in table
no.12, and percentage yield was calculated as follows.
Total weight of microspheres
% Yield = x 100 Total weight of drug and polymer
Drug entrapment:
The various batches of the microspheres were
subjected to estimation of drug content [15]. The
microspheres equivalent to 100 mg of albendazole,
were accurately weighed and crushed. The powdered
of microspheres were placed in 100 ml of methanol
for overnight. This solution is then filtered through
whatmann filter paper. After filtration, use this clear
supernatant solution to measured absorbance at 291
nm by using UV-visible spectrophotometer.
Calculated drug concentration % Drug entrapment = x 100
Theoretical drug concentration
Swelling behaviour study [15]:
A 100 mg of albendazole loaded TSP-alginate
microspheres were soaked in phosphate buffer pH 7.4
and 0.1N HCL separately for 12 hrs to evaluate
swelling behaviour. The swelled microspheres were
removed at 1 hr predetermined time interval and
weighed after drying the surface using tissue paper.
Swelling index was determined by following formula:.
Weight of microspheres - Dry weight of After swelling microspheres Swelling Index = x 100 Dry weight of microspheres
In-vitro release studies [16]:
The in-vitro drug released studies of the microsphere formulation containing albendazole were carried out
using USP dissolution test apparatus type-II
[Electrolab (TDT-08L)]. Weighed amount of
microspheres equivalent to 400 mg to the total weight
of drug used in microsphere formulation, they were
packed in muslin cloth and placed in the basket. The
dissolution medium consisted of 900 ml of 0.1N HCL
for the first 2 hours, followed by pH 7.4 phosphate
buffer for the remaining time period up to 24 hours.
The temperature of the medium was maintained at
37±0.50C. The speed of rotation of the basket was kept
at 50 rpm. Aliquots of 10 ml were withdrawn after
every hour for a total of 24 hours. The samples so
withdrawn were replaced with the fresh dissolution
medium to maintain the sink condition throughout the
experiment. The collected aliquots were diluted with
suitably medium to determine the absorbance at 291
nm for albendazole by using U.V. visible
spectrophotometer.
Compatibility study by FT-IR [17]:
Drug-excipients compatibility was studied by using
Japan) used for the drug-excipients interaction study.
A preliminary study was carried out with formulation
excipients to determine drug-excipients interaction or
compatibility. Drug-excipients compatibility study
included Albendazole, sodium alginate and tamarind
polysaccharide. Albendazole was uniformly mixed in
1:1 ratio with the excipients and the mixture was
placed in glass vials. Vials were sealed by carnauba
wax were kept at room temperature and 40°C and 75
% RH. After 30 days sample were withdrawn and
observed for change in color and chemical change by
recording FT- IR spectrums. The scanning range was
4000 to 400 cm-1 .
Compatibility study by DSC [18, 19]:
Differential scanning colorimetry was performed on a
Mettler DSC-6220, Japan instrument with a thermal
analyzer. Under nitrogen flow of 20 ml/min, sample
weights 2 mg for albendazole and 2 mg for
drug-polymer mixture were sealed in aluminium pan, and
heated at a scanning rate of 10 ºC/min from 40 ºC to
300 ºC. An empty aluminium pan was used as
reference.
Scanning electron microscopy:
The scanning electron microscopy was performed on
Hitachi high technologies corporation-S4800 type II,
Japan. From the formulated batches of microspheres
were examined for surface morphology and shape
using scanning electron microscope. Morphology
details of the specimens were determined by using a
scanning electron microscope (SEM). The samples
were dried thoroughly in vacuum desiccator before
mounting on brass specimen studies. Sample was
fixed on carbon tape and fine gold sputtering was
applied in a high vacuum evaporator. The acceleration
voltage was set at 20KV during scanning [20].
Kinetic modelling [21, 22]:
To analyze the mechanism of release and release rate
kinetics of the dosage form, the data obtained were
fitted into Zero-order, First-order, Higuchi matrix, and
Peppas model using PCP-DISSO -v3 software. Based
on the r-value, the best-fit model was selected .
Accelerated stability study: [23]
Accelerated stability study of formulation was carried
out as per ICH Guideline to point out any visual
physical or chemical changes made in the formulation
after storing it at elevated temperature and humidity
conditions. Chemical and physical stability of
microsphere formulation was assessed at 40 ± 2 °C
and 75 ± 5% RH as per ICH Guidelines. Microsphere
was filled in sealed vial with aluminium foil and stored
for 180 days in stability chamber (CIS-24 REMI
Instruments Ltd, India). Samples were analyzed for
drug content and % cumulative release during time
period of 6 months.
RESULTS AND DISCUSSION
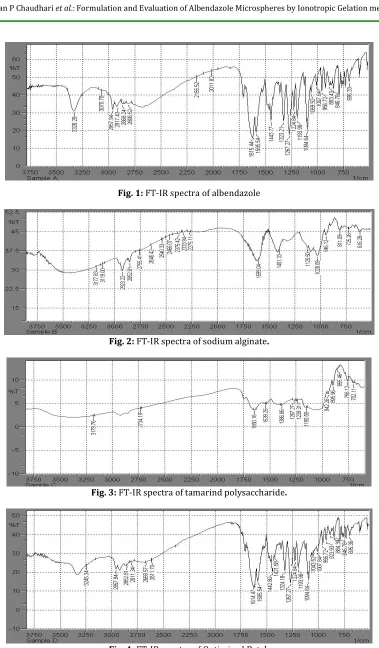
FT-IR characterization of albendazole:
IR spectra for albendazole, sodium alginate, tamarind
polysaccharide and physical mixture of albendazole
are given in fig.1-3. Major functional groups of
albendazole (C-H stretching of benzene ring) at 1477
and 1446, (C-H Stretching of alkane) at 2960,( C=C
Stretching of aromatic ring) at 1720,(COOH)at1589,
(-COO- Bending of Ketone) 1708 (C=N stretching) at
1627 (N-H Stretching of amine ) at 3331,( C-N
Vibrations ) at 1139 can be seen in spectra of
individual drugs as well as in spectra of physical
mixture. So there is no interaction between
albendazole and sodium alginate, tamarind
polysaccharide the results of the above study show
that various peaks which were observed in official
spectra of albendazole matches with obtained spectra
of albendazole which confirms about the identity and
purity of drug.
The FT-IR spectra of albendazole, sodium alginate,
tamarind polysaccharide and mixture of drug-polymer
were recorded shown in fig.no.16-19. No any peak
observed in IR spectra indicating no chemical
interaction between drug and polymers. It also
confirmed the stability of drug during
Fig. 1: FT-IR spectra of albendazole
Fig. 2: FT-IR spectra of sodium alginate.
Fig. 3: FT-IR spectra of tamarind polysaccharide.
Fig. 4: FT-IR spectra of Optimized Batch
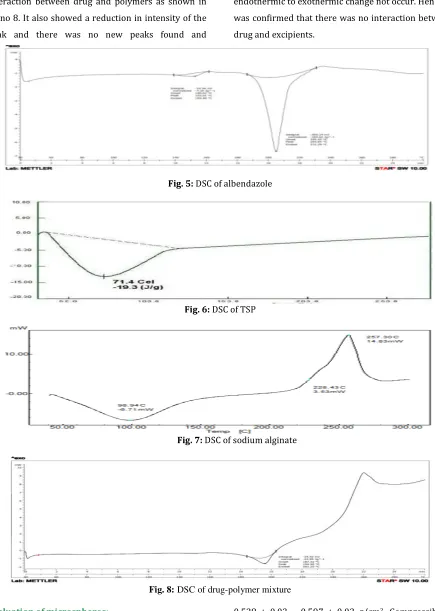
Differential scanning colorimetry:
The differential scanning colorimetry of the
albendazole, sodium alginate, tamarind
polysaccharide and the drug + polymer was recorded
as shown in Fig no.5-8 The DSC thermogram of
interaction between drug and polymers as shown in
fig no 8. It also showed a reduction in intensity of the
peak and there was no new peaks found and
endothermic to exothermic change not occur. Hence, it
was confirmed that there was no interaction between
drug and excipients.
Fig. 5: DSC of albendazole
Fig. 6: DSC of TSP
Fig. 7: DSC of sodium alginate
Fig. 8: DSC of drug-polymer mixture
Evaluation of microspheres:
All the formulations show angle of repose value in the
range of 23°.61’- 29°.62’. The values for bulk density
were found in the range of 00.437 ± 0.03 - 0.476± 0.01
gm/cm3. Tapped density was found to range from
0.528 ± 0.03 – 0.597± 0.03 g/cm2. Compressibility
index were found in the range of 13.60 % - 19.96 %.
Respectively, Hausner’s ratio was ranging from
1.159-1.316, i.e., all the preparation showed that they had
Table 2: Physical parameters of albendazole Microsphere
Batches Angle of Repose (θ) Bulk Density
(g/ml)
Tapped Density (g/ml)
Carr’s Compressibility
Index (%)
Hausner’s Ratio
F1 23.77±0.13 0.467 ± 0.1 0.573 ± 0.03 16.96± 0.13 1.205± 0.02
F2 28.86±0.99 0.464 ± 0.1 0.550 ± 0.01 14.74± 031 1.174± 0.01
F3 24.83±1.38 0.455 ± 0.3 0.587 ± 0.01 19.96± 0.26 1.257± 0.04
F4 23.94±0.51 0.465 ± 0.3 0.547 ± 0.02 14.79± 0.18 1.177± 0.01
The average particle size of the microspheres was
calculated it’s in the range between 752-912 µm. The
percentage yield of different batches was determined
by weighing the microspheres after drying. The
percentage yields of different formulation of sodium
alginate-TSP microsphere were in range of 62.5 -
74.95 %, the drug entrapment efficiency of different
batches of microspheres was determined. The
entrapment efficiency was in the range of 67.38% -
87.60%, as shown in table no.3. Drug entrapment
efficiency was increased when the crosslinking agent
increases. 10 % of Cacl2 shows the maximum drug
entrapment as compaired with the 5 % of Cacl2.The
drug entrapment efficiencies were increased with
decreasing TSP to sodium alginate blend ratios and
increasing cross-linking concentrations. This may be
due to the high degree of cross-linking.
Table 3: Data for Percentage yield, percentage loading and encapsulation efficiency of microspheres.
Batches Mean particle size (µm) Percentage yield (%) Entrapment efficiency (%)
F1 912.10 ± 0.2 62.5 ± 0.9 67.38 ± 0.3
F2 806.20 ± 1.2 68.12 ± 1.7 74.12 ± 0.12
F3 886.09 ± 1.9 72.87 ± 1.1 76.14 ± 0.14
F4 751.10 ± 0.5 74.95 ± 0.5 87.60 ± 0.23
n = 3
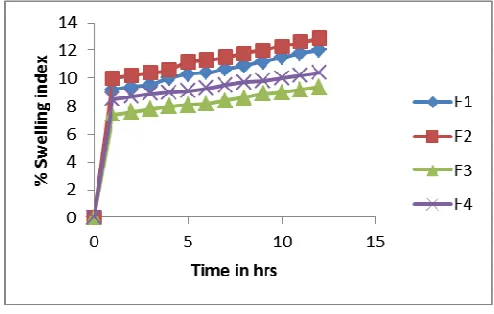
Swelling behavior of albendazole loaded TSP-alginate
microspheres was evaluated in simulated gastric
medium 0.1N HCL, and intestinal pH 7.4. The swelling
index profile of these microspheres in both the pH
were shown in fig. no.9.The swelling index of
albendazole loaded TSP-alginate microspheres was
lower in 0.1N HCL in comparison with swelling index
in phosphate buffer pH 7.4. The swelling index of
TSP-alginate microsphere in 0.1 N HCL was found to be
very low because shrinkage of sodium alginate at
acidic medium. This might help to avoid drug release
at upper part of gastro intestine hence appropriate
amount of drug can be deliver to colonic region.
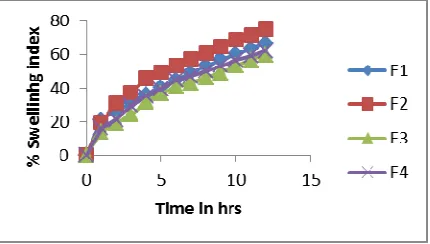
The results of TSP-alginate microsphere for swelling
index in phosphate buffer pH 7.4 shows better than at
acidic medium. The formulation batch F2 shows
higher swelling at basic pH because of hydrophilic
properties of TSP and pH dependant properties of
alginate. The calcium chloride cross linking was also
affect the swelling i.e. higher degree of crosslinking
shows lower swelling while at lower degree of
crosslinking shows higher swelling of microsphere. F1
and F2 formulation shows 42.4 %, 53.3 % swelling
index (Conc. of calcium chloride is 5 %) while F3 and
F4 formulation shows 44.6 %, 41 % swelling index
(Conc. of calcium chloride is 10 %). The graphical
representation for these results shows in fig. no.10.
Fig. 10: Swelling behaviour of microsphere at phosphate buffer pH 7.4.
The microsphere formulations of albendazole
containing sodium alginate and TSP as polymers, in-vitro drug release study was carried out for 12 hrs in 0.1N HCL and pH 7.4 phosphate buffers to all F1-F4
formulated batches at 370 ± 0.50 C, 50 rpm. The release of albendazole from sodium alginate-TSP
microsphere was 8.2 ± 0.63 (F2) and 8.68 ± 0.79(F3) at 0.1N HCL after 2 hrs, while 91.88 ± 0.77(F2) and 76.87±0.50 (F3) at pH 7.4 phosphate buffer after 12 hrs. F2 shows the higher release of drug with
maximum swelling index hence it was better
formulation. Results of in-vitro drug release shown in fig no.11.
The release of albendazole from TSP-alginate
microspheres at gastric pH was comparatively slow
than intestinal pH. This was due to the shrinkage of
alginate at acidic pH (as alginate is pH sensitive),
which might slower the drug release from
TSP-alginate microspheres. The reason of the higher drug
release in phosphate buffer, pH 7.4 was due to the
higher swelling rate of these microspheres, while
higher the concentration of crosslinking agent could
produce high degree of crosslinking thereby lower the
drug release from TSP-alginate microsphere
formulation.
Fig. 11: in-vitro drug release profile of formulation
The in-vitro release data was applied to various kinetic models to predict the drug release kinetic
mechanism and are shown in table no.4. As per
PCP-DISSO -v3 software the best fit model for the
optimized batch F2 formulation is the Korsmeyer
Table 4: Drug release kinetic modelling
Batch code Zero order First order Matrix Korsmeyer peppas
(R) (K) (R) (K) (R) (k) (R) (K)
F1 0.816 4.886 0.910 -0.082 0.935 17.464 0.972 7.577 F2 0.843 5.119 0.952 -0.090 0.938 18.257 0.961 5.808 F3 0.867 4.046 0.917 -0.060 0.915 14.227 0.967 5.731 F4 0.825 4.636 0.928 -0.075 0.919 16.388 0.971 5.189
Formulation F2 was the optimized batch of
TSP-alginate microsphere which were shows better drug
release with higher swelling index, also its don’t show
any drug-polymer interaction in compatibility study.
Hence it was selected for the further accelerated
stability study.
Accelerated stability studies (AST) were carried for
optimized formulation F2 as per ICH Guideline by
exposing it at temperature (40°C) with relative
humidity (75%RH) for 180 days and analyzed the
sample at the interval of 45 days. The colour, % drug
content efficiency and % cumulative release was
calculated as shown in 5.
Table 5: Accelerated stability study of F2 formulation
Sr. no. Days Colour Drug content (%) Cumulative release (%)
Mean ±±±± SD (n=3) 1 0 Buff white colour 74.12 ±0.70 84.67±0.45
2 45 No change 74.63±0.20 84.63±0.97
3 90 No change 74.46±0.16 83.63±0.32
4 135 No change 74.35±0.9 83.62±0.78
5 180 No change 74.21±0.12 83.58±0.16
The accelerated stability study for F2 formulation
shows that drug content was in between the range of
74.12-74.35 % and its cumulative release was
84.67-83.62 %. The colour of microspheres was also not
changed. Hence formulation F2 was stable at specified
conditions.
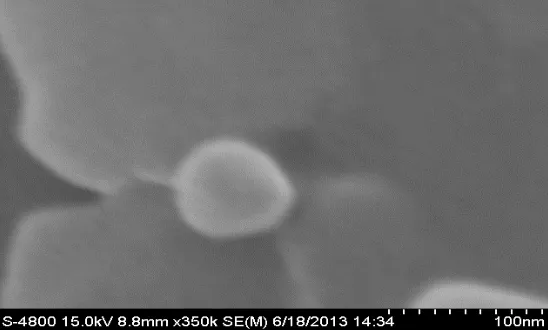
The surface morphology of microspheres were
examined by scanning electron microscopy as shown
in figures (fig no.28) illustrating the
microphotographs of formulation F2. The
microspheres were spherical with no visible major
surface irregularity. Few wrinkles and inward dents
were appeared at the surface of microsphere. It may
due to collapse of microspheres during the drying
process.
CONCLUSION
The F-2 batch microsphere prepared from the
albendazole- TSP-sodium alginate as a natural
polymers in that the drug-polymer ratio is, 1:1 and
5%, 10% concentration of calcium chloride was used
as crosslinking agent. Albendazole microsphere F1 &
F2 formulation releases the maximum drug (83.76 %,
& 87.67 %) for 12 hrs. F2 Formulation has maximum
swelling capacity than F1 so it releases the maximum
amount of drug. Hence the F-2 formulation is
optimized formulation on the basis of release pattern.
The kinetic study was carried out and the best fitted
kinetic model for F-2 batch was Korsmeyer peppas
have R value 0.961 and k value was 5.808.
ACKNOWLEDGEMENT
Authors are thankful to Prof. Dr. V. R. Patil, Principal,
TVES’s Honorable Loksevak Madhukarrao Chaudhari
College of Pharmacy, Faizpur, for providing the
required facilities for research work and valuable
guidance.
REFERENCES
1. Allen L.V., Popovich N.G., Ansel H.C., 2005,
Pharmaceutical Dosage Forms and Drug Delivery
Systems New Delhi, BI Publication, 265.
2. Swarbrick J., Boylan J. C., 2002, Encyclopedia of
pharmaceutical technology, 2nd Edn, 1, Marcel Dekker
Inc. New York, 505.
3. Vyas S.P. and Khar R.K., 2002, Targeted and
Controlled drug delivery novel carrier system, 1st
Edn, CBS Publishers and Distributors, New Delhi,
447-449,b.
4. Venkatesan P., Manavalan R. and Valliappan K., 2009,
Microencapsulation a vital technique in novel drug
delivery system, J Pharm Sci Res, 1, 26-35.
5. Chain Y.W., 1992, Novel Drug Delivery System, 2nd
Edn, 50, Marcel Dekker Inc. New York, 161-172
6. Indian Pharmacopoeia, Government of India,
Ministry of Health and Family Welfare, Ghaziabad.
The Indian Pharmacopoeia Commission Publisher.
New Delhi. 2007; 2,692.
7. British Pharmacopoeia, Vol -1. Forth edition The
controller of Her Majestry’s Staionary Office for the
Department of Health on behalf of the Health
Ministers London, 2003, PP.65-66.
8. Rowe, R.C., Sheskey, P.J., Weller, P.J., 2003, Handbook
of Pharmaceutical Excipients, fifth ed., The
Pharmaceutical Press, London. pp. 656-659.
9. Phani G.K, Gangarao B., Kotha N.S., Lova R., 2011,
Isolation and Evaluation of Tamarind Seed
Polysaccharide being used as a Polymer in
Pharmaceutical Dosage Forms, RJPBCS, Volume 2
Issue 2 Page No. 274-290.
10. Christina.E, 2012, Preparation of Microsphere of
Diclofenac Sodium By Ionotropic Gelation
Technique.Int J Pharm Sci, Vol 5, Issue 1, 228-231
11. Martin A., Swarbrik G., 1991, Physical pharmacy,
physical chemical principal of pharmaceutical sci. 3rd
ed. Varghese publication house, 518-519,a.
12. Aulton M.E., 2002, Pharmaceutics: The science of
dosage form design, 2nd Edn, Churchill Livingstone,
New York, 290-291.
13. Banker G.S., Rhodes C.T., 2002, Modern
Pharmaceutics, 4th Edn, Marsel Dekker, Inc. 270
Madisoavenue, New York: 635-668.
14. Tekade B. W., Jadhao U. T., Thakare V. M., Yogita A.
Chaudhari., Vaishali D. Patil, Chaudhari C. S. 2013,
Design and In-vitro Evaluation of Ethyl Cellulose
Based Floating Microspheres Containing Antidiabetic
Drug. Asian J of Bio. and Pharm Sciences; 3(23),
33-37.
15. Pal D., Nayak A.K., 2012, Novel tamarind seed
polysaccharide-alginate Mucoadhesive microspheres
for oral gliclazide delivery: in vitro–in vivo
evaluation. Drug Delivery, 19(3): 123–131.
16. United States of Pharmacopeia-National Formulary.
2004a. USP 32 – NF 27. The Unit States
Pharmacopeial Convention, Rockville, MD. PP.53-54.
17. Chatwal G. R., Anand S. K., 2007, Instrumental
method of chemical analysis, Himalaya publication,
Mumbai, 2.44-2.45
18. Schimdt, P., 2007. Secondary electron microscopy in
pharmaceutical technology. In: Swarbrick J., Boylon
J.C. (Eds.), Encyclopedia of Pharmaceutical
Technology. 3rd Edn. vol. 5. Marcel Dekker Inc. New
York, pp. 3217- 325.
19. Duerst, M., 2007. Spectroscopic methods of analysis:
infrared spectroscopy. In: Swarbrick J., Boylon J.C.
3rdEdn. vol. 5. Marcel Dekker Inc. New York, pp.
3405- 3418
20. Mali S, Nighute A, Deshmukh V, Gonjari I, Bhise S,
Microcrystals: For Improvement Of Solubility And
Dissolution Rate Of Lamotrigine, Int.J.Ph.Sci.,
May-Aug 2010, 2(2), 515-521.
21. Higuchi Mechanism of sustained action medicament,
Theoretical analysis of rate release of solid drugs
dispersed in solid matrices, J.Pharmsci
,52:1145-1149,(1963).
22. Korsmeyer RW, Gunny R, Peppas NA, Mechanism of
solute release from porous hydrophilic polymers,Int
J Pharmaceutics, 15: 25-35,(1983).
23. Methews B R, Regulatory aspects of stability testing
in Europe, Drug Dev.Ind.Pharm.,25: 831-856,(1999).
How to cite this article: UmUmeessh.h. BB.. PaPattiill , Kundan P. Chaudhari*, Umesh T.Jadhao, Vinod M.Thakare, Bharat W. Tekade; Formulation and Evaluation of Albendazole Microspheres by Ionotropic Gelation method; J. Adv. Pharm. Edu. & Res. 2014: 4(1): 114-124.