HOW THE EVALUATION OF THE MEAN DOWN TIME BY
THE NORMAL DISTRIBUTION ALLOWS US TO TRACE A
ROADMAP OF CONTINUOUS IMPROVEMENT
Hamza Salhi
1, Aziz Soulhi
2and
Rabiae Saidi
2 1Laboratory LASTIMI, CEDOC EMI, Rabat, Morocco2
National Higher School of Mines, Rabat, Morocco E-Mail: [email protected]
ABSTRACT
The goal of this article is to establish, in order of priority, the choice of the workshop to be launched in a process of continuous improvement; based on a statistical study that will demonstrate the utility of applying the normal law on the Mean down Time (MDT) as an indicator of Lean maintenance. According to the distribution given by the statistical study of the latter, we will be apt to prioritize the starting of a workshop in particular among others (skills Development, SMED, VSM).
Keywords: continuous improvement, skills development, decision making, SMED, VSM, lean maintenance.
INTRODUCTION
Continuous improvement is a mode of management that encourages incremental improvements that are component of the daily quest for efficiency and progress, increasing the creativity of ever body in the organization.
In a time where all companies are looking to advance of its competitors, the search for the winning duo product/ price becomes a necessity.
However, it is uncomplicated said than done, as companies start encountering difficulties when tracing the roadmap of continuous improvement, due to the lack of proper prioritization between several projects, which leads us to the following enquiry: how can these priorities be set in a continuous improvement process?
In order for this to happen , there are several tracks to follow, including the approach based on the statistical study applying the normal law on a key indicator of maintenance: the MDT (average downtime) which will lead us subsequently to prioritize various workshops of continuous improvement (Skills Development, SMED, VSM ...).
METHODOLOGY
The methodology used is as follows: First, the continuous improvement will be presented through various methods used in this research: VSM, SMED, Skills Development...
Then, the normal law will be presented, and its mathematical equations defined, in addition, we will present maintenance indicators that serve our problem. The case study will then highlight the concern for the prioritization between continuous improvement workshops, then define the process of the host organization of the topic of our research.
The application of the normal law on the Maintenance Mean Time indicator (MDT) taken by the maintenance department will enable us then to draw the roadmap of our study which will be our modest scientific contribution.
Finally, the Discussion section will serve to show the effectiveness of the statistical study method of the MDT indicator on workshops prioritization for the case study besides as its strengths and weaknesses.
RESULTS
Presentation of continuous improvement and some useful tools
In actual hugely competitive business environment, it has become evident that only the competent would survive. Organizations invest in diver’s attitude of running their business so as to stay competitive [1].
In such tough times, only one concept can make a difference and provide an edge. A concept that will directly contribute to profitability profit. That is without contest the concept of continuous improvement.
No matter if you invest in business management systems or services, they can always be improved. There is a saying that stands in any organization as well as in daily life - "If you can't measure it, you can't improve it."
The tools to which you will be exposed in this article are not exhaustive, and some are dedicated to our problematic.
Presentation of Value Stream mapping (VSM)
The Value Stream Mapping (VSM) is a method was raised in the second third of the twentieth century by the Toyota Motor Company and quickly became one of the fundamental methods of continuous improvement and lean management [2, 3]. Its philosophy is based on the graphic presentation of the flow of the door-to-door value chain in a company, specially the receipt of the customer's request through all the logistic processes and transformation towards the delivery of the final product. The VSM method strictly divides all processes into two groups: value added (VA) and non-value added (NVA).
possible to identify a storage location, determine a total manufacturing lead time, or realize how long VA is in other words inactive items and stored in warehouse shelves. The VSM card can also serve as a clue to follow decision-making and process improvement processes. In addition to that, it can be used as a future state visualization tool [3].
VSM is a graphical method using a large number of icons presenting each important element of the value chain.
The whole process is based on the achievement of customer response time (customer demand over time), which is then compared to a current production performance. The calculation of VA time is simply done by the sum of VA processes continuously from first to last. The same procedure is also used for the calculation of the NVA time.
The most important element of ANV processes are inventories. Their value represents the period during which the company is over-supplied according to its working time. The value of this indicator can be calculated by dividing the number of stored items of the product (according to its nomenclature) by the number of their daily needs (depending on customer demand).
The mission of VSM is to eliminate all these useless inventories and reduce the funding allocated to them. In the next step, such financing could be used, for example, to stabilize cash flow, pay additional dividends or finance new projects. There are usually various problems hidden behind the inventories, making the achievement of approved strategic goals much more difficult. The VSM method usually directly initiates the discovery of the appropriate solution.
Figure-1. VSM example. [17]
Presentation of Single Minute Exchange of Die (SMED)
The SMED method was developed at the Toyota factory. This method of organization seeks to systematically reduce the time of series change, reflecting on productivity and costs in the industry [4], with a quantified objective (Standard AFNOR NF X50-310) The SMED method allows us:
- Saving time: making tool changes in a single digit time unit (1 to 9 minutes);
- Productivity gains: Flexibility of machines and factories. That is improving their capability to quickly
change manufacturing, reduce the stop for tool change and if possibly eliminate it;
- Money saving: reduce the minimum lot size. Indeed, if the series change times become zero,
then we can consider a unit manufacturing without increasing costs as in less expense for tool change and more unit production.
The steps of the method [13]
- It is necessary to analyze, measure internal operations (machine off) and external (machine running). [Machine data, operations, employers ...]
- It is necessary to convert the internal operations into external operations (to transform them).
- The time of internal and external operations must be reduced.
Analyze: distinguish internal and external operations.
This first step must make it possible to create an inventory of the whole operations taking place during a change of series. For this, we must gather all the information (Machine data, operator ...)
Determine: extract external operations. By distinguishing 2 types of operations:
- Internal operation: any action requiring the stop of the machine or process.
- External operation: any action that does not require the machine or process to be stopped (machine running).
Convert: internal operations in external operations.
The preparation, cleaning or packaging of finished products can be done off machine stop.
Reduce: the times of the internal operations. Find solutions to optimize the operations.
Synchronize tasks to save time by running them in parallel.
Standardize and optimize functions and operations: use a single screw size, unify adjustment ribs,
Set up the 5S on all equipment and tools.
Delete if possible unnecessary tasks: travel, test series…
Some terms of the SMED method:
- Adjustment losses: Any activity that causes a cycle or test of the machine, create a part that must be inspected and eventually removed or reformulated [5].
- Lot: quantity of articles treated together [6].
- Change: The process of moving from one product or part number to another in a machine or series of linked machines by changing parts, dies, molds or accessories, also admitted as installation. The changeover time is measured by the time elapsed between the last pass of the task and the first part of the process after failover [6].
- Die Set: This is the tooling that is removed and replaced in a punch press during change. A die set consists of a set of male punches and female dies that, when pressed against each other, create a hole in the room or form the part creating features desired by the customer.
- Downtime: Production time lost due to planned and unplanned outages. Planned downtime includes scheduled outages for activities such as team start-up, production meetings, changes to produce other products, and planned maintenance. Unplanned stops include shutdowns for breakdowns, machine adjustments, equipment shortages and absenteeism [6].
- External configuration: the part of the configuration that can be performed while the machine is still running, for example, preparing a matrix to be used for the next run [5].
- Internal configuration: The part of the configuration that must be performed when the machine is stopped, for example, by removing and fixing dies. [5].
Concept of skills development:
The theorization proposed by professional didactics places pragmatic concepts at the heart of skills and their development [7]. We consider as essential the concept of professional competence and its relation with the accomplishment of the action in a work situation [8].
Two aspects of competencies manage be differentiated: "knowing what to do" and "being apt to do it". "Knowing what to do" reflects the need to make a diagnosis of the particular situation to be treated, a diagnosis that may remain implicit. "Being able to do" refers to the effectiveness of the action.
Understanding and effectiveness are in a complex relationship: knowing what to accomplish not mean allow doing it and, conversely, the action can be successful without being understood (Savoyant 2004). Piaget (1974) differentiated two stages of action coordination: active action coordination and conceptual coordination, steps taken in the skills development analysis; conceptual coordination being understood as the moment "when the understanding of action comes to make up for its success, thus constituting a decisive progress in the organization of action" [9].
While we are implicated in pragmatic concepts, we are excited in the "knowledge" side of skills, but the term "pragmatic" emphasizes that conceptualization is at the service of ongoing action, which distinguishes it from epistemic theorizing. Indeed, a "practitioner is an opportunist [... who] does not seek the completeness or coherence of his knowledge, he seeks efficiency" (Pastré 1997). Pragmatic concepts must be approached in this context: they are the result of a process of development of conceptualization in and for action.
We submit a quick overview of the place of the theory in different approaches, before considering how the relationship between theoretical (scientific and technical) concepts and pragmatic conceptualization in the growth of professional skills is changing.
Presentation of the normal distribution
The famous German mathematician, Carl Friedrich Gauss (1777, 1855) conceives a continuous statistical law, called the normal distribution or law of Laplace Gauss, whose distribution is represented by the famous curve in bell. The adjective "normal" is explained by the fact that this law describes and models random concrete and natural statistical situations [10].
- It is easy to forget that the Gauss curve is only a graphical representation of an ideal theoretical distribution, of a population for which all individuals have the same value for a parameter (the average), with simply small variations which are the result of the combination of a large number of random factors (is absolutely uncertain, independent, and of the same order of degree, thus compensating for one another. was not the case, we would speak of a systematic gap) [10].
- This theoretical model is excellent, it is drawn not from the statistics, but from the laws of probability: it is the graphical representation of the law of a variable X continuous, varying from infinity to infinity, whose Probability density is expressed as:
(1)
Equation 1: normal distribution equation [12] µ : Expectation, gives the average value.
f(x) : probability density function.
σ: The standard deviation, given the dispersion around the mean (with n: observation number) .
𝜎 = √∑(𝑥−𝜇)𝑛 2 (2)
Equation 2: Standard deviation equation [18] x: x is a continuous random variable that follows the
reduced normal centere distribution.
σ² : the variance
The advantage of a "normal" distribution is that it is totally defined by its mean and its standard deviation. The size of the population does not affect. This property will make possible a number of calculations on populations whose distribution is supposed to be "normal" in view of the distribution of samples taken at random in this population [11].
Figure-3. Example of normal distribution [11].
Figure-4. 6 Sigma Distribution [11].
The standard deviation is a statistical indicator, will measures the dispersion of the information, the notion
of performance as for it, remains inversely proportional to the dispersion. Continuous improvement can therefore play a considerable part in reducing the latter.
Presentation of some maintenance indicators
Indicators are fundamental tools for decision support, for all those who are at the head of the management of a process, whatever it may be. It is indeed just as inconceivable to drive effectively without a dashboard (set of indicators: speedometer, odometer, fuel level ...) than to properly manage a process without [13]: measure its performance;
follow the evolution of its performances;
compare its performance to the objective set.
Figure-5. Graph of maintenance indicators [15].
RELIABILITY is the ability of an entity to achieve an approriate function for a disposed time interval, under given conditions (NF EN 15341 [14]):
Mean Time To Failure (MTTF)
Average duration of operation of a material before the first failure [14].
Mean Time to Repair (MTTR)
Average repair time MTTR = Σ Downtime / Number of stops [14].
Mean Up Time (MUT)
Average time of operation after repair [14].
Mean Down Time (MDT)
Average downtime (breakdown detection time + repair time + release time) [14].
Mean Time between Failure (MTBF)
Average duration of downtime between two consecutive failures, MTBF = Σ Uptime / Number of failures or number of periods of good operation [14].
We have the relation, MTBF = MDT + MUT (In some cases we have MDT = MTTR (Mean Time to Repair)).
For many systems, MDT is weak in front of MUT; and therefore the difference between MTTF and MTBF is small.
Case study
The coming section presents a case study of a mineral grinding industry in Morocco.
The goal of this study is to give a comment on the statistical study of a maintenance indicator authorizing us to make an effective decision between different workshops of continuous improvement (5S, SMED, 8D ...)
processes, loss of money due to the wrong choice of the method, and a priori, dismal results.
The prioritization of the workshops is even more important now that the sector is experiencing a remarkable growth in the field of grinding calcium carbonates, hence our interest in the subject
To do this, we will proceed to the presentation of the process which will see the application in workshops of the continuous improvement by using the statistical method of the normal law with calculation software there goes a presentation of the grinding process in our case:
Figure-6. Flowchart of grinding process of CaCO3.
Description of the operating principle
The MicroMix grinding shop has only one grinding line, which essentially comprises a device for dosing and supplying raw material, a hammer MILL, a vertical pendular mill with incorporated separator with adjustable speed, a bag filter, a ventilator, screws and bucket elevators to take the finished product to storage silos.
From the storage hangar of the raw material, the dosed material arrives at the hammer crusher which contains 8 hammers, after the pre-grinding, thanks to bucket elevators, the material passes to the pendular mill, to grind and produce the very fine calcium carbonate which can reach a particle size which reaches up to D50 = 5 μm.
The effect of the grinding comes from the impact of the material by the body of grinding rollers set in motion by the rotation of the latter.
The ventilator draws the crushed product and transports it through a gas flow to the separator. The latter performs a grain selectivity and rejects groats having fineness greater than the standard defined according to each quality of the product. Calcium carbonate having good finesse goes to the bag filter and the refusal falls to the center of the mill to regrind until it reaches the desired fineness.
The adjustment of the fineness is realised by adjusting the velocity of rotation of the separator.
For the bagging part, there are two machines in which the final product is stored in two types of finished products: BigBag or Bag. Integrated bagging machines,
Big bag and bagger, are complete systems for filling valve bags.
The palletization is done automatically using this manipulator arm. The gripper of the KUKA robot is 10 layers of 6 bags for a 1000x1000 pallet.
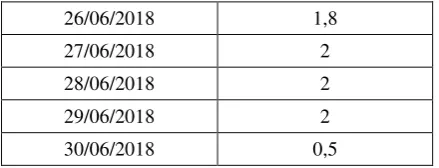
After this presentation of the production workshop we have done our part of research which consists in studying statistically the downtime, to have an idea on the priority of the workshop of the continuous improvement in our factory, here is a table which contains the downtimes of June 2018, which will constitute our sample table in our study:
Table-1. Table of one-month downtime.
days Mean down time
( hour)
01/06/2018 2
02/06/2018 3
03/06/2018 1,5
04/06/2018 2
05/06/2018 3
06/06/2018 2,5
07/06/2018 1
08/06/2018 0,5
09/06/2018 1
10/06/2018 1
11/06/2018 3,5
12/06/2018 2
13/06/2018 3
14/06/2018 2,5
15/06/2018 1,5
16/06/2018 1
17/06/2018 3
18/06/2018 2,1
19/06/2018 2,5
20/06/2018 3
21/06/2018 3,2
22/06/2018 2,5
23/06/2018 3,1
24/06/2018 2
25/06/2018 2
26/06/2018 1,8
27/06/2018 2
28/06/2018 2
29/06/2018 2
30/06/2018 0,5
We will integrate data into a software calculator to do our statistical study (Figure-7):
After the statistical study of the stop table, and using the normal law to determine if the data does not follow the latter, we compare the value of p with the significance threshold. In general, a connotation entrance (denoted alpha or α) of 0.05 can be considered optimal. It such case a 5% of the data may not follow a normal distribution when they are estimate to.
Value of p ≤ α: the data do not track a normal distribution (Reject H0)
If the value of p is below or equal to the punch line level, the assumption is considered null, therefore our data will not follow a normal distribution.
Value of p> α: you can not conclude that the data does not follow a normal distribution (can not reject H0)
If the value of p is higher than the significance level, you cannot dismiss the hypothesis. You are not apt to conclude that the data does not follow a normal law.
Through our results, the null hypothesis indicates that the data follows the normal distribution law. Since the value of p is 0.064, which is greater than the significance level of 0.05, the null hypothesis cannot reasonably be rejected. We conclude that our data follow the normal law and we can proceed to the calculation of the capability of the maintenance process.
Figure-7. Normality test.
Figure-8. Capability test.
As the figure above shows, the Cp indicator that gives an indication of the process performance is equal to 0.87, which is insufficient related to the standard of capability (Cp ≥1.33), a large dispersion occurs then in the maintenance process, which can result in nonconformities, something that requires control, analysis and continuous improvement.
This information will enable us to launch the workshops in their order of priority in order to reduce the dispersion.
In our case:
For the first workshop: after a statistical analysis of the downtimes we concluded that the maintenance process reveals a large dispersion requiring a considerable time of repair, we therefore push to launch in the first place the method value Mapping
(VSM), since that in change management, the framing of the problem through diagnostics and critical process analysis to detect problems becomes a necessity (the 7 MUDA, 3 MURI, 3 MURA as well as the cum value and the none). To do this we will use sub workshops such as: 5M, 5 why.
After the identification of the problems thanks to the VSM workshop, we noticed that the most recurrent problem is the waste of time due to: unnecessary displacement which is one of the 7 MUDA, caused by the lack of tools during the operation, which is mainly due to the loss of tools and equipment and the disorganization of the workspaces.
hours by ensuring the organization, cleanliness and safety of the workshop. Initially, this workshop will assist operators and maintenance technicians in their repair operations (screwdriver, drill, toolbox including keys, hexagon ...) The workshop can then be generalized (Production, Method, Logistics ...)
After analyzing the distribution, the dispersion observed is enormous. It is due to the lack of competence among the maintainers of this organization, therefore a last workshop will be needed: skill’s development which contains trainings on the preventive maintenance in its three forms: conditional, systematic, predictive. This workshop will include training on the use of fault detection equipment such as vibratory analysis, bleeding, ultrasound, and also some lean methods such as: Poka-Yoke (anti-error system) so as not to fall back on the same mistakes, but also the method SMED which will allow us to develop standards of restart, which will reduce the time of putting return into service.
DISCUSSIONS
The method of prioritization of continuous improvement workshops based on the statistical study of the maintenance indicator which is the Mean down Time (MDT) allows for more accuracy in the choice of launching these workshops, especially this sector in need of structuring in Morocco. In addition, this method has permitted us to save time and a great number of manpower in each phase.
However, it does ignore the budget of the company. Although the results acquired are showing effectiveness, especially on the time saving and improvement of competence, this method remains a work in progress, waiting for the budget variant to be integrated in each workshop for us to obtain a much complete and reliable view.
CONCLUSIONS
Through this article, we provided an answer to the issue of decision-making between different workshops of continuous improvement thing that was quite ambiguous and vague.
Al though , after the use of a statistical method (in this case the normal law) on a maintenance indicator which is the Mean Down Time, we were offered an answer, thanks to the test, on the normality of the data entries, we found that these samples are following the normal law, we proceeded then to the calculation of the process capability, which in turn gave us Cp = 0.87 which is considered insufficient by the normal distribution, leading us to non-compliant samples , hence our decision to prioritize the workshops according to a mathematical and logical approach.
After dense studies of the case of the MICROMIX mineral grinding company in Morocco, we
’
requires starting a VSM workshop VSM, to make a diagnosis and an inventory for each process and especially for the maintenance process (the heart of our research), then launch a 5S workshop to chase major wastes affecting maintenance especially downtime. As well as launching a skills development workshop, for the purpose of training people for these methods and the different types of maintenance.
Finally, we managed to draw the famous roadmap, the object of our research, and we expect in a second time to address this issue by incorporating the notion of budget in each workshop.
REFERENCES
[1] Halevi Gideon. 2001. handbook of production management methods. OXFORD: Butterworth. Heinemann. ISBN07-506-5088-5.
[2] Poôr P. 2014. Strenghtening of boundary Processes in a company using specific computer aided. Facility management Software. In: IEEE 12th International symposium On applied machine intelligence and informatics. Piscataway: IEEE, 2014.S. 257-561. ISBN: 978-a-4799-3440-9.
[3] Rottac Tomas. 2014. Analysis and following optimization of bussiness diploma Thesis. PLZ en: Faculty of Economics, University of West Bohemia, 99S.
[4] Goddard W, Boost the productivity of your business by just-in-time, Monsieur's Edition,1990.
[5] Rubrich L, and Waston L. 2004. Implementing World class manufacturing, Fort Wayne, IN: WCM Associates.
[6] Marchivnski C and SHOOK J. 2003. Lean Lexicon: A graphical gloassary for Lean Thinkers, Brookline, MA: Lean entreprise Institute.
[7] Pastré P. Mayen, P.C Vergnaud G. 2006. Professional didactics. French Review of Pedagogy. 154: 1-55.
[8] Rogalski J. & Marquié J.C. 2004. Evolution of skills and performance. In J.-M. HOC, &F. Dasses(Eds), Ergonomic Psychology: Current Trends (pp. 141-173). Paris. PUF.
[9] Weill. Fassina A., G. Pastré P. 2004. Professional skills and their development. In P.Falzon (Ed.), ergonomics. pp. 213.231.
[11]http://bazinconseil.fr/sixsigma.html. (Consulted on 2 August 2018).
[12]https://fr.wikipedia.org/wiki/Loi_normale. (Consulted on 2 August 2018)
[13]Jean-Marc Gallaire. 2008. The tools of industrial performance, Eyrolles / Editions d'organization. p. 208.
[14]https://www.afnor.org. (Consulted on 7 August 2018)
[15]http://jackadit.com. (Consulted on 7 August 2018)
[16]https://www.ribcon.com. (Consulted on: 09 August 2018).
[17]https://www.edrawsoft.com. (Consulted on: 10 August 2018).