Expert System for Sweep Frequency Response Analysis
of Transformer Using MATLAB
Jitendra kumar
*, Dr.U.prasadr
** *Department of Electrical Engineering, BIT Sindri, Dhanbad, Jharkhand, India, 828123 **
Department of Electrical Engineering, BIT Sindri, Dhanbad, Jharkhand, India, 828123
Abstract- In recent years there have been widespread interests in
Sweep Frequency Response Analysis (SFRA) of transformer. SFRA is popular because without dismantle of transformer we can detect the different faults. SFRA is used for assessment of the mechanical condition of the transformer core and winding. It provides an early indication of the growing problems. This method uses a low voltage sinusoidal signal which contains a sweep of frequencies covering a range between 10 Hz and 2 MHz. This signal is applied at one end and measured on the other end of the winding with one phase at a time and the impedance of the transformer winding over a wide range of frequencies is measured. This method is based on a comparison approach with respect to reference data. It is advisable to have reference tests on the new transformer. Faults which can change either the winding capacitance or the winding inductance are detectable. It is desirable to monitor the mechanical condition of the transformers periodically during their service life to provide an early warning of faults in transformer. In classical method result interpretation of SFRA to diagnosis the fault in power transformer depends upon the experience of human experts. Sometime a high degree of inconsistency and ambiguity have been observed regarding interpretation of result by different human experts, so there is a need to develop expert system for SFRA. In this thesis expert system programming has been developed using suitable MATLAB code. It has been successfully applied to various power transformers.
Index Terms- SFRA,MATLAB,SME
I. INTRODUCTION
weep Frequency Response Analysis (SFRA) method performs measurement at each frequency point of interest. The excitation source generates a sinusoidal waveform of constant magnitude. Since the source is constant and can be maintained for a specified amount of time, the digitizers have ample time to adjust their gain settings, resulting in the higher dynamic range performance. An SFRA scan could take a few minutes depending on the settings used, such as bandwidth and the number of points collected. The test will run slower at low frequencies and will obtain data more rapidly as frequency increases. The bandwidth setting acts like a band-pass filter, which prevents any unwanted noise from entering the receiver. Ideally, the measurement receiver would like to pass only the frequency of interest. Reducing or tightening the bandwidth requirement exponentially increases test time. We must compromise between test time and resolving small signals.
Sweep frequency response analysis method makes qualitative assessment of the mechanical condition of transformer core and winding. The loss of mechanical integrity might occur due to fault currents, winding shrinkage causing release of clamping pressure and transformer transportation. It is expected that a transformer will experience and survive a number of short circuits during its service life, but sooner or later one such event will cause some slight winding movement, and the ability of the transformer to survive further short circuits will then be severely reduced. Another important factor is that significant winding shrinkage can occurs with age, leading to a reduction in clamping pressure and short circuits withstand strength. It is desirable to check the mechanical condition of transformer periodically during their service life. Conventional techniques such as DGA are not able to detect mechanical damage until, it develops into a dielectric or thermal fault, so a SFRA technique is clearly required for the assessment of mechanical condition. Indian roads and rail transport offer far more difficult conditions and internal inspection after receipt of transformer at site or after incidence are often inconclusive which leads to the minor movement in the core or windings. So, SFRA has been recognized as the most sensitive technique to detect such minor winding movement. It provides an early indication of the growing problems. This method consists in applying on one end of transformer winding a low voltage sinusoidal signal made of a sweep of frequencies covering a range between 10 Hz and 2 MHz and measuring on the other end of the winding with one phase at a time. The applied sweep maintains the same level of energy for each frequency analyzed in such a way as to obtain accurate and reproducible results. Little influence from the test set-up is evidenced. This method being essentially based on a comparison approach, it is useful to have reference data, in particular it would be advisable to have reference tests on the transformer when new, so to compare data in later stages of the transformer. This technique consists of measuring the impedance of the transformer winding over a wide range of frequencies. Fault which can change either the winding capacitance or the winding inductance, are detectable. It is desirable to monitor the mechanical condition of the transformers periodically during their service life to provide an early warning of faults.
The application of different diagnostic methods and the knowledge of the design of the transformer play an important role for the correct judgment of the actual condition of the insulating system the main problem by the interpretation of data obtained by different diagnostic methods are to explain differences in results (comparison of fingerprints). It was shown that application of advanced diagnostic methods such as SFRA
deliver reliable information about the health of the transformer [1].
There are two different methods to carry out the measurement of frequency response:
(a) Sweep Frequency Response Analysis (SFRA) (b) Low Voltage Impulse (LVI)
The Sweep Frequency Response Analysis (SFRA) is an analysis technique for detecting winding displacement and deformation (among other mechanical and electrical failures) in power and distribution transformers. SFRA as a diagnostic technique must integrate both off-line measurements and interpretation of the data in order to provide an assessment of the condition of the windings. The record interpretation is presently done by human experts [3, 5].
II. SWEEPFREQUENCYRESPOSEANALYSIS TECHNIQUE
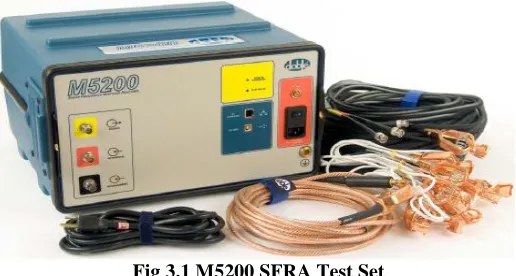
[image:2.612.38.296.483.621.2]Sweep Frequency Response Analysis (SFRA) is a tool that can give an indication of core or winding movement in transformers. This is done by performing a measurement, albeit a simple one, looking at how well a transformer winding transmits a low voltage signal that varies in frequency. Just how well a transformer does this is related to its impedance, the capacitive and inductive elements of which are intimately related to the physical construction of the transformer. The changes in frequency response are measured by SFRA technique which indicates a physical change inside the transformer, the cause of which then needs to be identified and investigated. This technique relies on the fact that transformer windings can be modelled as a network of capacitance, resistance, self-inductance and mutual inductance, the values of these parameters are altered when a fault occurs in the transformer and hence the frequency
Fig 3.1 M5200 SFRA Test Set
response of the winding will change accordingly. The resistance is clearly related to the physical construction of the winding shorted turns etc and would have a distinct effect. Capacitance
indicate damage to the transformer, which can be investigated further using other techniques or by an internal examination. In SFRA method, signals are applied and measured with respect to ground.
III. DEVELOPMENT OF EXPERT SYSTEM FOR SFRA An expert system is a system that attempts to provide a solution to the complex problem or clarify uncertainties where normally one or more human experts would need to be consulted. Typically, such a system contains a knowledge base containing accumulated experience and a set of rules for applying the knowledge base to each particular situation that is described to the computer program. Sophisticated expert systems can be enhanced with additional knowledge base or the set of rules. Step involved for Expert system:
(a) The creation of a knowledge base which uses some knowledge representation formalism to capture the Subject Matter Expert's (SME) knowledge.
(b) The process of gathering that knowledge from the SME and codifying it according to the formalism, which is called knowledge engineering. Expert systems may or may not have learning components but a third common element is that once the system is developed it is proven by being placed in the same real world problem solving situation as the human SME, typically as an aid to human workers or a supplement to some information system.
(c) The sequence of steps taken to reach a conclusion is dynamically synthesized with each new case. It is not explicitly programmed when the system is built. Expert systems can process multiple values for any problem parameter. This permits more than one line of reasoning to be pursued and the results of incomplete (not fully determined) reasoning to be presented. (d) Problem solving is accomplished by applying specific
knowledge rather than specific technique. This is a key idea in expert systems technology. It reflects the belief that human experts do not process their knowledge differently from others, but they do possess different knowledge. With this philosophy, when one finds that their expert system does not produce the desired results, work begins to expand the knowledge base, not to re-program the procedures
3.1 Methodology of Expert System
Stage 1: SFRA data is imported
Stage 2: A MATLAB code has been developed which loads data in workspace as input
for the expert system
Table 3.1 Probable fault with range of difference in magnitude at same frequency [4]
Difference in db Probable fault level
< 2db Very low
2 db – 3.5 db Low
3.5 db – 5 db High
5db< Very high
Table 3.2 Probable faults with range of frequency [6]
Frequency Band Probable fault
< 2kHz Core deformation, open circuits, shorted turns & Residual magnetism
2kHz to 20kHz Bulk winding movement relative to each other , clamping structure
20kHz to 400kHz
Deformation within the main and tap windings
400kHz to 2MHz
Movement of main and tap winding leads, axial shift
IV. CASESTUDIES
4.1 Analysis Using Expert System
[image:3.612.318.577.137.273.2]Expert system was successfully applied to two power transformer of different rating and located in different region of himachal pradesh. The detail of these transformers given below in table 4.1
Table 4.1 details of transformers
Transformer Transformer 1 Transformer 2
Type 132/33 kV 132/33 kV
Phase 3 3
Type of
connection
Y Y
Rating 16 MVA 16 MVA
Manufacturer ZWAR Apex electrical ltd
Year 1995 1994
Location Anu 132 kV substation
Kangra 132 kV substation
4.2 Case: 1 Analysis Using Expert System on Transformer 1 4.2.1 Test on HV Open LV
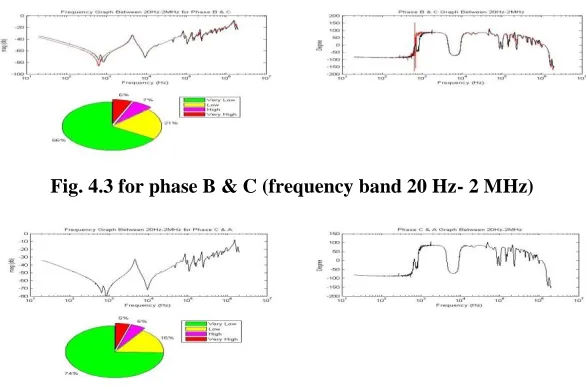
Analysis was performed by using expert system on transformer 1. It was test on HV open LV for phase to phase comparison method. Analysis was done in frequency band between 20 Hz to 2MHz and no fault was detected during normal user analysis fig. 4.1 shows the window of MATLAB and the message given by expert system that no fault was detected during analysis of phase A&B, B&C, C&A and their result given in fig. 4.2, 4.3, 4.4 respectively with frequency graph, phase graph and pie chart with overall percentage level of fault for each phase.
Fig. 4.1 Analysis for normal user (frequency band 20Hz- 2MHz)
[image:3.612.98.514.411.682.2]Fig. 4.3 for phase B & C (frequency band 20 Hz- 2 MHz)
Fig. 4.4 for phase C & A (frequency band 20 Hz- 2 MHz)
Now analysis was done in frequency band 20 Hz-2 kHz for advanced user no fault was detected in this frequency band. The message given by expert system that no fault was detected during
[image:4.612.170.446.327.571.2]analysis of phase A&B, B&C, C&A and their results are given in fig. 4.5, 4.6, 4.7 respectively with frequency graph, phase graph and pie chart with percentage level of fault for each phase.
Fig. 4.5 for phase A & B (frequency band 20 Hz-2 kHz)
Fig. 4.6 for phase B & C (frequency band 20Hz-2 kHz)
Fig. 4.7 for phase C & A (frequency band 20Hz-2 kHz)
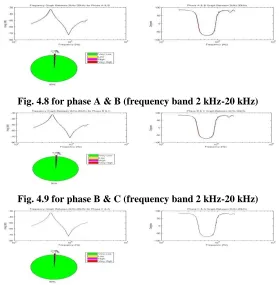
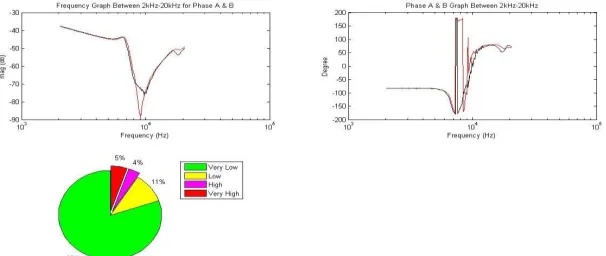
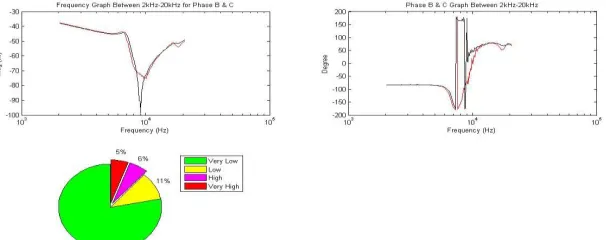
Now analysis was done in frequency band 2 kHz-20 kHz for advanced user no fault was detected in this frequency band. The message given by expert system that no fault was detected during
Fig. 4.8 for phase A & B (frequency band 2 kHz-20 kHz)
Fig. 4.9 for phase B & C (frequency band 2 kHz-20 kHz)
Fig. 4.10 for phase C & A (frequency band 2 kHz-20 kHz)
Now analysis was done in frequency band 20 kHz-400 kHz for advanced user no fault was detected in this frequency band. The message given by expert system that no fault was detected during analysis of phase A&B, B&C, C&A and their results are
[image:5.612.162.453.428.690.2]given in fig. 4.11, 4.12, 4.13 respectively with frequency graph, phase graph and pie chart with percentage level of fault for each phase.
Fig. 4.11 for phase A & B (frequency band 20 kHz- 400 kHz)
Fig. 4.12 for phase B & C (frequency band 20 kHz- 400 kHz)
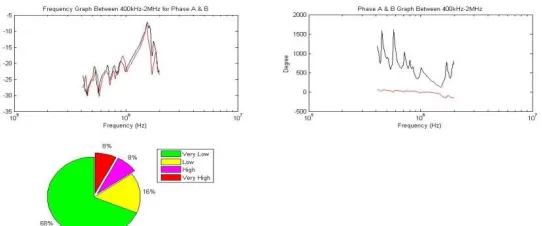
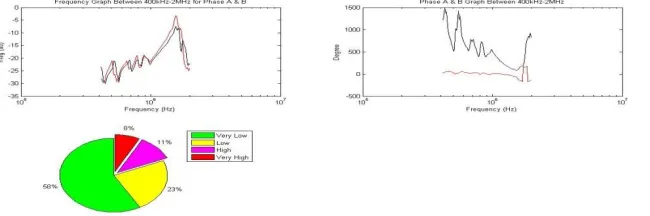
Now analysis was done in frequency band 400 kHz-2 MHz for advanced user no fault was detected in this frequency band. The message given by expert system that no fault was detected during analysis of phase A&B, B&C, C&A and their results are
[image:6.612.170.449.113.600.2]given in fig. 4.14, 4.15, 4.16 respectively with frequency graph, phase graph and pie chart with percentage level of fault for each phase.
[image:6.612.175.446.118.231.2]Fig. 4.14 for phase A & B (frequency band 400 kHz – 2 MHz)
Fig. 4.15 for phase B & C (frequency band 400 kHz – 2 MHz)
Fig. 4.16 for phase C & A (frequency band 400 kHz – 2 MHz)
4.2.2 Test on HV Short LV
Now analysis was done in frequency band 20 Hz-2 MHz for normal user no fault was detected in this frequency band. The message given by expert system that no fault was detected during
[image:6.612.173.445.123.339.2]Fig. 4.17 for phase A & B (frequency band 20 Hz-2 MHz)
Fig. 4.18 for phase B & C (frequency band 20 Hz-2 MHz)
Fig. 4.19 for phase C & A (frequency band 20 Hz-2 MHz)
Now analysis was done in frequency band 20 Hz-2 kHz for advanced user no fault was detected in this frequency band. The message given by expert system that no fault was detected during
[image:7.612.165.450.62.168.2]analysis of phase A&B, B&C, C&A and their results are given in fig. 4.20, 4.21, 4.22 respectively with frequency graph, phase graph and pie chart with percentage level of fault for each phase.
[image:7.612.159.463.565.698.2]Fig. 4.21 for phase B & C (frequency band 20 Hz- 2 kHz)
Fig. 4.22 for phase C & A (frequency band 20 Hz -2 kHz)
Now analysis was done in frequency band 2 kHz-20 kHz for advanced user no fault was detected in this frequency band. The message given by expert system that no fault was detected during
analysis of phase A&B, B&C, C&A and their results are given in fig. 4.23, 4.24, 4.25 respectively with frequency graph, phase graph and pie chart with percentage level of fault for each phase.
Fig. 4.24 for phase B & C (frequency band 2 kHz-20 kHz)
Fig. 4.25 for phase C & A (frequency band 2 kHz-20 kHz)
Now analysis was done in frequency band 20 kHz-400 kHz for advanced user no fault was detected in this frequency band. The message given by expert system that no fault was detected during analysis of phase A&B, B&C, C&A and their results are
[image:9.612.158.461.63.183.2]given in fig. 4.26, 4.27, 4.28 respectively with frequency graph, phase graph and pie chart with percentage level of fault for each phase.
[image:9.612.159.463.458.606.2]Fig. 4.27 for phase B & C (frequency band 20 kHz-400 kHz)
Fig. 4.28 for phase C & A (frequency band 20 kHz-400 kHz)
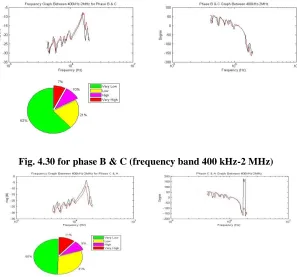
Now analysis was done in frequency band 400 kHz-2 MHz for advanced user no fault was detected in this frequency band. The message given by expert system that no fault was detected
during analysis of phase A&B, B&C, C&A and their results are given in fig. 4.29, 4.30, 4.31 respectively with frequency graph, phase graph and pie chart with percentage level of fault for each phase.
[image:10.612.152.477.454.562.2]Fig. 4.30 for phase B & C (frequency band 400 kHz-2 MHz)
Fig. 4.31 for phase C & A (frequency band 400 kHz-2 MHz)
4.3 Case 2: Analysis Using Expert System on Transformer 2 4.3.1 Test on HV Open LV
Analysis was performed by using expert system on transformer 2. It was test on HV open LV for phase to phase comparison method. Analysis was done in frequency band between 20 Hz to 2MHz and fault was detected during normal user analysis. The message given by expert system that fault was detected during analysis of phase A&B, B&C, C&A and their
[image:11.612.158.461.62.191.2]result given in fig. 4.32, 4.33, 4.34 respectively with frequency graph, phase graph and pie chart with overall percentage level of fault for each phase. The transformer is likely to have core deformation, bulk winding movement relative to each other, clamping structure problem, main & tap winding lead problem found in phase B&C. Also phase C&A is likely to have core deformation, bulk winding movement.
Fig. 4.32 for phase A & B (frequency band 20 Hz-2 MHz)
[image:11.612.149.469.479.707.2]Fig. 4.34 for phase C & A (frequency band 20 Hz-2 MHz)
4.3.2 Test on HV Short LV
Now analysis was done in frequency band 20 Hz-2 MHz for normal user no fault was detected in this frequency band. The message given by expert system that no fault was detected during
[image:12.612.140.469.255.695.2]analysis of phase A&B, B&C, C&A and their results are given in fig. 4.35, 4.36, 4.37 respectively with frequency graph, phase graph and pie chart with percentage level of fault for each phase.
Fig. 4.35 for phase A & B (frequency band 20 Hz-2 MHz)
V. CONCLUSION
In this thesis expert system has been developed for SFRA. This was applied to four power transformer. Analysis has been done with the help of expert system and transformer fault related results have been found . Expert system has additional features such as phase to phase comparison analysis, comparison with initial signature analysis.
Data analyses were done with the help of expert system and it was concluded that the structural health of core and winding is good in Transformer 1 while there is indication of deformation and displacement of winding and affected from movement of main & tap winding leads and axial shift in Transformer 2 . Degree of fault level has been given in form of pie chart in percentage. The expert system gives indication of transformer fault directly to user. Expert system for SFRA is a key tool in the engineer’s toolbox for diagnosing the health of the transformer.
REFERENCES
[1] Jitka Fuhr, “Benefits and Limits of Advanced Methods used for Transformer Diagnostics,” IEEE electrical insulation conference, pp.262-272, 2009.
[2] J. Secue and E. Mombello, “New Methodology for Diagnosing Faults in Power Transformer Windings through the Sweep Frequency Response Analysis (SFRA),” IEEE T&D Conference and Exposition, pp.1-10, 2008. [3] K. Feser, C. Neumann, M. Loppacher, T. Leibfried, and A. Kachler, “The
Transfer Function Method for Detection of Winding Displacements on Power Transformers after Transport Short Circuit or 30 Years of Service,” CIGRE, 2000.
[4] Shubhangi Patil and Venkatasami, “Realization of Transformer Winding Network from Sweep Frequency Response Data Condition Monitoring and Diagnosis,” IEEE International Conference, pp.505-508, 2008.
[5] Y.R. Sood, J. Singh, P. Verma, and R.K. Jarial, “Novel Method for Detection of Transformer Winding Faults Using Sweep Frequency Response Analysis,” IEEE, pp.1-9, 2007.
AUTHORS
First Author – Jitendra kumar, Department of Electrical
Engineering, BIT Sindri, Dhanbad, Jharkhand, India, 828123, Email: [email protected]
Second Author – Dr.U.prasad, Department of Electrical
![Table 3.1 Probable fault with range of difference in magnitude at same frequency [4]](https://thumb-us.123doks.com/thumbv2/123dok_us/9114633.985184/3.612.98.514.411.682/table-probable-fault-range-difference-magnitude-frequency.webp)