Sensor Analysis and Application of Arduino based
Temperature and Light Intensity Control for Smart
Home System
San Nyein Khine, Zaw Tun
University of Computer Studies(Sittway)
DOI: 10.29322/IJSRP.8.6.2018.p7813
http://dx.doi.org/10.29322/IJSRP.8.6.2018.p7813
Abstract- Temperature control system and light intensity control system for smart home are becoming more common in these days. The proposed system is to manage the temperature and the light intensity of a given area based on setting by a user of the system with analog temperature sensor (LM 35) and light dependent resistor (LDR). The system contains LM 35, LDR, Ardino Mega 2560 microcontroller and liquid crystal display (LCD). It can support ON/OFF control of the fan system and the lighting system for smart home and its environment.
Index Terms- LM 35, LDR, LCD, Microcontroller, automation
I. INTRODUCTION
oss of electricity due to the lack of awareness is a major problem in a third world country. So, human beings need the help of technology to reduce the waste of electricity.
Smart home control system consists of things attached with sensors in many applications with monitoring and to control the smart home system. In this paper, the attempt to reduce the waste of electricity due to the lack of awareness of human beings has been made to minimize the power consumption.
As temperature sensor, analog temperature sensor (LM 35) has been used to detect the environment temperature. Arduino Mega 2560 microcontroller reads the analog output signal from LM 35 and converts it into digital one[1]. And then these values are compared with the desired setting temperature. LCD shows the measured temperature continuously. The result of the comparison of the measured temperature and the desired setting temperature makes the operation of the temperature control system. Similarly, LDR has been used as light intensity sensor for the environment light intensity. The resistance of LDR decreases when the light intensity increases. The LDR output levels compare with the setting values, and give the control of lighting system.
II. RELATED WORKS
Saddam[5] proposed Digital Thermometer using Arduino UNO and LM35 temperature sensor. It can be divided into three sections. At first, LM 35 analog temperature sensor measures the environment temperature and converts it into digital value by using Arduino UNO. And then the information is displayed on
liquid crystal display (LCD). The system can be used in a house or any place to make the monitoring one for human beings. Mustafa Saad et al[7] presented Automatic Street Light Control System Using Microcontroller. In this paper, light dependent resistor (LDR) sensor is used to indicate day/night time and photoelectric sensor (IR sensor) is used to detect the movement on the street. PIC 16F877 microcontroller is used as brain to control the street light system, where the programming language used for developing the software to microcontroller is C-language. Finally, the system has been successfully designed and implemented as prototype system.
III. PROPOSED APPROACH
In this proposed work, there are two sensors: (i) temperature sensor and (ii) light intensity sensor. The data from the sensors are converted by Arduino Mega 2560 microcontroller. And then the output information is displayed by LCD to control its environment. The proposed system can minimize the power consumption due to the lack of awareness of human beings.
IV. HARDWARE DESCRIPTION
(i) Analog temperature sensor (LM 35) (ii) Light intensity sensor (or)
light dependent resistor (LDR) (iii) Relay module
(iv) Liquid crystal display (LCD) (v) Arduino Mega 2560 microcontroller
4.1. Analog Temperature Sensor (LM 35)
LM 35 is a precious IC temperature sensor, where the output voltage is linearly proportional to the Celsius (Centigrade) temperature. Thus, they have an advantage over linear temperature sensors calibrated in Kelvin scale, as the user is not required to subtract a large constant voltage from its output to obtain the convenient Centigrade scale. LM 35 does not require any external calibration or trimming to provide typical accuracies of ±4
1
o
C at room temperature and ±4
3
o
C over a full – 55 to + 150oC temperature range. Low cost is assured by trimming and calibration at the wafer level. LM 35’s low output impedance,
linear output, and precise inherent calibration make interfacing to readout or control circuitry especially easy. It can be used with single power supply, or dual power supply. As it draws only 60 µA from its supply, it has very low self heating, less than 0.1oC still in air. LM 35 is rated to operate over – 55 to + 150oC temperature range, while LM 35C series is rated for a – 40 to + 110oC range. LM 35 is shown in Figure (1)[2][4].
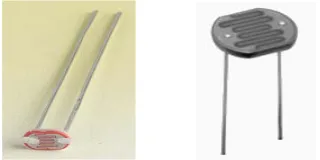
4.2. Light Dependent Resistor (LDR)
Figure (2) shows light dependent resistor (LDR). It is made from semiconductor material such as Cadmium Sulphide(CdS) that can change its electrical resistance. In dark condition, its resistannce is several thousand ohms. The resistance of LDR is only a few hundred ohms in the day light by creating electron-hole pairs in the material[6]. The next effect is an improvement in its conductivity with a decrease in resistance for an increase in illumination. LDR has the spectral response of about 600 nm in the yellow- orange region of the visible spectrum. When un-illuminated, the resistance of the cell is very
high about M Ω range which falls to Ω range when fully
illuminated. To increase the dark resistance and therefore reduce the dark current, the resistive path is formed a zigzag pattern across the ceramic substrate. The CdS photocell is a very low cost device often used in auto dimming, darkness or twilight detection for turning the street lights ON/OFF and for photographic exposure meter type applications[4][7].
4.3. Relay Module
Relay module is an electrically operated switch. The relay module, shown in Figure (3), has Vcc, GND and signal. To
operate a switch ON/OFF, many relays use an electromagnet. They can be used to control a circuit by a low-power signal or to control several circuits by one signal. It can act as a switch if the circuit and the load circuit have different supply voltages[3].
4.4 Liquid Crystal Display (LCD)
Figure (4) shows 16 x 2 LCD display. It is specially manufactured to be used with microcontrollers. It is used for displaying different messages on a miniature liquid crystal display. The model described here is for its low price and great capabilities, most frequently used in practice. It is based on the HD44780 microcontroller (Hitachi) and can display messages in two lines with 16 characters each, alphabet, Greek letters, punctuation marks and mathematical symbols etc[8][9].
4.1. Arduino Mega 2560 Microcontroller
Arduino Mega 2560 microcontroller is shown in Figure (5). There are 54 digital I/O pins, 16 analog inputs, 4 UARTs (hardware serial ports) and a 16 MHz build-in crystal oscillator in Arduino Mega 2560. It also contains a USB connector, a power jack, an ICSP header and a reset button[1].
There are many facilities for communication between Arduino Mega 2560 and computer, or other Arduinos and another microcontroller by the use of USB connector. The data can be transferred very easily from Arduino to computer or Arduino to other devices (sensors or appliances).
Figure (4) LCD display Figure (3) Electromagnetic relay
Figure (2) Light dependent resistor (LDR) Figure (1) Temperature sensor (LM 35)
[image:2.612.421.471.59.131.2] [image:2.612.130.194.156.267.2] [image:2.612.356.533.288.363.2] [image:2.612.328.538.488.634.2] [image:2.612.88.248.526.606.2]V. EXPERIMENTAL SETUP
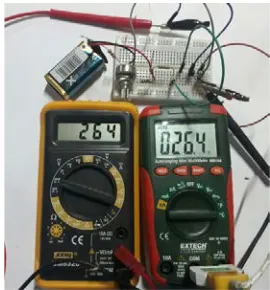
5.1 Temperature sensor analysis
LM 35 temperature sensor gives 1oC on every 10 mV change at its output pin. It can be easily checked with voltmeter by connecting of output voltage (pin 2) and Ground (pin 3) of LM 35 sensor. If the output voltage of LM 35 is 264 mV, the temperature changes will be 26.4oC by using thermometer. The photograph of LM 35 response is shown in Figure (6) and the temperature analysis of LM 35 is in Figure (7) according to Table (1).
Table (1) Temperature Analysis
5.2 Temperature control system
As shown in Figure (8), the setting temperature can be adjusted by the use of RV1 pot resistor and is compared with LM 35 output. The result controls the fan system of smart home.
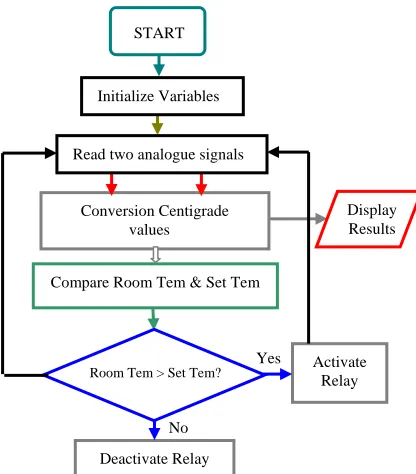
Figure (9) shows the fan control system of smart home. The setting temperature is 29.5oC and the room temperature is 33.18oC. In this condition, the fan is ON automatically. If the room temperature is less than the set temperature, the system will switch off. Program flow chart for temperature is shown in Figure (10).
Figure (6) LM 35 Response
Figure (7) Temperature analysis
Figure (8) Temperature control circuit 270
280 290 300 310 320 330 340 260 Temperature
(oC)
Voltage[Meas:] (mV)
27 269 28 282 29 291 30 299 31 312 32 323 33 330 34 343 26 255
[image:3.612.331.559.53.225.2] [image:3.612.99.234.187.332.2] [image:3.612.323.545.332.496.2] [image:3.612.55.235.392.601.2]5.3 Light intensity sensor analysis
LDR (CdS) can response the wavelength of about 560 nm to 600 nm in visible spectrum. The response of LDR closely matches with that of the human eye and it can even be controlled using a sample torch as a light source. By using Lux-meter and Ohm-meter, LDR response in this work is shown in Figure (11) and the resistance for different light intensities is in Figure (12). Table (2) shows the comparison of theoretical values and measured values of LDR output.
Table (2) Resistance for different light intensities
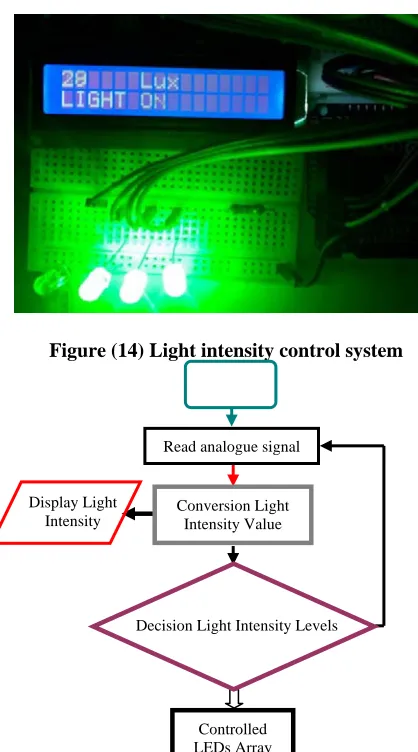
5.3 Light intensity control system
Figure (13) shows light intensity control circuit for smart home system. LDR is used as light intensity sensor. The resistance of LDR gives the output level of the LED array. If the light intensity is greater than 50 lux, all LEDs turn off. When the light intensity lies between 40 lux and 50 lux, 1st LED lits up. Figure (9) Temperature control system
Figure (10) Program flow chart for temperature
Illumination (Lux)
Resistance[Meas:] (Ω) 50 3220 40 3500 30 4330 20 6200 10 7570
Resistance[Theo] (Ω) 3200 4300 5300 6500 7500
Figure (12) Resistance for different light intensities
Figure (11) LDR Response
No
Yes Conversion Centigrade
values
Activate Relay Compare Room Tem & Set Tem
Deactivate Relay START
Room Tem > Set Tem?
Display Results Read two analogue signals
[image:4.612.358.533.55.237.2] [image:4.612.37.260.58.207.2] [image:4.612.58.266.260.497.2] [image:4.612.323.551.297.616.2]For 1st & 2nd LEDs ON, the light intensity is between 30 & 40 lux. As shown in Figure (14), three LEDs lit up at light intensity of 28 lux. For all LEDs lit, the light intensity is less than 20 lux. Figure (15) is the program flow chart for light intensity.
VI. RESULTS AND DISCUSSION
As shown in Table (1), the output voltage of LM 35 is linearly proportional to temperature. For instance, temperature 26.4oC gives the output voltage of 264 mV. It means that LM 35 produces 10 mV change per oC and temperature analysis graph is a straight line. So, LM 35 can be used in other temperature sensing devices because of its precious output value. The proposed temperature control circuit is appropriate with the smart home system by the use of LM 35 temperature sensor.
LDR used in this work as light intensity sensor is a photoconductive cell which gives the relationship between the incident light and the corresponding resistance of the cell. As shown in Table (2), the cell resistance is about 3.2 kΩ at light
intensity 50 lux, and 7.5 kΩ for 10 lux. On the other hand, the
cell resistance decreases when light impinges on LDR. In this work, three LEDs in LED array lit up when the light intensity is 28 lux or the cell resistance is about 4 kΩ. So, LDR can be used in night light control, street light control, position sensor, camera exposure control and automated rear view mirror.
VII. CONCLUSION
The temperature sensor analysis and the light intensity sensor analysis have been examined, and the control system for smart home has been constructed and tested successfully to minimize the power consumption due to the lack of awareness of human beings. The system is cost-effective and time efficient, and is very accurate in its operation. LCD can be used to monitor the set temperature, the measured temperature, light intensity and LED ON/OFF condition. The proposed system is easy to install and gives the user satisfaction.
REFERENCES
[1] www.arduino.cc
[2] www.electro-tech-online.com [3] www.mikroelektronika.com
[4] www.wuntronic.de/sensors/therm_appl
[5] www.circuitdigest.com/microcontroller- projects/digital-thermometer-using-arduino
[6] Jin-Shyan Lee, Yu-Wei Su, and Chung-Chou Shen “A comparative Study of Wireless Protocols: Bluetooth, UWB, ZigBee, and Wi-Fi” The 33rd
Annual Conference of the IEEE Industrial Electronics Society (ECON) Nov. 5-8, 2007,Taipet, Taiwan
[7] Mustafa, Abdalhalim Farij, Ahamed Salah And Abdalroof Abdaljalil “Automatic Street Light Control System Using Microcontroller” Department of Control Engineering Collage of Electronic Technology/ Baniwalid Baniwalid- Libya LIBYA, Mathematical Methods and Optimization Techniques in Engineering.
[8] Penfold R A 1992 “Interfacing PCs and Compatibles” (London: Babani) [9] Robillard M J 1983 “Microprocessor Based Robotics” (New York: Howard
W Sams)
[10] Vailhavi Sunil Yardi “Design of Smart Home Energy Management System”, IJIRCCE, March 2015
AUTHORS
First Author – San Nyein Khine (Lecturer,UCS,Sittway) [email protected]
Figure (13) Light intensity control circuit
Figure (14) Light intensity control system
Figure (15) Program flow chart for light intensity
Display Light
Intensity Conversion Light Intensity Value
Controlled LEDs Array Decision Light Intensity Levels
[image:5.612.61.268.137.310.2] [image:5.612.34.243.338.714.2]