0095-1137/11/$12.00 doi:10.1128/JCM.00471-11
Copyright © 2011, American Society for Microbiology. All Rights Reserved.
Multilaboratory Evaluation of Real-Time PCR Tests for Hepatitis B
Virus DNA Quantification
䌤
Angela M. Caliendo,
1†* Alexander Valsamakis,
2† James W. Bremer,
3Andrea Ferreira-Gonzalez,
4Suzanne Granger,
5Linda Sabatini,
6‡ Gregory J. Tsongalis,
7Yun F. (Wayne) Wang,
8Belinda Yen-Lieberman,
9Steve Young,
10and Nell S. Lurain
3Department of Pathology and Laboratory Medicine, Emory University School of Medicine and Emory Center for AIDS Research, Emory University, Atlanta, Georgia1; Department of Pathology, The Johns Hopkins Medical Institutions, Baltimore, Maryland2;
Department of Immunology/Microbiology, Rush University Medical College, Chicago, Illinois3; Department of Pathology, Virginia Commonwealth University, Richmond, Virginia4; New England Research Institutes, Inc., Watertown, Massachusetts5;
Molecular Pathology, ACL Laboratories, Rosemont, Illinois6; Department of Pathology, Dartmouth Medical School, Lebanon, New Hampshire7; Pathology and Laboratory Medicine, Emory University School of Medicine,
Grady Memorial Hospital, Atlanta, Georgia8; Department of Clinical Pathology, Cleveland Clinic Foundation, Cleveland, Ohio9; and Tricore Reference Laboratories, Albuquerque, New Mexico, and Department of
Pathology, University of New Mexico HSC, Albuquerque, New Mexico10
Received 7 March 2011/Returned for modification 17 April 2011/Accepted 10 June 2011
The performance characteristics of four different assays for hepatitis B virus (HBV) quantification were assessed: the Abbott RealTime HBV IUO, the Roche Cobas AmpliPrep/Cobas TaqMan HBV test, the
Roche Cobas TaqMan HBV test with HighPure system, and the Qiagen artus HBV TM ASR. Limit of
detection (LOD), linear range, reproducibility, and agreement were determined using a serially diluted plasma sample from a single chronically infected subject. Each assay was tested by at least three
laboratories. The LOD of the RealTime and two TaqMan assays was approximately 1.0 log10IU/ml; for
artusHBV (which used the lowest volume of extracted DNA), it was approximately 1.5 log10IU/ml. The
linear range spanned 1.0 to at least 7.0 log10IU/ml for all assays. Median values were consistently lowest
for artusHBV and highest for Cobas AmpliPrep/Cobas TaqMan HBV. Assays incorporating automated nucleic acid extraction were the most reproducible; however, the overall variability was minor since the
standard deviations for the means of all tested concentrations were <0.32 log10 IU/ml for all assays.
False-positive results were observed with all assays; the highest rates occurred with tests using manual nucleic acid extraction. The performance characteristics of these assays suggest that they are useful for management and therapeutic monitoring of chronic HBV infection.
Hepatitis B virus (HBV) has infected an estimated 400 million persons worldwide; cirrhosis and hepatocellular car-cinoma, the major sequelae of chronic hepatitis B, result in over a half million deaths annually (4). HBV viremia is a critical risk factor for progression of chronic HBV infection (1); accordingly, quantification of HBV DNA in blood has become a critical tool in the assessment and management of chronic infection. In addition to serologic tests for HBV and measurement of serum transaminases, HBV viral load test-ing is used to determine the phase of chronic HBV infection (8) and is particularly useful in distinguishing active from inactive disease in individuals with no detectable HBeAg. A number of antiviral drugs have been introduced recently for the treatment of chronic HBV infection, and viremia is an important component in the decision to initiate treatment and in monitoring therapeutic response (5, 7).
Viremia in chronic HBV infection varies from very low or undetectable to ⬎108 copies/ml. Effective quantitative assays
must therefore measure a wide range of viral DNA concentra-tions. Commercially available quantitative assays utilize a variety of different detection methods, including signal amplification (Versant HBV bDNA; Siemens Healthcare Diagnostics), con-ventional PCR (Amplicor HBV Monitor test; Roche Diagnos-tics), and real-time PCR (Cobas AmpliPrep/Cobas TaqMan HBV test [Roche Diagnostics] and RealTime HBV assay [Abbott Molecular]). Of these methods, only real-time PCR is able to cover the wide dynamic range required for quantification of the virus in all stages of infection.
Reported studies of real-time assays have mainly focused on the performance of individual tests compared to signal ampli-fication tests rather than the comparative performance of mul-tiple real-time PCR tests (2, 3, 6, 9). The present study assessed the limit of detection, linear range, reproducibility, and agree-ment among four commercially available real-time PCR HBV viral load tests: the Abbott RealTime HBV IUO, the Roche Cobas AmpliPrep/Cobas TaqMan HBV test, the Roche Cobas TaqMan HBV test with HighPure system, and the Qiagenartus
HBV TM ASR. The Abbott m2000sp and Roche AmpliPrep protocols were performed using automated extraction meth-ods, while the extractions for the Roche HighPure and Qiagen ASR were performed manually.
* Corresponding author. Mailing address: Emory University Hospi-tal, H180, 1364 Clifton Rd., Atlanta, GA 30322. Phone: (404) 712-5721. Fax: (404) 727-3133. E-mail: [email protected].
† A.M.C. and A.V. are co-first authors and contributed equally to the manuscript.
‡ Present address: Department of Pathology and Laboratory Med-icine, Roswell Park Cancer Institute, Buffalo, NY.
䌤Published ahead of print on 22 June 2011.
2854
on May 16, 2020 by guest
http://jcm.asm.org/
MATERIALS AND METHODS
Quantification panels.A 65-specimen panel was created to be used by par-ticipating laboratories to assess assay performance. The panel was created in a centralized laboratory (the Division of AIDS Viral Quality Assurance Labora-tory, Rush University Medical Center, Chicago, IL) by serially diluting a unit of plasma obtained from a patient donor infected with HBV. The diluent was human plasmapheresis plasma containing the anticoagulant sodium citrate (SeraCare, Milford, MA) and found to be negative for HBsAg by serologic testing; this also served as negative sample material. HBV-infected donor blood was obtained under an institutional review board-approved protocol. The plasma was assigned a nominal concentration of 8.58 log10IU/ml of genotype A virus as
determined by Versant HBV DNA 3.0 (Siemens, Hoffman Estates, IL). Four replicates each of three different dilutions (1:100, 1:1,000, and 1:10,000) were tested to determine IU/ml.
HBV genotype was determined by direct sequencing of the sequence of the polymerase gene (nucleotides 1 to 1615 and 2528 to 3221 of the circular genome) by BLAST analysis and alignment with sequences in GenBank. The panel con-sisted of 5 to 7 replicates of 10 concentrations ranging from 1.0 to 7.7 log10IU/ml
each in a volume of 750l (Table 1). Panel members were tested in a blinded manner by participating laboratories.
Viral load assays. Four HBV viral load assays were evaluated, including RealTime HBV IUO with m2000sp automated sample preparation (Abbott Molecular, Des Plaines, IL), TaqMan48 HBV ASR with AmpliPrep automated sample preparation (Roche Diagnostics, Indianapolis, IN), TaqMan HBV RUO with HighPure system manual sample preparation (Roche), andartusHBV TM ASR with QIAamp MinElute Virus Spin kit manual sample preparation (Qiagen, Germantown, MD). The plasma extraction volume was 500l for the AmpliPrep TaqMan, HighPure TaqMan, and RealTime assays and 200l for the QiagenartusHBV TM assay. An internal control (IC) for the RealTime and
artusHBV assays and a quantitation standard (QS) for the TaqMan assays were processed simultaneously with the samples during the extraction. The elution volumes from the extractions were 75l for the two TaqMan assays, 70l for the RealTime assay, and 60l for theartusHBV assay. The real-time PCR ampli-fication mixtures for the two TaqMan assays and the RealTime assay contained 50l of extracted sample plus 50l of amplification master mix supplied with the manufacturer’s reagents (total volume of 100l) for each assay, while theartus
HBV amplification used 20l of sample extract plus 30l of master mix for a total amplification volume of 50l. Amplification and quantification were
per-formed per package insert if available; otherwise, protocols were developed in collaboration with manufacturers’ research and development expertise.
Study design.The panels were used to determine the limit of detection, linear range, reproducibility, and agreement for each assay. The two Roche assays and the Qiagen assay were each performed by four different laboratories. Only three laboratories were able to perform the Abbott assay; therefore, one laboratory tested two complete panels so that the same number of replicates was tested for all assays.
Statistical analysis.HBV concentrations were log10transformed for analysis.
Results that were reported as “not extracted” in the AmpliPrep TaqMan assay or as invalid in any assay were excluded from the analysis. For each assay, results from all laboratories were combined when calculating means and medians. Stan-dard deviations accounted for variation between laboratories within a given assay platform. Medians were not generated for a given nominal concentration if fewer than 50% of the samples produced a quantitative estimate. Means and standard deviations were not generated for a given nominal concentration if a valid quantitative result was not obtained for all samples tested.
RESULTS
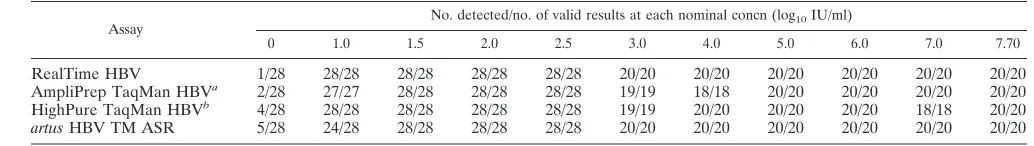
The detection rates of the different tests are summarized in Table 2. All tests were highly sensitive, with the RealTime, AmpliPrep TaqMan, and High Pure TaqMan assays qualita-tively detecting all 27 or 28 replicates of the 1.0-log10-IU/ml
sample. The artus HBV test detected 24/28 1.0-log10-IU/ml replicates and all 28 replicates of the 1.5-log10-IU/ml sample.
Although false-positive results occurred with all of the assays, they were seen more frequently in the assays that used manual extraction methods (4/28 for the HighPure TaqMan test and 5/28 for theartusHBV assay, compared to 1/28 for the Real-Time and 2/28 for the AmpliPrep TaqMan assays). False-positive results were not confined to any one laboratory; 50% of the false-positive results were from samples that were adja-cent to a sample with a very high viral load (⬎10 million IU/ml).
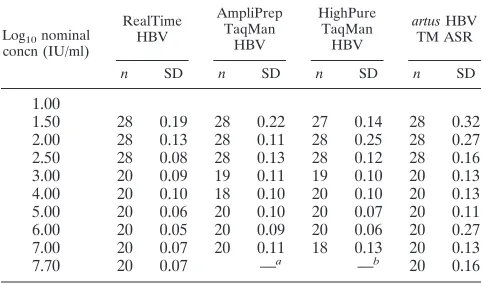
The median viral load values and intraquartile ranges for the four viral load assays are shown in Table 3. Overall, there was good agreement in viral load values between the assays. For samples with a nominal concentration ranging from 1.5 log10 IU/ml to 7.0 log10IU/ml, the differences in the median viral
load values across the four assays were between 0.29 log10 IU/ml and 0.56 log10IU/ml. The samples with nominal con-centrations of 1.0 log10IU/ml and 7.7 log10IU/ml were not analyzed because values were not available for all four assays. The standard deviations of the mean viral load values are shown in Table 4. In most instances, lower standard deviations were observed at concentrations greater than 2.0 log10IU/ml.
All assays were linear to 7.7 log10IU/ml with the exception of the AmpliPrep TaqMan assay, as all 7.7-log10-IU/ml values
[image:2.585.43.284.81.217.2]were above the upper linear range of the assay (8.04 log10
TABLE 1. HBV panel composition
No. of samples
Nominal concn
IU/ml Log10IU/ml
7 0 0
7 10 1.0
7 30 1.5
7 100 2.0
7 300 2.5
5 1,000 3.0
5 10,000 4.0
5 100,000 5.0
5 1,000,000 6.0
5 10,000,000 7.0
[image:2.585.27.544.636.709.2]5 50,000,000 7.7
TABLE 2. Detection rate of the HBV viral load assays
Assay
No. detected/no. of valid results at each nominal concn (log10IU/ml)
0 1.0 1.5 2.0 2.5 3.0 4.0 5.0 6.0 7.0 7.70
RealTime HBV 1/28 28/28 28/28 28/28 28/28 20/20 20/20 20/20 20/20 20/20 20/20
AmpliPrep TaqMan HBVa 2/28 27/27 28/28 28/28 28/28 19/19 18/18 20/20 20/20 20/20 20/20 HighPure TaqMan HBVb 4/28 28/28 28/28 28/28 28/28 19/19 20/20 20/20 20/20 18/18 20/20
artusHBV TM ASR 5/28 24/28 28/28 28/28 28/28 20/20 20/20 20/20 20/20 20/20 20/20
a
Four samples invalid or not extracted.
b
Three samples invalid or not extracted.
on May 16, 2020 by guest
http://jcm.asm.org/
IU/ml) and were reported as such by the TaqMan instrument (Fig. 1).
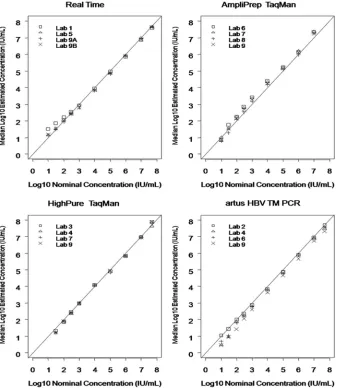
The assay bias, expressed as log10IU/ml viral load values
minus the nominal concentration, is shown in Fig. 2. The RealTime assay showed very consistent bias for samples greater than or equal to 3.0 log10IU/ml. The AmpliPrep Taq-Man assay consistently gave the highest viral load values, and there was variable bias throughout the linear range of the assay. A similar pattern of bias was seen with the HighPure TaqMan assay, although the values were lower than those seen
with the AmpliPrep TaqMan assay. The artus HBV assay
showed consistent bias for samples above 2.0 log10IU/ml and overall showed the lowest viral load values.
DISCUSSION
This comparison of four real-time PCR assays demonstrated that they have very similar performance characteristics, al-though some differences were noted. For example, the two TaqMan and the RealTime assays had a lower limit of detec-tion of 1.0 log10IU/ml, compared to 1.5 log10IU/ml for the
artusHBV assay. This minor difference is likely due to plasma input volume differences betweenartusHBV (200l) and the other assays (500l). In addition, a lower percentage of the extracted DNA was added to the master mix with theartus
HBV assay compared to the other three assays (33% versus
⬃70%). Despite this analytical difference, all assays had de-tection limits within the necessary range for clinical decision making.
Another difference that was observed pertained to false-positive rates. Assays that relied on manual extraction (High-Pure TaqMan andartusHBV) had higher false-positive rates than did those that employed automated extraction (RealTime and AmpliPrep TaqMan assays). The occurrence of false-pos-itive results with automated extraction platforms is an impor-tant observation that may reflect the performance expected in the clinical laboratory, where samples with viral load values in excess of 8.0 log10 IU/ml may be tested alongside samples containing no virus. These data suggest that regardless of the extraction method employed, careful attention to good labo-ratory practices will be needed to avoid false-positive results due to the extraordinarily high viral loads that occur in chronic HBV infections.
All four assays demonstrated a broad linear range of approx-imately 7 log10IU/ml; we were unable to obtain a large-volume
sample with a higher viral load to better define the upper limits of linearity of the assays. Quantification of the 7.7-log10-IU/ml sample resulted in concentrations that exceeded the upper limit of the AmpliPrep TaqMan assay but not those of the other three assays. According to the AmpliPrep TaqMan pack-age insert, it would have been acceptable to dilute these high-concentration samples up to 1:100 in order to report out a value up to 10.23 log10IU/ml; however, specimen dilution was not part of the study protocol and, therefore, it was not per-formed. This approach is appropriate for all of the assays as long as the dilution process is validated by the laboratory.
The reproducibility of the assays was similar to that seen with other real-time PCR tests. For viral load values in the middle of the linear range where the standard deviations are 0.05 to 0.10 log10IU/ml, a change in viral load that is greater than 3-fold would be interpreted to be a significant difference. For viral load values less than 2.0 log10 IU/ml, where the
standard deviation is higher, 5-fold changes would be signifi-cant. Overall, theartusHBV assay was the least precise of the four assays evaluated; this may in part reflect the manual extraction method.
[image:3.585.40.546.82.216.2]The differences in the median viral load values obtained with
TABLE 3. Median viral load values and intraquartile ranges
Log10nominal
concn (IU/ml)
Median (Q1, Q3)
RealTime HBV AmpliPrep
TaqMan HBV HighPure TaqMan HBV artusHBV TM ASR
1.0 1.18 (1.10, 1.34) 0.85 (0.78, 1.00) —a 0.65 (0.39, 0.90)
1.5 1.57 (1.52, 1.73) 1.54 (1.40, 1.74) 1.26 (1.11, 1.33) 1.11 (0.90, 1.34)
2.0 2.02 (1.96, 2.13) 2.20 (2.11, 2.24) 1.89 (1.82, 1.95) 1.83 (1.55, 1.98)
2.5 2.44 (2.40, 2.49) 2.73 (2.67, 2.78) 2.42 (2.38, 2.45) 2.25 (2.11, 2.35)
3.0 2.89 (2.80, 2.93) 3.34 (3.23, 3.40) 3.00 (2.96, 3.03) 2.78 (2.69, 2.82)
4.0 3.85 (3.84, 3.90) 4.30 (4.24, 4.38) 4.08 (4.03, 4.11) 3.79 (3.64, 3.85)
5.0 4.87 (4.83, 4.92) 5.18 (5.12, 5.22) 4.92 (4.85, 4.95) 4.78 (4.69, 4.88)
6.0 5.91 (5.86, 5.94) 6.14 (6.10, 6.17) 5.85 (5.84, 5.87) 5.86 (5.71, 5.92)
7.0 6.93 (6.89, 6.96) 7.32 (7.26, 7.37) 6.98 (6.94, 7.02) 6.90 (6.77, 6.96)
7.7 7.66 (7.61, 7.69) —b 7.86 (7.80, 7.91) 7.52 (7.35, 7.59)
aNineteen of 28 samples reported as “detected,⬍6 IU/ml.” bAll 20 samples reported as⬎8.04 log
10IU/ml (110,000,000 copies/ml).
TABLE 4. Standard deviations of the mean viral load values
Log10nominal
concn (IU/ml)
RealTime HBV
AmpliPrep TaqMan
HBV
HighPure TaqMan
HBV
artusHBV TM ASR
n SD n SD n SD n SD
1.00
1.50 28 0.19 28 0.22 27 0.14 28 0.32 2.00 28 0.13 28 0.11 28 0.25 28 0.27 2.50 28 0.08 28 0.13 28 0.12 28 0.16 3.00 20 0.09 19 0.11 19 0.10 20 0.13 4.00 20 0.10 18 0.10 20 0.10 20 0.13 5.00 20 0.06 20 0.10 20 0.07 20 0.11 6.00 20 0.05 20 0.09 20 0.06 20 0.27 7.00 20 0.07 20 0.11 18 0.13 20 0.13
7.70 20 0.07 —a —b 20 0.16
a
All 20 samples reported as⬎8.04 log10IU/ml.
b
Three samples reported as⬎8.04 log10IU/ml.
on May 16, 2020 by guest
http://jcm.asm.org/
[image:3.585.42.283.567.710.2]the four assays ranged from 0.29 log10 IU/ml to 0.56 log10 IU/ml. The smallest difference was seen for the 6.0-log10-IU/ml sample, and the largest difference was seen for the 3.0-log10 -IU/ml sample. The most consistent bias (difference between
nominal concentration and observed concentration) was seen with theartus HBV assay for values of⬎2.0 log10IU/ml and with the RealTime assay for values ofⱖ3.0 log10IU/ml. Both TaqMan assays showed an inconsistent bias throughout the linear range of the assays. One limitation of this study is that only a genotype A sample was studied, so it is not possible to determine if any of these assays has a genotype bias.
The availability and regulatory status of the investigated assays have changed since the conclusion of experimentation. TheartusHBV assay is available outside the United States as a Conformite´ Europe´enne (CE)-marked product. The Real-Time and TaqMan reagents have been approved for use by the U.S. Food and Drug Administration (U.S. FDA) and are CE marked. Plasma volumes identical to those used in this study are used in the U.S. FDA-approved assays. The RealTime assay is additionally approved for use with 200l of plasma. Comparative performance of the assay with this reduced vol-ume was not investigated in this study.
Though there is reasonable agreement in viral load values across the four assays, the intra-assay and between-assay vari-ability are such that patients should be monitored with a single assay. False positives were observed on all platforms, and
care-FIG. 1. Linear range of the viral load assays.
FIG. 2. Assay bias of the four real-time PCR assays for HBV quan-tification. Bias is defined as measured viral load (log10IU/ml) minus the nominal concentration of the sample (log10IU/ml).
on May 16, 2020 by guest
http://jcm.asm.org/
[image:4.585.124.461.70.460.2]ful attention should be paid to avoid cross-contamination by samples that may contain extremely high concentrations of this virus.
In summary, all four assays are similarly sensitive and have a broad linear range, providing clinical utility for both diag-nostic testing and therapeutic monitoring.
ACKNOWLEDGMENTS
Assay reagents for this study were generously supplied by the man-ufacturers. We thank Michael S. Forman, Jess Ingersoll, Salvatore Scianna, Heather B. Steinmetz, Debra Kohn, Stephanie Merritt, Na-jma Akbany, and Ray Mills for their expert technical assistance.
This work was supported in part by National Institutes of Health contract NO1-AI35172 to J.W.B., an Emory University Center for AIDS Research grant (P30 AI050409, A.M.C.), and the HIV Preven-tion Trials Network (HPTN) sponsored by the NIAID, NaPreven-tional In-stitutes of Child Health and Human Development (NICH/HD), Na-tional Institute on Drug Abuse, NaNa-tional Institute of Mental Health, and Office of AIDS Research, of the NIH, DHHS (U01-AI-46745 and U01-AI-068613 to A.V.).
Disclosures of potential conflicts of interest include the following: A.M.C., scientific advisory boards of Roche Diagnostics and Abbott Molecular and research support from Roche Diagnostics and Qiagen; S.Y., scientific advisory board of Roche Diagnostics; A.V., scientific advisory boards of Roche Diagnostics, Abbott Molecular, and Qiagen
and research support from Roche Diagnostics and Qiagen; L.S., speak-ing honorarium from Abbott Molecular.
REFERENCES
1.Chen, C. J., H. I. Yang, and U. H. Iloeje.2009. Hepatitis B virus DNA levels and outcomes in chronic hepatitis B. Hepatology49:S72–S84.
2.Chevaliez, S., M. Bouvier-Alias, S. Laperche, and J. M. Pawlotsky.2008. Performance of the Cobas AmpliPrep/Cobas TaqMan real-time PCR assay for hepatitis B virus DNA quantification. J. Clin. Microbiol.46:1716–1723. 3.Ciotti, M., F. Marcuccilli, T. Guenci, M. G. Prignano, and C. F. Perno.2008.
Evaluation of the Abbott RealTime HBV DNA assay and comparison to the Cobas AmpliPrep/Cobas TaqMan 48 assay in monitoring patients with chronic cases of hepatitis B. J. Clin. Microbiol.46:1517–1519.
4.Dienstag, J. L.2008. Hepatitis B virus infection. N. Engl. J. Med.359:1486– 1500.
5.European Association for the Study of the Liver.2009. EASL clinical practice guidelines: management of chronic hepatitis B. J. Hepatol50:227–242. 6.Hochberger, S., et al.2006. Fully automated quantitation of hepatitis B virus
(HBV) DNA in human plasma by the COBAS AmpliPrep/COBAS TaqMan system. J. Clin. Virol.35:373–380.
7.Lok, A. S., and B. J. McMahon.2007. Chronic hepatitis B. Hepatology45: 507–539.
8.McMahon, B. J.2009. The natural history of chronic hepatitis B virus infec-tion. Hepatology49:S45–55.
9.Ronsin, C., A. Pillet, C. Bali, and G. A. Denoyel.2006. Evaluation of the COBAS AmpliPrep-total nucleic acid isolation-COBAS TaqMan hepatitis B virus (HBV) quantitative test and comparison to the VERSANT HBV DNA 3.0 assay. J. Clin. Microbiol.44:1390–1399.