Genotyping Methods and Phage Type
Alessandra De Cesare,aKeshav Krishnamani,bAntonio Parisi,cAntonia Ricci,dIda Luzzi,eLisa Barco,dAlex Lucchi,a Angela Miccolupo,cGerardo Manfredaa
Department of Agricultural and Food Sciences, Ozzano dell’Emilia, Italya
; DuPont Nutrition & Health, Geneva, Switzerlandb
; Istituto Zooprofilattico Sperimentale della Puglia e della Basilicata, Putignano, Bari, Italyc
; OIE/National Reference Laboratory for Salmonella-Istituto Zooprofilattico Sperimentale delle Venezie, Legnaro, Italyd ; Istituto Superiore di Sanità, Rome, Italye
A quantitative comparison between discriminatory indexes and concordance among multilocus variable-number tandem-repeat
analysis (MLVA), pulsed-field gel electrophoresis (PFGE), automated ribotyping, and phage typing has been performed, testing
238
Salmonella enterica
serotype Enteritidis isolates not epidemiologically correlated. The results show that MLVA is the best
choice, but each typing method provides a piece of information for establishing clonal relationships between the isolates.
S
almonella enterica
serotype Enteritidis is the most frequently
reported
Salmonella
serovar in humans in the European Union
(
1
). This study evaluated the discriminatory power and
congru-ence among typing results collected by applying multilocus
vari-able-number tandem-repeat analysis (MLVA), pulsed-field gel
electrophoresis (PFGE), and automated ribotyping, with a new
combination of restriction enzymes, to a collection of 238
S.
En-teritidis isolates not correlated from an epidemiological point of
view. They were isolated in 19 regions in Italy from humans,
ani-mals, foods, and environments between 2008 and 2012 (
Table 1
).
For all isolates, except those isolated from humans, the phage type
(PT) was kindly provided by the Italian Reference Laboratory for
Salmonella
and included in the analysis of typing results (
Table 1
).
MLVA was performed according to the protocol published by
Hopkins et al. (
2
) based on the loci SE3, SENTR4, SENTR5,
SENTR6, and SENTR7. The five loci were amplified in one
mul-tiplex PCR (25-
l volume) containing 5 pmol of each primer,
using a multiplex PCR kit (Qiagen). The amplification products
were diluted 1:50 in sterile distilled water, and 1
l of each dilution
was mixed with 10
l of Hi-Di formamide (Applied Biosystems)
and 0.4
l GeneScan LIZ 600 size standard (Applied Biosystems)
before being subjected to capillary electrophoresis using POP-7
polymer on a 3130 genetic analyzer (Applied Biosystems). An
MLVA type, labeled as a number, was assigned to each isolate
based on the difference in the variable-number tandem repeat
(VNTR) profile in at least one locus. Minimum spanning trees
(MST) based on the MLVA profiles were built in BioNumerics 7.5
(Applied Maths) using the categorical coefficient. Distances
be-tween MLVA profiles were calculated based on the numbers of
different loci between profiles, irrespective of their within-locus
differences in the number of repeats.
PFGE was performed according to the PulseNet protocol (
3
),
digesting the plug with 50 U of XbaI (Fermentas). The
Salmonella
Braenderup strain H9812 PulseNet standard was used as a
molec-ular weight marker. The fingerprinting profiles were analyzed
us-ing BioNumerics 7.1 and compared by cluster analysis usus-ing the
Dice coefficient and the unweighted pair group method with
arithmetic means (UPGMA), with a position tolerance limit and
optimization of 1%. Isolates showing a PFGE similarity level
of
ⱖ
95% were assigned to the same pulsotype. The pulsotypes
were labeled as numbers.
Automated ribotyping was performed with the RiboPrinter
ac-cording to the manufacturer’s instructions (
4
), using a mixture of
1,250 U of PvuII (Qualicon) and 1.250 U of PstI (New England
BioLabs). The restriction digestion was performed at 37°C for 20
min. The characterization consisted of combining profiles within
a similarity range (as calculated using the RiboPrinter’s
proprie-tary algorithm)
⬎
0.93 to form a dynamic ribogroup (RIBO)
la-beled with an alphanumeric code (
4
).
The Comparing Partitions website (
http://darwin.phyloviz.net
/ComparingPartitions/index.php?link
⫽
Toll
) was used to
calcu-late the discriminatory index (DI) of each typing method through
Simpson’s diversity index (
5
,
6
), the unidirectional concordance
between methods by applying the Wallace (W) and adjusted
Wallace (AW) coefficients (
7
), and the bidirectional
concor-dance using the adjusted Rand (AR) coefficient (
8
).
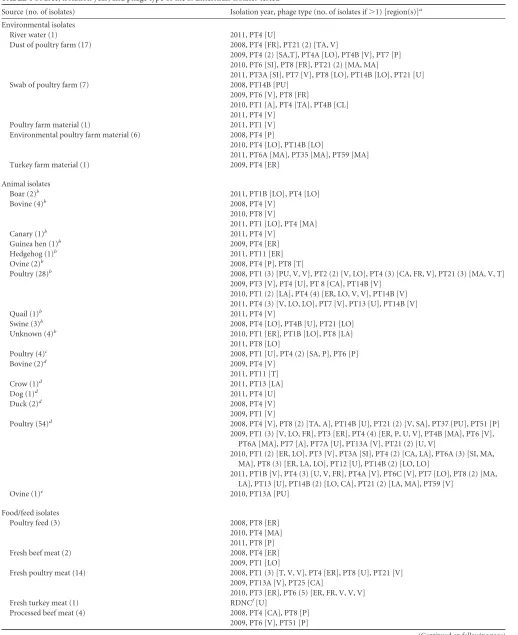
Overall, 21 MLVA types were each associated to a single isolate,
whereas 23 comprised between 2 and 67 isolates. The two largest
MLVA types grouped isolates collected from all sampling years
(
Fig. 1
). However, small clusters of isolates collected only in
spe-cific years were also identified (
Fig. 1
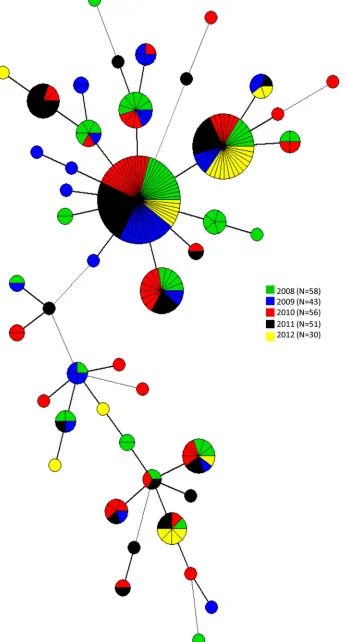
). One of the two main MLVA
types clustered together human, poultry, and egg isolates.
Fur-thermore, the same cluster included isolates from other sources,
confirming that
S.
Enteritidis can be transmitted between
hu-mans, wildlife, livestock, and pets (
Fig. 2
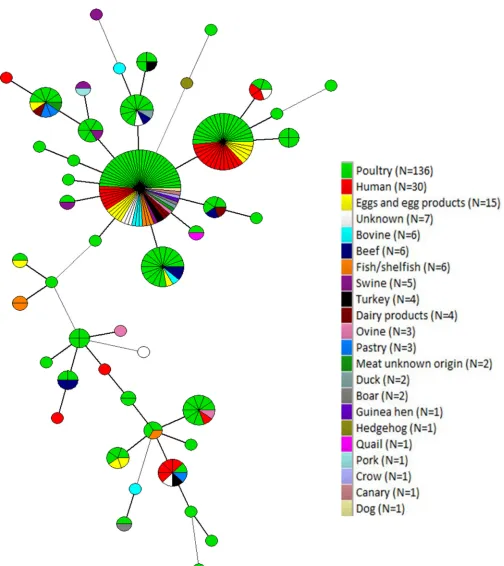
). In relation to the PT, an
MST was built, including the MLVA types of human isolates and
the reaction does not conform (RDNC) isolate (in red). Human
isolates clustered in the two main groups with isolates belonging
Received29 April 2015Returned for modification12 June 2015
Accepted21 June 2015
Accepted manuscript posted online1 July 2015
CitationDe Cesare A, Krishnamani K, Parisi A, Ricci A, Luzzi I, Barco L, Lucchi A, Miccolupo A, Manfreda G. 2015. Comparison betweenSalmonella enterica
serotype Enteritidis genotyping methods and phage type. J Clin Microbiol 53:3021–3031.doi:10.1128/JCM.01122-15.
Editor:K. C. Carroll
Address correspondence to Alessandra De Cesare, [email protected].
Copyright © 2015, American Society for Microbiology. All Rights Reserved.
doi:10.1128/JCM.01122-15
on May 16, 2020 by guest
http://jcm.asm.org/
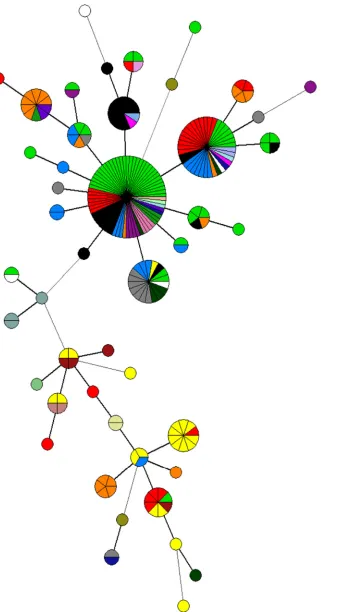
TABLE 1Source, isolation year, and phage type of theS.Enteritidis isolates tested
Source (no. of isolates) Isolation year, phage type (no. of isolates if⬎1) [region(s)]a
Environmental isolates
River water (1) 2011, PT4 [U]
Dust of poultry farm (17) 2008, PT4 [FR], PT21 (2) [TA, V]
2009, PT4 (2) [SA,T], PT4A [LO], PT4B [V], PT7 [P] 2010, PT6 [SI], PT8 [FR], PT21 (2) [MA, MA]
2011, PT3A [SI], PT7 [V], PT8 [LO], PT14B [LO], PT21 [U] Swab of poultry farm (7) 2008, PT14B [PU]
2009, PT6 [V], PT8 [FR]
2010, PT1 [A], PT4 [TA], PT4B [CL] 2011, PT4 [V]
Poultry farm material (1) 2011, PT1 [V] Environmental poultry farm material (6) 2008, PT4 [P]
2010, PT4 [LO], PT14B [LO]
2011, PT6A [MA], PT35 [MA], PT59 [MA] Turkey farm material (1) 2009, PT4 [ER]
Animal isolates
Boar (2)b 2011, PT1B [LO], PT4 [LO]
Bovine (4)b 2008, PT4 [V]
2010, PT8 [V]
2011, PT1 [LO], PT4 [MA] Canary (1)b 2011, PT4 [V]
Guinea hen (1)b 2009, PT4 [ER]
Hedgehog (1)b 2011, PT11 [ER]
Ovine (2)b 2008, PT4 [P], PT8 [T]
Poultry (28)b 2008, PT1 (3) [PU, V, V], PT2 (2) [V, LO], PT4 (3) [CA, FR, V], PT21 (3) [MA, V, T]
2009, PT3 [V], PT4 [U], PT 8 [CA], PT14B [V] 2010, PT1 (2) [LA], PT4 (4) [ER, LO, V, V], PT14B [V] 2011, PT4 (3) [V, LO, LO], PT7 [V], PT13 [U], PT14B [V]
Quail (1)b 2011, PT4 [V]
Swine (3)b 2008, PT4 [LO], PT4B [U], PT21 [LO]
Unknown (4)b 2010, PT1 [ER], PT1B [LO], PT8 [LA]
2011, PT8 [LO]
Poultry (4)c 2008, PT1 [U], PT4 (2) [SA, P], PT6 [P]
Bovine (2)d 2009, PT4 [V]
2011, PT11 [T]
Crow (1)d 2011, PT13 [LA]
Dog (1)d 2011, PT4 [U]
Duck (2)d 2008, PT4 [V]
2009, PT1 [V]
Poultry (54)d 2008, PT4 [V], PT8 (2) [TA, A], PT14B [U], PT21 (2) [V, SA], PT37 [PU], PT51 [P]
2009, PT1 (3) [V, LO, FR], PT3 [ER], PT4 (4) [ER, P, U, V], PT4B [MA], PT6 [V], PT6A [MA], PT7 [A], PT7A [U], PT13A [V], PT21 (2) [U, V]
2010, PT1 (2) [ER, LO], PT3 [V], PT3A [SI], PT4 (2) [CA, LA], PT6A (3) [SI, MA, MA], PT8 (3) [ER, LA, LO], PT12 [U], PT14B (2) [LO, LO]
2011, PT1B [V], PT4 (3) [U, V, FR], PT4A [V], PT6C [V], PT7 [LO], PT8 (2) [MA, LA], PT13 [U], PT14B (2) [LO, CA], PT21 (2) [LA, MA], PT59 [V]
Ovine (1)e 2010, PT13A [PU]
Food/feed isolates
Poultry feed (3) 2008, PT8 [ER] 2010, PT4 [MA] 2011, PT8 [P] Fresh beef meat (2) 2008, PT4 [ER]
2009, PT1 [LO]
Fresh poultry meat (14) 2008, PT1 (3) [T, V, V], PT4 [ER], PT8 [U], PT21 [V] 2009, PT13A [V], PT25 [CA]
2010, PT3 [ER], PT6 (5) [ER, FR, V, V, V] Fresh turkey meat (1) RDNCf[U]
Processed beef meat (4) 2008, PT4 [CA], PT8 [P] 2009, PT6 [V], PT51 [P]
(Continued on following page)
De Cesare et al.
on May 16, 2020 by guest
http://jcm.asm.org/
to the PT identified in
S.
Enteritidis isolates collected in Italy from
confirmed cases of human salmonellosis (
Fig. 3
).
The
S.
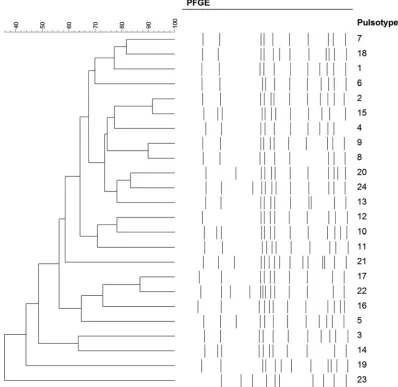
Enteritidis isolates were characterized by 23 pulsotypes,
with bands between 20 and 900 kbp, showing a similarity level
ranging between 36 and 92% (
Fig. 4
), and seven ribotyping
pro-files, characterized by 7 to 10 bands, with molecular weight
rang-ing between 2 and 15 kbp (
Fig. 5
). The ribotyping profiles
153-494-S-1 and 153-507-S-2 were identified in 57.1 and 36.5% of the
isolates, respectively. PFGE is the current gold standard to assess
relatedness among
Salmonella
isolates from different sources (
9
,
10
) and for outbreak investigations (
11
,
12
). However, according
to the literature, PFGE exhibits limited discriminatory power for
S.
Enteritidis (
13
). This aspect was confirmed in a multicountry
outbreak of
S.
Enteritidis recently reported in Europe (
14
,
15
).
Therefore, the European Centre for Disease Prevention and
Con-trol (ECDC) decided to promote the use of MLVA to subtype
S.
Enteritidis isolates (
14
). Since the European Food Safety
Author-ity (EFSA) stated that there is currently no comprehensive
collec-tion of comparable background on MLVA typing data for
S.
En-teritidis available at the European Union level, this paper should
help to start filling this gap (
14
).
For each typing method applied alone, the DI ranged between
0.54 for automated ribotyping and 0.88 for MLVA (
Table 2
),
whereas combining two or three methods resulted in a DI ranging
between 0.88 and 0.97 (
Table 2
). Since
S.
Enteritidis is one of the
most genetically homogeneous serotypes of
Salmonella
(
16
) it is
not surprising that in this study no typing method applied alone
reached a DI of
⬎
0.90. The combination MLVA-PT has been
identified as the best option by Cho et al. (
17
) and Dewaele et al.
(
18
), even though they applied a different MLVA scheme.
All methods tested, including PT, showed a weak directional
concordance (i.e.,
⬍
0.5) (
Table 3
). However, MLVA showed an
AW of
⬎
0.16 with PFGE and PT. Moreover, PT exhibited an AW
of
⬎
0.18 with MLVA and PFGE. The bidirectional concordance
between methods was also very low and was
ⱖ0.19 for MLVA-PT
and PFGE-PT only (
Table 4
). The same combinations of typing
methods reached the highest AW values. The low congruence
be-tween the applied typing methods demonstrated that they all
pro-vide a piece of information for establishing possible clonal
rela-tionships among the isolates tested. Such relarela-tionships concerned
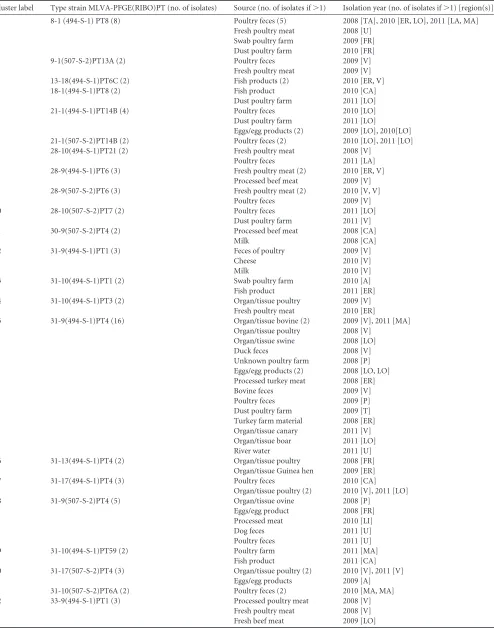
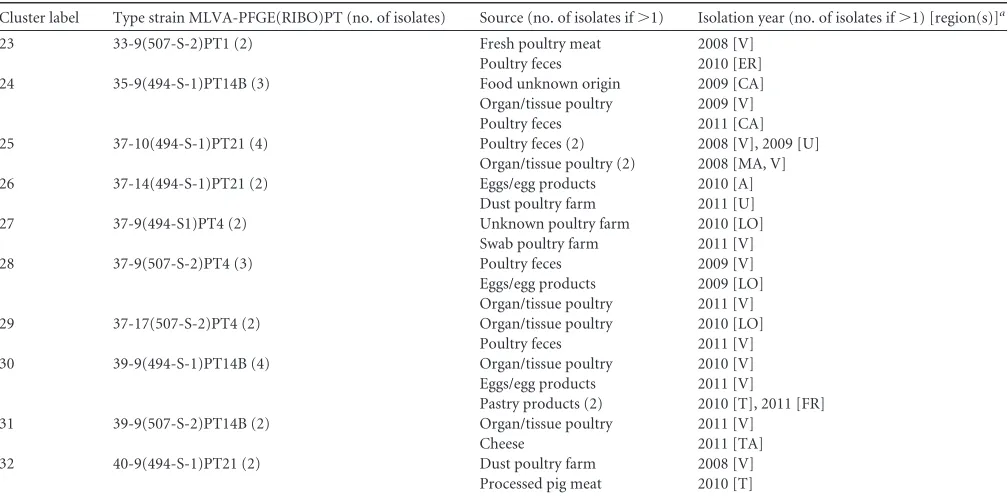
42.4% of the isolates forming 32 clusters containing 2 to 16
iso-lates sharing the same type strain, as defined according to the
MLVA, PFGE, RIBO, and PT profiles (
Table 5
). Overall, 65.6% of
these clusters grouped isolates of common origin (e.g., poultry),
whereas 34.4% isolates were classically not correlated (e.g.,
poul-try and cheese) (
Table 5
).
In conclusion, the results of this study allow a quantitative
comparison between different typing methods for
S.
Enteritidis in
terms of discriminatory power and concordance. These results,
TABLE 1(Continued)Source (no. of isolates) Isolation year, phage type (no. of isolates if⬎1) [region(s)]a
Processed poultry meat (2) 2008, PT1 [V] 2010, PT6 [V] Processed swine meat (2) 2009, PT6A [P]
2010, PT21 [T]
Processed turkey meat (2) 2008, PT4 [ER], PT13A [V] Processed meat of unknown origin (2) 2010, PT4 [LI]
2011, PT14B [V]
Cheese (2) 2010, PT1 [V]
2011, PT14B [TA]
Milk (2) 2008, PT4 [CA]
2010, PT1 [V]
Eggs and egg products (15) 2008, PT1 [CA], PT4 (4) [FR, U, LO, LO], PT14B [PU], PT21 [LO] 2009, PT4 (2) [A, LO], PT14B [LO], PT59 [B]
2010, PT7 [A], PT14B [LO], PT21 [A] 2011, PT14B [V]
Fish products/shellfish (6) 2008, PT1 [V]
2010, PT6C (2) [ER, V], PT8 [CA] 2011, PT1 [ER], PT59 [CA] Fresh pastry (1), cream biscuit (1), Tiramisu (1) 2010, PT14B [T]
2011, PT14B [FR] 2011, PT8 [V]
Ham (1) 2009, PT4 [LA]
Unknown food product (2) 2008, PT21 [PU] 2009, PT14B [CA]
Human isolates
Feces (30) 2012, Phage type not available [CA (2), LA (14), MA (2), MO (3), TA (9)]
a
Region: A, Abruzzo; B, Basilicata; CA, Campania; CL, Calabria; ER, Emilia-Romagna; FR, Friuli Venezia Giulia; LA, Lazio; LI, Liguria; LO, Lombardia; MA, Marche; MO, Molise; P, Piemonte; PU, Puglia; SA, Sardina; SI, Sicily; T, Tuscany; TA, Trentino Alto Adige; U, Umbria; V, Veneto.
b Organ/tissue. cUnknown d Feces. eCarcass. f
RDNC, reaction does not conform.
on May 16, 2020 by guest
http://jcm.asm.org/
FIG 1Minimum spanning tree calculated for MLVA profiles of 238S.Enteritidis isolates collected between 2008 and 2012 in 19 regions in Italy.
on May 16, 2020 by guest
http://jcm.asm.org/
[image:4.585.124.470.43.685.2]FIG 2Minimum spanning tree calculated for MLVA profiles of 238S.Enteritidis isolates collected from environmental (n⫽33), animal (n⫽112), food/feed (n⫽63), and human (n⫽30) sources.
on May 16, 2020 by guest
http://jcm.asm.org/
[image:5.585.41.545.93.659.2]FIG 3Phage type distribution among the minimum spanning tree calculated for MLVA profiles ofS.Enteritidis isolates. De Cesare et al.
on May 16, 2020 by guest
http://jcm.asm.org/
[image:6.585.49.398.81.693.2]FIG 4Pulsotypes identified among the 238S.Enteritidis isolates.
FIG 5Ribotyping profiles associated with the 238S.Enteritidis isolates.
on May 16, 2020 by guest
http://jcm.asm.org/
[image:7.585.90.488.70.457.2] [image:7.585.138.448.544.708.2]along with execution time, cost effectiveness, and the level of
complexity of data interpretation and sharing, should help in
making a critical choice on the most appropriate method to
apply for typing
S.
Enteritidis during both outbreak
investiga-tions and longtime surveillance. Even if the most promising
routine epidemiological typing tool for
Salmonella enterica
[image:8.585.41.546.114.251.2]seems to be whole-genome sequencing (WGS) (
19
), when an
al-ternative method must be selected, MLVA is confirmed to be the
best choice. In fact, it is highly discriminatory, reproducible, fast,
and easy to perform. Moreover, it produces results easy to
inter-pret and analyze, which can be shared using international
data-bases.
TABLE 2Discriminatory power of each typing method applied alone or in combination with other methods on theS.Enteritidis isolates tested
Method/combination
(no. of isolates) No. types
No. unique isolates
No. clustered
isolates Cluster size DI (95% CI)a
MLVA (238) 44 21 217 2–67 0.88 (0.85–0.91)
PFGE (238) 24 10 228 2–109 0.74 (0.69–0.79)
RIBO (238) 7 3 235 3–136 0.54 (0.50–0.57)
PT (207) 25 5 202 2–57 0.87 (0.84–0.90)
MLVA-PT (207) 85 51 156 2–32 0.96 (0.95–0.97)
PFGE-PT (207) 64 41 166 2–40 0.93 (0.91–0.95)
RIBO-PT (207) 50 22 185 2–33 0.94 (0.92–0.95)
MLVA-PFGE (238) 81 55 183 2–39 0.95 (0.94–0.97)
MLVA-RIBO (238) 64 30 208 2–41 0.94 (0.93–0.96)
PFGE-RIBO (238) 38 19 219 2–59 0.88 (0.86–0.91)
MLVA-PFGE-RIBO (238) 104 66 172 2–25 0.97 (0.97–0.98)
[image:8.585.43.544.324.462.2]aDI, Discriminatory index; CI, confidence interval.
TABLE 3Unidirectional concordance of the typing methods applied
No. of isolates Typing method A Typing method B WA¡B(95% CI) AWA¡B(95% CI)
238 MLVA PFGE 0.377 (0.297–0.457) 0.164 (0.057–0.272) 238 MLVA RIBO 0.465 (0.396–0.533) 0.010 (0.000–0.0137) 207 MLVA PT 0.300 (0.212–0.388) 0.201 (0.101–0.302) 238 PFGE MLVA 0.173 (0.127–0.219) 0.064 (0.011–0.116) 238 PFGE RIBO 0.446 (0.397–0.494) 0.000 (0.000–0.090) 207 PFGE PT 0.240 (0.183–0.297) 0.133 (0.068–0.198) 238 RIBO MLVA 0.118 (0.086–0.150) 0.002 (0.000–0.038) 238 RIBO PFGE 0.247 (0.199–0.295) 0.000 (0.000–0.064) 207 RIBO PT 0.130 (0.101–0.159) 0.007 (0.000–0.040) 207 PT MLVA 0.276 (0.193–0.358) 0.183 (0.090–0.276) 207 PT PFGE 0.506 (0.408–0.604) 0.332 (0.199–0.465) 207 PT RIBO 0.480 (0.422–0.538) 0.043 (0.000–0.150)
TABLE 4Bidirectional concordance of the typing methods applied
No. of isolates Typing method A Typing method B AR (95% CI)
238 MLVA PFGE 0.092 (0.043–0.141)
238 MLVA RIBO 0.003 (0.000–0.030)
207 MLVA PT 0.192 (0.112–0.274)
238 PFGE RIBO 0.000 (0.000–0.014)
207 PFGE PT 0.190 (0.125–0.257)
207 RIBO PT 0.012 (0.000–0.033)
De Cesare et al.
on May 16, 2020 by guest
http://jcm.asm.org/
[image:8.585.41.542.516.592.2]TABLE 5Type strains identified
Cluster label Type strain MLVA-PFGE(RIBO)PT (no. of isolates) Source (no. of isolates if⬎1) Isolation year (no. of isolates if⬎1) [region(s)]a
1 8-1 (494-S-1) PT8 (8) Poultry feces (5) 2008 [TA], 2010 [ER, LO], 2011 [LA, MA] Fresh poultry meat 2008 [U]
Swab poultry farm 2009 [FR] Dust poultry farm 2010 [FR] 2 9-1(507-S-2)PT13A (2) Poultry feces 2009 [V]
Fresh poultry meat 2009 [V] 3 13-18(494-S-1)PT6C (2) Fish products (2) 2010 [ER, V] 4 18-1(494-S-1)PT8 (2) Fish product 2010 [CA]
Dust poultry farm 2011 [LO] 5 21-1(494-S-1)PT14B (4) Poultry feces 2010 [LO] Dust poultry farm 2011 [LO]
Eggs/egg products (2) 2009 [LO], 2010[LO] 6 21-1(507-S-2)PT14B (2) Poultry feces (2) 2010 [LO], 2011 [LO] 7 28-10(494-S-1)PT21 (2) Fresh poultry meat 2008 [V]
Poultry feces 2011 [LA] 8 28-9(494-S-1)PT6 (3) Fresh poultry meat (2) 2010 [ER, V]
Processed beef meat 2009 [V] 9 28-9(507-S-2)PT6 (3) Fresh poultry meat (2) 2010 [V, V]
Poultry feces 2009 [V] 10 28-10(507-S-2)PT7 (2) Poultry feces 2011 [LO]
Dust poultry farm 2011 [V] 11 30-9(507-S-2)PT4 (2) Processed beef meat 2008 [CA]
Milk 2008 [CA] 12 31-9(494-S-1)PT1 (3) Feces of poultry 2009 [V]
Cheese 2010 [V] Milk 2010 [V] 13 31-10(494-S-1)PT1 (2) Swab poultry farm 2010 [A] Fish product 2011 [ER] 14 31-10(494-S-1)PT3 (2) Organ/tissue poultry 2009 [V]
Fresh poultry meat 2010 [ER]
15 31-9(494-S-1)PT4 (16) Organ/tissue bovine (2) 2009 [V], 2011 [MA] Organ/tissue poultry 2008 [V]
Organ/tissue swine 2008 [LO] Duck feces 2008 [V] Unknown poultry farm 2008 [P] Eggs/egg products (2) 2008 [LO, LO] Processed turkey meat 2008 [ER] Bovine feces 2009 [V] Poultry feces 2009 [P] Dust poultry farm 2009 [T] Turkey farm material 2008 [ER] Organ/tissue canary 2011 [V] Organ/tissue boar 2011 [LO] River water 2011 [U] 16 31-13(494-S-1)PT4 (2) Organ/tissue poultry 2008 [FR]
Organ/tissue Guinea hen 2009 [ER] 17 31-17(494-S-1)PT4 (3) Poultry feces 2010 [CA]
Organ/tissue poultry (2) 2010 [V], 2011 [LO] 18 31-9(507-S-2)PT4 (5) Organ/tissue ovine 2008 [P]
Eggs/egg product 2008 [FR] Processed meat 2010 [LI] Dog feces 2011 [U] Poultry feces 2011 [U] 19 31-10(494-S-1)PT59 (2) Poultry farm 2011 [MA]
Fish product 2011 [CA] 20 31-17(507-S-2)PT4 (3) Organ/tissue poultry (2) 2010 [V], 2011 [V]
Eggs/egg products 2009 [A] 21 31-10(507-S-2)PT6A (2) Poultry feces (2) 2010 [MA, MA] 22 33-9(494-S-1)PT1 (3) Processed poultry meat 2008 [V]
Fresh poultry meat 2008 [V] Fresh beef meat 2009 [LO]
(Continued on following page)
on May 16, 2020 by guest
http://jcm.asm.org/
REFERENCES
1.European Food Safety Authority and European Centre for Disease Prevention and Control.2015. The European Union summary report on trends and sources of zoonoses, zoonotic agents and food-borne out-breaks in 2013. EFSA J13(1):3991.
2.Hopkins KL, Peters TM, de Pinna E, Wain J.2011. Standardisation of multilocus variable-number tandem repeat analysis (MLVA) for subtyping of Salmonella entericaserovar Enteritidis. Euro Surveill 16(32):pii⫽19942.http://www.eurosurveillance.org/ViewArticle.aspx ?ArticleId⫽19942.
3.Ribot EM, Fair MA, Gautom R, Cameron DN, Hunter SB, Swamina-than B, Barrett TJ.2006. Standardization of pulsed-field gel electropho-resis protocols for the subtyping ofEscherichia coliO157:H7,Salmonella, andShigellafor PulseNet. Foodborne Pathog Dis3:59 – 67.http://dx.doi .org/10.1089/fpd.2006.3.59.
4.Bruce J.1996. Automated system rapidly identifies and characterizes mi-cro-organisms in foods. Food Technol50:77–78.
5.Hunter PR.1990. Reproducibility and indices of discriminatory of dis-criminatory power of microbial typing methods. J Clin Microbiol28: 1903–1905.
6.Hunter PR, Gaston MA.1988. Numerical index of the discriminatory ability of typing systems: an application of Simpson’s index of diversity. J Clin Microbiol26:2465–2466.
7.Severiano A, Pinto FR, Ramirez M, Carriço JA.2011. Adjusted Wallace coefficient as a measure of congruence between typing methods. J Clin Microbiol49:3997– 4000.http://dx.doi.org/10.1128/JCM.00624-11. 8.Carriço JA, Silva-Costa C, Melo-Cristino J, Pinto FR, de Lencastre H,
Almeida JS, Ramirez M.2006. Illustration of a common framework for relating multiple typing methods by application to macrolide-resistant Streptococcus pyogenes. J Clin Microbiol44:2524 –2532.http://dx.doi.org /10.1128/JCM.02536-05.
9.Lynne AM, Kaldhone P, David D, White DG, Foley SL.2009. Charac-terization of antimicrobial resistance inSalmonella entericaserotype Heidelberg isolated from food animals. Foodborne Pathog Dis6:207–215. http://dx.doi.org/10.1089/fpd.2008.0172.
10. Ponce E, Khan AA, Cheng CM, Summage-West C, Cerniglia CE.2008. Prevalence and characterization ofSalmonella entericaserovar Weltevre-den from imported seafood. Food Microbiol25:29 –35.http://dx.doi.org /10.1016/j.fm.2007.09.001.
11. Centers for Disease Control and Prevention.2010. Investigation update: multistate outbreak of humanSalmonellaenteritidis infections associated with shell eggs. Centers for Disease Control and Prevention, Atlanta, GA. http://www.cdc.gov/salmonella/Enteritidis.
12. Jacobs W, Kuiling S, van der Zwaluw K.2014. Molecular typing of Salmonellastrains isolated from food, feed and animals: state of play and standard operating procedures for pulsed field gel electrophoresis (PFGE) and multiple-locus variable number tandem repeat Analysis (MLVA) typing, profiles interpretation and curation. EFSA supporting publication 2014:EN-703. European Food Safety Authority, Parma, Italy.
13. Boxrud D, Pederson-Gulrud K, Wotton J, Medus C, Lyszkowicz E, Besser J, Bartkus JM.2007. Comparison of multiple-locus variable-number tandem repeat analysis, pulsed-field gel electrophoresis, and phage typing for subtype analysis ofSalmonella entericaserotype Enter-itidis. J Clin Microbiol 45:536 –543.http://dx.doi.org/10.1128/JCM .01595-06.
14. European Food Safety Authority and European Centre for Disease Prevention and Control.2014. Multi-country outbreak ofSalmonella Enteritidis infections associated with consumption of eggs from Germany. EFSA supporting publication 2014:EN-646.http://www.efsa.europa.eu/it /supporting/doc/646e.pdf
15. Peters TM, Berghold C, Brown D, Coia J, Dionisi AM, Echeita A, Fisher IS, Gatto AJ, Gill N, Green J, Gerner-Smidt P, Heck M, Lederer I, Lukinmaa S, Luzzi I, Maguire C, Prager R, Usera M, Siitonen A, Threlfall EJ, Torpdahl M, Tschäpe H, Wannet W, Zwaluw WK.2007. Relationship of pulsed-field profiles with key phage types ofSalmonella entericaserotype Enteritidis in Europe: results of an international multi-center study. Epidemiol Infect135:1274 –1281.
16. Saeed AM, Walk ST, Arshad M, Whittam TS.2006. Clonal structure and variation in virulence ofSalmonellaEnteritidis isolated from mice, chick-ens, and humans. J AOAC Int9:504 –511.
[image:10.585.41.545.76.324.2]17. Cho S, Whittam TS, Boxrud DJ, Bartkus JM, Rankin SC, Wilkins MJ, Somsel P, Downes FP, Musser KA, Root TP, Warnick LD, Wiedmann M, Saeed AM.2010. Use of multiple-locus variable num-ber tandem repeat analysis and phage typing for subtyping of Salmo-nellaEnteritidis from sporadic human cases in the United States. J Appl TABLE 5(Continued)
Cluster label Type strain MLVA-PFGE(RIBO)PT (no. of isolates) Source (no. of isolates if⬎1) Isolation year (no. of isolates if⬎1) [region(s)]a
23 33-9(507-S-2)PT1 (2) Fresh poultry meat 2008 [V] Poultry feces 2010 [ER] 24 35-9(494-S-1)PT14B (3) Food unknown origin 2009 [CA] Organ/tissue poultry 2009 [V] Poultry feces 2011 [CA] 25 37-10(494-S-1)PT21 (4) Poultry feces (2) 2008 [V], 2009 [U]
Organ/tissue poultry (2) 2008 [MA, V] 26 37-14(494-S-1)PT21 (2) Eggs/egg products 2010 [A]
Dust poultry farm 2011 [U] 27 37-9(494-S1)PT4 (2) Unknown poultry farm 2010 [LO]
Swab poultry farm 2011 [V] 28 37-9(507-S-2)PT4 (3) Poultry feces 2009 [V] Eggs/egg products 2009 [LO] Organ/tissue poultry 2011 [V] 29 37-17(507-S-2)PT4 (2) Organ/tissue poultry 2010 [LO]
Poultry feces 2011 [V] 30 39-9(494-S-1)PT14B (4) Organ/tissue poultry 2010 [V] Eggs/egg products 2011 [V]
Pastry products (2) 2010 [T], 2011 [FR] 31 39-9(507-S-2)PT14B (2) Organ/tissue poultry 2011 [V]
Cheese 2011 [TA] 32 40-9(494-S-1)PT21 (2) Dust poultry farm 2008 [V]
Processed pig meat 2010 [T]
aRegion: A, Abruzzo; CA, Campania; ER, Emilia-Romagna; FR, Friuli Venezia Giulia; LA, Lazio; LI, Liguria; LO, Lombardia; MA, Marche; P, Piemonte; T, Tuscany; TA, Trentino
Alto Adige; U, Umbria; V, Veneto.
De Cesare et al.
on May 16, 2020 by guest
http://jcm.asm.org/
Microbiol 108:859 – 867. http://dx.doi.org/10.1111/j.1365-2672.2009 .04492.x.
18. Dewaele I, Rasschaert G, Bertrand S, Wildemauwe C, Wattiau P, Imberechts H, Herman L, Ducatelle R, De Reu K, Heyndrickx M. 2012. Molecular characterization ofSalmonellaEnteritidis: comparison of an optimized multi-locus variable-number of tandem repeat analysis
(MLVA) and pulsed-field gel electrophoresis. Foodborne Pathog Dis 9:885– 895.http://dx.doi.org/10.1089/fpd.2012.1199.
19. Leekitcharoenphon P, Nielsen EM, Kaas RS, Lund O, Aarestrup FM. 2014. Evaluation of whole genome sequencing for outbreak detection of Salmonella enterica. PLoS One 9:e87991.http://dx.doi.org/10.1371 /journal.pone.0087991.