An Expert System for Improving Sieve Calibration
Process
Peterson Adriano Belan
Departament of Informatics, Universidade Nove de Julho,São Paulo, Brazil
André Felipe H. Librantz
Industrial Eng. Post GraduationProgram, Universidade Nove de Julho, São Paulo, Brazil
Sidnei Alves de Araújo
Industrial Eng. Post GraduationProgram, Universidade Nove de Julho, São Paulo, Brazil
ABSTRACT
The reliability of the results obtained from instruments calibration is a problem frequently found in the calibration laboratories, especially when these instruments are mechanical and do not have a built-in communication interface. In this case, the time consuming is increased significantly and the calibration may be subject to human error. In this paper, a machine vision based system for automatic calibration of sieve was presented. The proposed equipment joined to the proposed technique showed in the results a reduction of 97% in the spending time for calibration process when compared to the traditional methods with the same accuracy.
Keywords
Calibration, Computer Vision, Sieve, Otsu algorithm.
1.
INTRODUCTION
A common problem found in the calibration laboratories nowadays is the productivity of their technicians, the reliability of the results obtained in the calibration process and the transcript of the calibration certificate [1]. This is mainly caused by the fact that, the technician who carried out the calibration service does not issue the certificate, but only signs it after the filling done by a typist. In some cases, the result in the certificate can be different that one obtained during the calibration process, frequently caused by human errors in transcription data.
The calibration processes accuracy may be significantly affected when instruments without built-in communication interface are involved because the several manuals readings and transcriptions of the data are more subject to human errors. Moreover, this task is time consuming and stressful [1, 2]. There are two common ways to calibrate sieves: physically examine each sieve using a profile projector and conduct calibration tests using glass sphere, however the second way doesn’t have the same precision as the first one, because in the first it’s possible to measure the sieve mesh and the wire thickness, while the second way only provides a qualitative results.
Therefore, computer vision systems play a very important role nowadays in the calibration of measuring instruments because they provide greater accuracy, repeatability and cost savings, beyond the reduction of monotonous and complex tasks [1-3].
Computer vision can be defined as a subarea of image processing that studies the development of methods and techniques that enable a computer system to recognize objects in images imitating some capabilities of the human visual
system, as the ability to describe a scene contained in a digital image.
Indeed, an efficient computer vision system must be able to extract a set of attributes that accurately describes a scene and small enough to reduce the spending processing time to be applied used in practical applications such as robot vision systems, autonomous vehicles, surveillance systems, automatic license plate recognition, industrial inspection and biometrics patterns recognition.
In the last years, many authors have proposed automatic calibration approaches using computer vision techniques [1-9]. Despite of the large number of applications, few results have been already reported in the literature about automatic sieve calibration.
In this context, a machine vision approach is presented in this work, to automate the process of calibration of sieves making the measure of the sieve mesh and its wire thickness. For that, an algorithm using Otsu binarization [10] and the connect component [10] method were proposed. The calibration values could be stored automatically in a database, reducing the possibility of human errors in data reading/ transcription process for the issuance certificate. The remainder of the paper is organized, as follows. Section 2 describes the equipment developed for the experiments. In section 3, the proposed method for the calibration of the sieve is described. In the section 4, some experimental results are shown and finally, the Section 6 concludes the paper, relating further investigations.
2.
MATERIALS AND METHODS
2.1
Developed equipment for sieve
calibration
The device for calibration of the sieve provides rotation for the sieve, so that this displacement could run the complete revolution in the sieve during the calibration process, stopping five times on its course to acquire images of the mesh that allows sampling compatible with that one required by the rules quality of calibration laboratories.
Volume 79 – No8, October 2013
Fig 1: Equipment developed for the automatic sieve calibration
2.2
Image acquisition
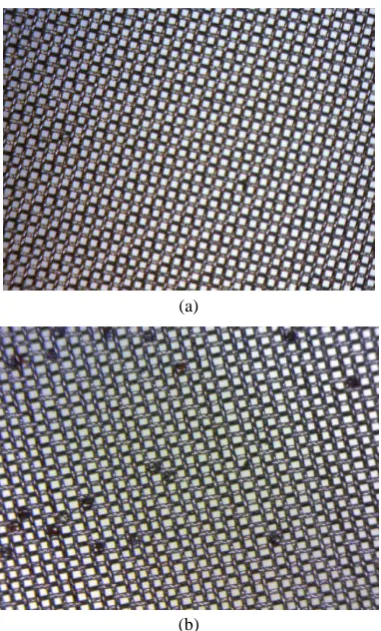
In this work, twenty images were acquired of two mesh sieves: a new one and a used sieve. As can be seen in Figure 2a the first one presents mesh clean, without dirt and completely uniform. On the other hand, the used sieve presents in its mesh considerable changes in hole size and problems of dirt, as well, normally caused by continuous use, as shown in Figure 2b.
(a)
(b)
Fig 2: Example of acquired images of the sieves (a) a new sieve without use and (b) used sieve
[image:2.595.324.530.358.515.2]As reference, it was used an acquired image of a rule graduated crystal pattern. This image was used to calibrate the system by measuring the number of pixels between the lines shown in Figure 3.
Fig 3: Graduated scale pattern.
3.
SIEVE AUTOMATIC CALIBRATION
SYSTEM
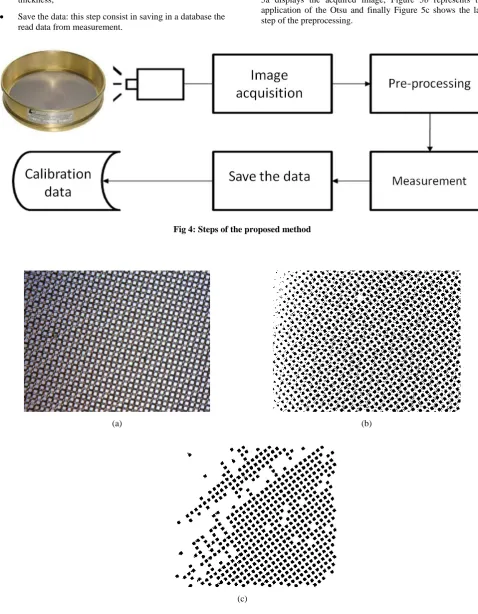
The calibration consisted in measuring the spaces on the sample mesh. This reading must take into account five different regions of the sieve and analyze at least 600 holes in the mesh. In this work, a sieve with the mesh of 38μm has been used. The Figure 4 illustrates the calibration of the sieve- process.
The proposed system is composed by following steps: Image acquisition: in this step an image of the mesh is
acquired using the USB microscopic with magnification varying from to 5x to 500x;
Pre-processing: Otsu algorithm threshold and a filter to discard 4-connectedcomponents were applied to reduce noise, i.e. dirt that could interfere in the results;
[image:2.595.73.264.401.717.2]projection histogram was applied to determine the wire thickness;
Save the data: this step consist in saving in a database the read data from measurement.
[image:3.595.54.533.88.703.2]The result of the preprocessing is shown in Figure 5. Figure 5a displays the acquired image, Figure 5b represents the application of the Otsu and finally Figure 5c shows the last step of the preprocessing.
Fig 4: Steps of the proposed method
(a) (b)
(c)
[image:3.595.51.547.135.303.2]Volume 79 – No8, October 2013
One can observe that the after the pre-processing step the remaining points to be analyzed are ten times higher than the recommended in the manual calibration process.
After that, the analysis of the hole sizes is conducted. It consists in of 8-connected-components counting, measuring the area of each component (hole sieve) and comparing this value with that one obtained by calibration of the system based on a standard scale (Figure 3).
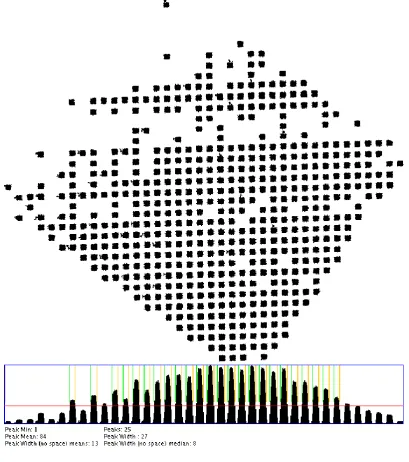
[image:4.595.92.502.172.635.2]Subsequently, the thickness of wire is determined, rotating the image from -45 degrees to 45 degrees, with 0.5 degree step. For each rotating image, vertical and horizontal projection histograms are calculated, and the highest value is assigned as a point for measurement. The result of this process is shown in Figure 6.
Fig 6: Result of the thickness of wire measured by the proposed method
All values acquired during the calibration process, are stored in a database to issue the calibration certificate. The software has been developed in C++ language using the image processing library PROEIKON [11].
4.
RESULTS AND DISCUSSION
Six hundred holes per region were analyzed, i.e. 3000 holes on average per sieve, which is ten times larger than the sample of the traditional method, currently carried out using profile
process time at ~36 times (5 min). The spent time and the accuracy of the proposed system have been compared with values acquired in a laboratory subject to national rules of calibration. Figure 7 shows the distribution of obtained results in the calibration of one sieve. One can see that they are in good agreement with those obtained by traditional method, thus ensuring the reliability of the system.
Fig 7: Distribution of the obtained results by the proposed system
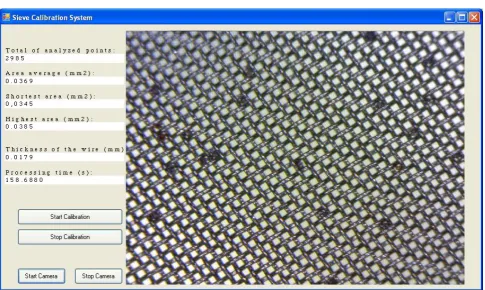
Fig 8: Interface of the sieve calibration system
The results showed in average, deviations of 1.1 µm, which is considered acceptable, validating the results and applicability of the system in calibration laboratories.
5.
CONCLUSIONS
In this study a machine vision based system for automatic sieve calibration was developed. The results indicate that the system was effective for measurement of the holes and the
[image:5.595.56.542.347.637.2]Volume 79 – No8, October 2013
6.
ACKNOWLEDGMENTS
The authors would like to thank Uninove by financial support and CAPES for the scholarship granted to one of the authors.
7.
REFERENCES
[1] F.C. Alegria,A.C. Serra, Computer vision applied to the automatic calibration ofmeasuring instruments, Measurement.28 (2000)185–195.
[2] F.C. Alegria, A.C. Serra,Automatic Calibration of Analog and Digital Measuring Instruments Using Computer Vision, IEEE Transactions on Instrumentation and Measurement.49 (2000) 94–99.
[3] G. Andria et al., Automatic Calibration System for Digital Instruments Without Built-In Communication Interface,Anais do XIX IMEKO World Congress (Lisbon). (2009) 857–860.
[4] E.V. Fernández et al., A machine vision system for the calibration of digital thermometers, Measurement Science and Technology. 20 (2009) 1–7.
[5] B. Hemming, H. Lehto, Calibration of dial indicators using machine vision, Measurement Science and Technology. 13 (2002) 45–49.
[6] B. Hemming, A. Fagerlund, A. Lassila, High-accuracy automatic machine vision based calibration of micrometers, Measurement Science and Technology. 18 (2007) 1655–1660.
[7] W.He et al., Intelligent reading method for analog meter based on computer vision, Chinese Journal of Scientific Instrument. 28 (2007) 1234–1239.
[8] P.A. Belan, S.A. Araújo, A.F.H. Librantz, Computer vision techniques applied to the process of calibrating measurement instruments having numeric displays without built-in data communication interfaces, Exacta. 10 (2012) 83–91.
[9] P.A. Belan, S.A. Araújo, A.F.H. Librantz, Segmentation-free approaches of computer vision for automatic calibration of digital and analog instruments, Measurement Science and Technology. 46 (2013) 177– 184.
[10]R.C. Gonzalez, R.E. Woods, Digital Image Processing.Massachusetts: Addison-Wesley. 793 pp, 2002.