R E S E A R C H
Open Access
At what levels of financial development
does information sharing matter?
Simplice A. Asongu
1,2*and Jacinta C. Nwachukwu
3* Correspondence: [email protected]
1African Governance and
Development Institute, P.O. Box 8413, Yaoundé, Cameroon
2
Department of Economics, University of South Africa, P. O. Box 392, Pretoria UNISA 0003, South Africa
Full list of author information is available at the end of the article
Abstract
Background:The purpose of this study is to investigate how an increase in
information-sharing bureaus affects financial access.
Methods:We employed contemporary and non-contemporary interactive quantile
regressions in 53 African countries for the period 2004–2011. Information-sharing bureaus are proxied with public credit registries and private credit offices. Financial development dynamics involving depth (at overall economic and financial system levels), efficiency (at banking and financial system levels), activity (from banking and financial system perspectives), and size are used.
Results:Two key findings are established. First, the effect of an increase in private
credit bureaus is not clearly noticeable on financial access, probably because private credit agencies are still to be established in many countries. Second, an increase in public credit registries for the most part improves financial allocation efficiency and activity (or credit) between the 25th and 75th quartiles.
Conclusions:As a main policy implication, countries in the top and bottom ends of
the financial efficiency and activity distributions are unlikely to benefit from enhanced financial allocation efficiency as a result of an increase in public credit registries.
Keywords:Information sharing, Financial development, Quantile regression
JEL classification:G20, G29, O16, O55, C52
Background
The purpose of this study is to assess how an increase in information-sharing offices affects financial access when existing levels of financial development are taken into account. Re-cent literature reveals that less than 20% of African households have access to financial ser-vices (see IFAD 2011; Asongu et al. 2017). This widespread narrative indicates that a great part of the population on the continent depends on the informal sector for financial ser-vices. Some factors limiting access to finance include low population densities in many areas, poor facilities in transport, and limited communication infrastructure. In regions where financial services from the formal sector are available, low-income households and small businesses are for the most part unable to meet certain basic lending requirements, like strict documentation and collateral provision. Even in situations where such conditions are met, cost barriers (like substantial transaction fees) and high minimum deposits of sav-ings could still overwhelmingly restrict financial access.
The above concerns have led to issues of surplus liquidity or excess cash in African formal financial institutions (see Saxegaard 2006; Fouda 2009; Asongu 2014a, p. 70). The authors have suggested measures to curb both the voluntary and involuntary hold-ing of excess liquidity by banks. First, voluntary holdhold-ing of excess cash can be reduced by: (i) helping banks to track their positions at the central bank to prevent them from keeping reserves above statutory limits; (ii) consolidating institutions that are favorable to interbank lending; and (iii) improving infrastructure to prevent remote bank branches from holding excess reserves essentially due to transportation problems. Sec-ond, involuntary keeping of surplus cash can be kept at minimum by: (i) reducing the incapacity of banks to lend in scenarios where interest rates are regulated; (ii) creating conducive conditions for commercial banks to invest surplus liquidity in bond markets; (iii) increasing investment avenues for regional banks via promotion of regional stock ex-change markets; and (iv) reducing lending contraction of banks through instruments that encourage competition and mitigate information asymmetry. This line of inquiry is closest to the final point (iii) of the first strand, regarding the improvement of infrastructure.
Over the past decade, information-sharing bureaus have been introduced across the Afri-can continent in order to enhance financial access by limiting information asymmetry. Un-fortunately, recent empirical literature has been based on the assumption that information-sharing agencies may not be increasing financial access as theoretically anticipated (see Triki and Gajigo 2014). For instance, Asongu et al. (2016) concluded that the effects of information-sharing bureaus have mostly been negative on financial development dynamics in terms of depth, allocation efficiency, and activity. Moreover, as we shall demonstrate in the literature review that follows, there has been very limited scholarly focus on the role of information-sharing agencies on financial access in the African continent.
This study addresses the highlighted gaps by investigating the levels of financial de-velopment for which an increase in information-sharing bureaus can most enhance fi-nancial access. The interest in considering initial levels of fifi-nancial development arises because the findings of Asongu et al. (2016) were based on the average values of finan-cial development. It is important to include countries with low, intermediate, and high levels of financial development in the modeling exercise, because blanket policies based on the mean values of financial access may not succeed unless they are contingent on initial levels of financial development and tailored differently across countries with dif-ferent levels of financial access (see Henderson et al. 2013). In the light of the above in-sights, the quantile regression empirical strategy is adopted, because existing studies on information sharing have examined the relationship between information-sharing bur-eaus and financial development using parameter estimates based on the conditional means of financial development variables (Triki and Gajigo 2014; Asongu et al. 2016).
the modeling exercise. One of the main results stemming from the econometric ana-lysis is that an increase in public credit registries improves financial efficiency in coun-tries in the middle range of the financial development distribution. This result is intuitive, because for poorly developed financial systems, increasing information-sharing bureaus may in some respects decrease the pace of development, whereas for more developed financial systems, the impact of information sharing may already have been taken into account. It is important to note that some initial conditions (e.g. good infrastructure, saving accounts for the majority of the population and high penetration of information and communication technology) that are essential for information-sharing bureaus to improve financial access may not be apparent in countries with poorly developed financial systems.
The rest of the study is structured as follows. Section 2 discusses the stylized facts, theoretical underpinnings, and empirical literature. The data and methodology are cov-ered in Section 3. The empirical results are presented and discussed in Section 4. Sec-tion 5 concludes with future research direcSec-tions.
Stylized facts, theoretical underpinnings, and empirical literature Stylized facts
Information-sharing bureaus or credit reference agencies (private credit bureaus and/or public credit registries) are institutions that collect information on the obligations of commercial and individual borrowers from various sources, namely direct investigation and public sources (for businesses), banks and credit card companies (for individuals), and retail lenders (Tchamyou and Asongu 2017). Once the data are collected, the infor-mation is consolidated after cross-checking to provide a comprehensive credit report. Such a report is useful for potential creditors. Data from a credit history report can en-compass both positive and negative information: (i) positive information (entailing de-tails on all opened and closed credits and repayment behavior) and (ii) negative information (which comprises default data for the most part).
Information-sharing bureaus are essential to enhance financial access in any econ-omy, because they enable the mitigation of the information asymmetry that restricts lenders from offering credit. On the one hand, adverse selection issues are attenuated with information from credit histories. On the other, moral hazard issues are also con-trolled by limiting default rates and increasing repayment rates. Ultimately, the incre-mental volume in lending is essential for sectors with limited financial access like micro, small, and medium corporations.
provide timely and accurate information. Before 2008, numerous initiatives were imple-mented throughout Africa in order to institute private credit bureaus, given demands for data from supervising authorities to consolidate risk management practices on the one hand, and from financial institutions on the other. In response, many countries in-troduced information-sharing bureaus, including Ghana, Nigeria, Tanzania, Uganda, and Zambia.
Theoretical highlights
As documented by Claus and Grimes (2003), two principal strands exist in the theoretical underpinnings of the literature on the linkage between financial intermediaries and infor-mation sharing. The first strand investigates liquidity provision by financial institutions, while the second focuses on the capacity of financial intermediaries to modify the risk characteristics of assets. Both strands are founded on the essential economic role of finan-cial intermediation, which is to augment efficiency in allocation by reducing the cost of conveying mobilized deposits from depositors to borrowers. The theories underlying the mission of financial intermediation are based on the literature of imperfect information in the market. Accordingly, the primary task of financial intermediation is to reduce transac-tion and informatransac-tion costs arising from informatransac-tion asymmetry between lenders and bor-rowers. Therefore, the establishment of information-sharing bureaus is a channel through which such information can be consolidated. These underpinnings are consistent with the pioneering literature on the relevance of information sharing in financial intermediary efficiency; most notably on models of credit rationing (see Williamson 1986; Stiglitz and Weiss 1981; Jaffee and Russell 1976), ex-post and ex-ante information asymmetry (Dia-mond and Dybvig 1983), communication on potential borrowers to investors by banks (Leland and Pyle 1977), and diversification with financial intermediaries (Diamond 1984).
The association between information-sharing bureaus and financial access can be seen from the view of adverse selection (from lenders) on the one hand and the per-spective of moral hazard (from borrowers) on the other. Information-sharing agencies provide lenders of financial institutions with borrower information and credit histories that enable the reduction of substantial interest rates, which were the previous conse-quence of adverse selection on the part of financial institutions. When borrowers are granted credit, they automatically become liable to moral hazard, because their eco-nomic activities related to granted credit could be concealed in order to reduce compli-ance with their financial obligations towards the bank or lender. The responsibility therefore falls on the credit bureaus to discipline borrowers on the severe consequences of not complying with their periodic financial obligations. It is within this framework that information-sharing bureaus reduce moral hazard in borrowers, essentially by edu-cating them on the perils of debt defaults and resorting to the informal financial sector as a sustainable alternative to the formal banking sector.
Empirical literature
inter alia: capital structure (El Ghoul et al. 2012); bankruptcy (Claessens and Klapper 2005; Djankov et al. 2007); and more risk-taking by financial institutions (Houston et al. 2010; Acharya et al. 2011). This last orientation has revolved around investigating how sharing information consolidates credit availability (Djankov et al. 2007; Brown et al. 2009; Triki and Gajigo 2014), mitigates rates of default (Jappelli and Pagano 2002), reduces credit cost (Brown et al. 2009), affects syndicated bank loans (Ivashina 2009; Tanjung et al. 2010), impacts antitrust intervention (Coccorese 2012), and affects cor-rupt lending (Barth et al. 2009).
The above literature indicates that inquiries have for the most part been dedicated to developed countries, which have comparatively less severe barriers to financial access. However, while a substantial body of studies has been oriented toward the Organisation of Economic Cooperation countries, and on emerging nations in Asia and Latin America, very little scholarly work has been devoted to Africa, a continent with substantially higher constraints to financial access (Asongu et al. 2017).
Macroeconomic evidence on the influence of reducing information asymmetry has been investigated by Galindo and Miller (2001), who concluded that developed coun-tries with credit regiscoun-tries are associated with lower levels of financial restrictions in comparison with their less developed counterparts with credit bureaus. Specifically, public credit registries that are performing well contribute considerably to help reduce the sensitivity of decisions in investment for “cash flow availability,” a characteristic proxy for financial constraint.
A combination of private credit bureaus and public credit offices was employed by Love and Mylenko (2003) with firm-based data from the World Bank Business Envir-onment Survey. They investigated whether financial access constraints are negatively related to credit registries. The findings show that private credit bureaus are linked to higher financial access, whereas public credit registries have no significant impact on decreasing constraints in financial access.
Barth et al. (2009) have investigated the effects of (i) information sharing and (ii) bor-rower and lender competition on “lending corruption” through information-sharing bureaus using the World Bank Business Environment Survey from 59 nations. The data set consisted of 4000 corporations and private credit agencies in 129 nations. Two main findings are established. First, corrupt lending is reduced by competition in banking and by reducing information asymmetry. Second, competition among firms and the legal environment have had a considerable effect on corrupt lending.
Triki and Gajigo (2014) investigated two principal issues, namely: (i) the impact of information-sharing bureaus on corporations’access to finance and (ii) the effect of the design of public credit registries on the extent of constraints on financial access. The following key findings are apparent. First, access to finance is comparatively greater in countries with higher numbers of private credit bureaus relative to countries with pub-lic credit registries or no information-sharing offices. Second, there is considerable het-erogeneity in financial access and on the design of information-sharing bureaus with public credit agencies.
credit registries have an insignificant effect. Information-sharing bureaus have negative effects on financial activity, with the impact from public credit registries being com-paratively higher. The positive influence of private credit bureaus on financial size is comparatively low.
Methods Data
As outlined above, this study examines a panel of 53 African countries with data for the period 2004–2011 from World Development Indicators and the Financial Develop-ment and Structure Database of the World Bank. The periodicity is constrained by data availability. Consistent with Asongu (2013), four financial development variables are used, namely: depth, efficiency, activity, and size. First, financial depth embodies (i) overall economic depth (M2/GDP)1representing the monetary base plus demand, sav-ings, and time deposits; and (ii) financial system deposits (Fdgdp). Distinguishing be-tween these measures is important, because a substantial bulk of the monetary base in developing nations does not circulate within the formal banking sector. Second, finan-cial allocation efficiency measures the ability of finanfinan-cial intermediaries to transform mobilized deposits into credit for economic agents. Two measurements of efficiency are used, namely: (i) banking system efficiency (using “bank credit on bank deposits: Bcbd”) and (ii) financial system efficiency (using “financial system credit on financial system deposits: Fcfd”). Third, financial activity is measured as the ability of financial institutions to provide credit to economic agents. Two indicators are also used for this dimension of financial development, namely (i) banking system activity (with “private domestic credit by deposit banks: Pcrb”) and (ii) financial system activity (with“private credit by domestic banks and other financial institutions:Pcrbof”). Fourth, financial size is the as the ratio of“deposit bank assets”to“total assets”(“deposit bank assets on cen-tral bank assets plus deposit bank assets: Dbacba”). Note that financial ratios that are dependent variables are mostly dimensions identified by the Financial Development and Structure Database of the World Bank.
credit registries belong to governments and/or central banks, the ownership of pri-vate credit bureaus revolve outside highlighted establishments (central banks and governments) to include lenders, lenders’ associates, and independent third parties. Fifth, while the data used by private credit registries are sourced from non-bank and bank financial establishments, data from public credit bureaus entails private credit registries, tax authorities, courts and utilities, to sources employed by private credit registries for information. Sixth, access to private credit registries (public credit bureaus) is restricted to providers of information (open to all lender types).
The control variables are also consistent with the recent information asymmetry literature (Asongu et al. 2016), namely, inflation, public investment, GDP growth, trade, and foreign aid. The selected covariates have also been substantially documented in the financial devel-opment literature (Osabuohien and Efobi 2013; Huang 2005; Asongu 2014b; Asongu 2015).
First, foreign aid like remittances (Aggarwal et al. 2011; Efobi et al. 2015) could in-crease financial development if it is not associated with activities that dein-crease its flow within a country, such as funds captured by developed countries for consultancy ser-vices and deposited by corrupt officials from developing countries in tax havens that are under the jurisdictions of developed countries.
Second, there is an abundance of literature that has established a positive growth-finance relationship (see Saint Paul 1992; Greenwood and Jovanovic 1990; Owusu and Odhiambo 2014; Nyasha and Odhiambo 2015a, b). According to these studies, eco-nomic growth is linked to decreasing costs in financial intermediation, which is the outcome of higher compensation that entails growing the financial resources devoted to investment. Moreover, the importance of income levels in financial development has been established in both broad (Levine 1997) and Africa-specific (Asongu 2012) studies. Whereas Asongu has shown that countries with high income are linked to greater fi-nancial development levels in Africa, Jaffee and Levonian (2001) concluded that higher-income countries are associated with more developed banking system structures. The engaged narrative needs to balance the fact that growth may be linked to financial cri-ses that ultimately reduce financial development (Asongu et al. 2016).
Third, there is a branch of the literature sympathetic to the perspective that policies that are friendly to openness (like trade) are positively linked to financial development (see Huang and Temple 2005; Do and Levchenko 2004).
Fourth, the nexus between investment and financial development has been assessed by Huang (2011), who found a positive connection.
Fifth, some main domestic macroeconomic policies, such as the maintenance of stable and/or low inflation levels, are needed for financial development (Huang, 2011; Boyd et al. 2001; Huybens and Smith 1999). Accordingly, Huybens and Smith (1999) and Boyd et al. (2001) have respectively shown theoretically and empirically that nations with chaotic and/or high inflation are very likely to be associated with smaller, less efficient, and less active financial institutions.
Methodology
Consistent with the research question, which is to assess the existing financial development levels for which the influence of information-sharing offices on financial access matters, the study accounts for the existing levels of financial development by employing a quantile re-gression estimation technique that has been documented to account for initial levels in dependent variables (see Billger and Goel 2009; Okada and Samreth 2012; Asongu and Nwachukwu 2017) with information-sharing bureaus being examined throughout the con-ditional distributions of the outcome variable (Koenker and Hallock 2001).
Previous literature on information sharing has examined the relationship between information-sharing bureaus and financial development by engaging parameter esti-mates at the conditional mean of the financial development variables (Triki and Gajigo 2014; Asongu et al. 2016). Whereas mean impacts are relevant, the underlying litera-ture is extended by employing quantile regressions that distinguish existing levels of fi-nancial access. Furthermore, while ordinary least squares (OLS) regressions are based on the hypothesis that financial access variables and error terms are normally distrib-uted, such an assumption of error terms that are normally distributed does not hold with quantile regressions.
The quantile regression models parameter estimates at numerous points of the condi-tional distribution of financial access. Therefore, the technique is in conformity with the motivation of distinguishing between nations with high, intermediate, and low ini-tial levels of financial development.
The θth quantile estimator of a financial access variable is derived by solving the optimization problem in Eq. (1), which is shown without subscripts for simplicity and ease of presentation.
min β∈Rk
X
i∈fi:yi≥xi0βg
θ yi−xi
0
β
þ X i∈fi:yi<xi0βg
1−θ
ð Þyi−xi
0
β
2 6 4
3 7
5 ð1Þ
where θ∈(0,1). As opposed to OLS, which is fundamentally based on minimizing the sum of squared residuals, with quantile regressions the weighted sum of the absolute deviations is minimized. For instance, the 25th or 75th quartiles (with θ= 0.25 or 0.75 respectively) are estimated by approximately weighting the residuals. The conditional quintile of financial development or yigivenxiis:
Qyðθ=xiÞ ¼xi
0
βo ð2Þ
Results and Discussion
Financial development and public credit registries
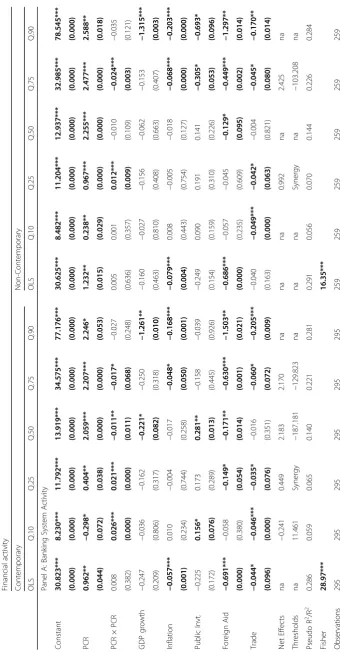
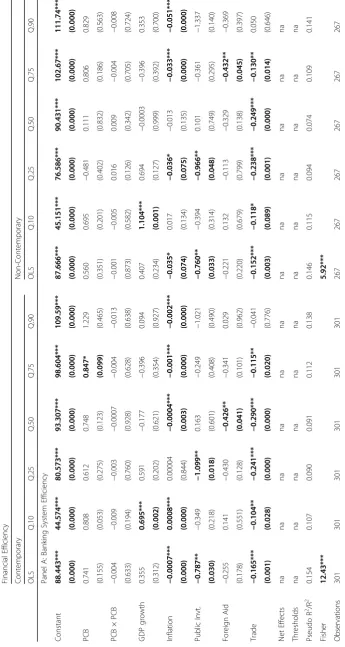
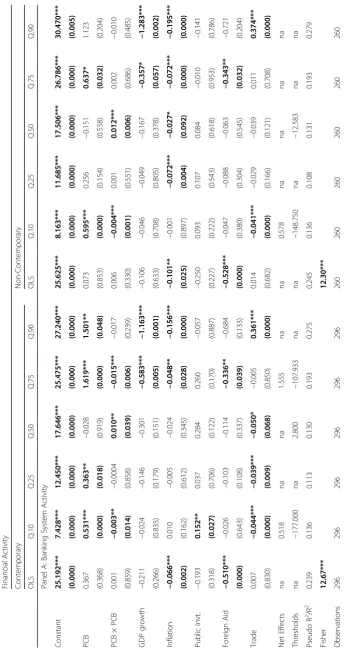
Tables 1, 2, 3, and 4 respectively disclose results corresponding to financial depth, fi-nancial allocation efficiency, fifi-nancial activity, and fifi-nancial size. Irrespective of tables, the left-handside (LHS) presents contemporary estimations, whereas the right-handside (RHS) presents non-contemporary estimations. The motivation for lagging the inde-pendent variables on the RHS by one year is to account for endogeneity (see Mlachila et al. 2014; Asongu et al. 2016). The consistent variations in information-sharing esti-mates between OLS and quantile regressions (with respect to sign, significance, and magnitude of significance) is a justification for the relevance of the problem statement, notably investigating the impact of increasing information-sharing offices on financial development where existing levels of financial development matter.
The findings are explained at three levels, namely, in terms of marginal effect, net ef-fect, and thresholds. The net effect of increasing public credit registries in the 0.10th quintile on the LHS of Table 1 is computed with conditional and unconditional effects of public credit registries. Accordingly, the marginal or conditional effect (from the interaction) is 0.052, while the unconditional impact of public credit registries is −0.945. Hence, the corresponding net effect of increasing public credit registries is −0.832 ([2.155 × 0.052] + −0.945)2. Given that the conditional or marginal impact is positive, the corresponding threshold in public credit registries at which the negative unconditional effect changes from negative to positive is 18.173 (0.945/0.052). The positive threshold is feasible, because it is within the public credit registries’ range (minimum to maximum) as disclosed by the summary statistics (0.00 to 49.80).
It is important to note that whereas the computation of net effects requires statistically significant unconditional and conditional effects, a threshold may be apparent even when only the conditional effect is significant. Consistent with Asongu and De Moor (2017), the notion of threshold is in accordance with Cummins (2000) on the minimum level/thresh-old in language proficiency before rewards are acquired in a second language. In addition, the definition of threshold is also supported by the critical mass theory, which has been abundantly documented in the literature on economic development (see Roller and Waverman 2001; Ashraf and Galor 2013). A recent application of the threshold or critical mass theory based on interaction variables can be found in Batuo (2015). Therefore, from the perspective of this study, the concept of threshold is not different from: (i) the mini-mum requirement for the reaping of positive effects (Cummins 2000); (ii) conditions for U-shape and inverted U-shape dynamics (Ashraf and Galor 2013) and (iii) critical mass for positive impacts (Roller and Waverman 2001; Batuo 2015).
Two key results can be established from Table 1 on linkages between financial depth and public credit registries. First, in Panel A on money supply, (i) there are positive thresholds (from contemporary and noncontemporary regressions) in the 10th decile with corresponding negative net effects; and (ii) there is a synergy effect in the 25th quartile on the LHS. It is important to note that threshold values and net effects are disclosed at the bottom of the panels. Second, in Panel B, most significant results are apparent between the 10th decile and 50th quartile with (i) both negative (positive) net effects in the 10th (25th) decile (quartile) and (ii) both positive and synergy effects in the 10th decile and 25th quartile and consistent synergy impacts in the 50th quartile.
(on financial system efficiency), most of the significant estimates are between the 25th and 75th quartiles, with positive net effects and negative thresholds that are not within range.
The main outcome from Table 3 on linkages between financial activity and public credit registries is shown in Panel A (on banking system activity) and Panel B (on financial system activity). It is noteworthy that most of the significant estimates are between the 25th and 75th quartiles, with positive net effects and negative thresholds that are not within range.
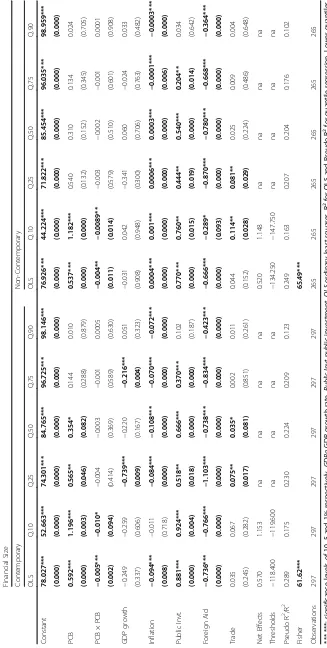
In Table 4 on the connections between financial size and public credit registries, most of the significant estimates are between the 25th and 75th quartiles, with positive net effects and negative thresholds that are not within range.
Most of the significant control variables have the expected signs. It is important to note that some of the signs may vary from one table to another, because the financial develop-ment variables are by definition inconsistent. The financial developdevelop-ment variable of Table 2 (financial efficiency) is the ratio of the financial development variable in Table 3 (finan-cial credit) to the finan(finan-cial development variable in Table 1 (finan(finan-cial deposits).
Financial development and private credit bureaus
Tables 5, 6, 7, and 8 respectively disclose results corresponding to financial depth, financial allocation efficiency, financial activity, and financial size. Irrespective of tables, the left-hand side (LHS) presents contemporary estimations whereas the right-hand side (RHS) presents non-contemporary estimations. Contrary to the findings in Tables 1, 2, 3 and 4 on public credit registries, the marginal, threshold, and net effects of private credit bureaus in Tables 5, 6, 7 and 8 are not clearly apparent. In order to examine why findings corresponding to private credit bureaus are not significant, we assess country-specific averages of information-sharing offices, which we disclosed in Appendix 4. From these country-specific averages, we can reasonably infer that the findings on private credit bureaus are not very significant because of issues in degrees of freedom. Hence, the concluding implications that follow are essentially based on findings connected to public credit registries.
Conclusion
The purpose of this study was to investigate how increases in information-sharing bureaus affect financial access. For this purpose, we employ contemporary and noncontemporary interactive quantile regressions in 53 African countries for the period 2004–2011. Information-sharing bureaus are proxied by public credit registries and private credit bur-eaus. Financial development dynamics associated with depth (at overall economic and finan-cial system levels), efficiency (at banking and finanfinan-cial system levels), activity (from banking and financial system perspectives), and size are used. The following findings were established. First, the incidence of increasing private credit bureaus is not very apparent on financial access, probably because private credit bureaus are still to be established in many countries. Second, an increase in public credit registries improves financial allocation efficiency and ac-tivity (or credit) between the 25th and 75th quartiles for the most part. This result is intui-tive, because for poorly developed financial systems, an increase in information-sharing bureaus may in some cases decrease the pace of development, whereas for more developed financial systems, information sharing may already have been taken into account.
and activity distributions are unlikely to benefit from enhanced financial allocation efficiency owing to an increase inpublic credit registries. While the absence of positive net effects in the top quantiles may be traced to diseconomies of scale in public credit registries, the ab-sence of positive net impacts in the bottom quantiles could be traceable to the fact that cer-tain levels of financial efficiency and activity are required before the benefits of an increase in public credit registries can be achieved in terms of increasing financial access.
On the relationship between established findings and the literature, two angles are ap-parent. On the one hand, the findings are broadly consistent with those of Singh et al. (2009), who found that African countries with information-sharing mechanisms for banks are associated with higher levels of financial development. The findings are also aligned with those of Galindo and Miller (2001) in the view that credit registries are more likely to enhance financial development compared with credit bureaus in less-developed coun-tries. On the other hand, our results appear not to be broadly in line with those of Love and Mylenko (2003), who argued that whereas the presence of private registries is associ-ated with a higher share of bank lending and lower constraints on finance, public regis-tries do not have a significant effect on financing constraints. Our results also do not align with those of Triki and Gajigo (2014), who concluded that private credit bureaus are more positively sensitive to finance access, compared with public credit registries. Asongu et al. (2016) found that information-sharing offices negatively affect financial access for the most part, while Asongu et al. (2017) concluded that financial development dynamics re-spond more positively to private credit bureaus relative to public credit registries.
There are three main shortcomings that merit emphasis. First, we have not reported quantile regression coefficients with which to substantiate the analysis in the study. Ac-cordingly, we adopted a minimalist approach in the interpretation of estimated coeffi-cients. The minimalist approach is based on the understanding that net effects are computed from corresponding significant estimated coefficients and policy inferences are based on net effects. The tables and regressions proliferate very rapidly, and corre-sponding combinations of“tests of equality of quantile regression coefficients” substan-tially increase the number of tables we have to produce. Second, measurement error can typically be worse in panel data models. Third, while we have used lagged values of the regressors in order to have some“bite”on endogeneity, there are more formal ap-proaches such as instrumentation with lagged values. This implies that the quantile re-gressions with contemporaneous regressors are even more likely to be affected by simultaneity bias. We have maintained both contemporary and non-contemporary re-gressions, because both are still affected by simultaneity bias.
Future studies can improve the extant literature by assessing how the established findings can be improved with information and communication technologies. More-over, investigating how countries at the top and bottom ends of the financial access dis-tributions can benefit from an increase in public credit registries is also worthwhile. A more robust quantile estimator with which to investigate these suggested lines of inquiry is proposed by Canay (2011). This estimator considers country-specific hetero-geneity that is ignored in the current analysis.
Endnotes 1
Table
8
Financial
Size
and
Private
Credit
Bureaus
(PCB)
Financial
Size
Contemporary
Non-Contemporary
OLS
Q.10
Q.25
Q.50
Q.75
Q.90
OLS
Q.10
Q.25
Q.50
Q.75
Q.90
Constant
78.027***
52.663***
74.301***
84.765***
96.725***
98.146***
76.926***
44.224***
71.822***
85.454***
96.035***
98.959***
(0.000)
(0.000)
(0.000)
(0.000)
(0.000)
(0.000)
(0.000)
(0.000)
(0.000)
(0.000)
(0.000)
(0.000)
PCB
0.592***
1.196***
0.565**
0.354*
0.144
0.010
0.537***
1.182***
0.540
0.310
0.134
0.024
(0.000)
(0.003)
(0.046)
(0.082)
(0.288)
(0.879)
(0.000)
(0.000)
(0.132)
(0.152)
(0.345)
(0.705)
PCB
×
PCB
−
0.005***
−
0.010*
−
0.004
−
0.003
−
0.001
0.0005
−
0.004**
−
0.0089**
−
0.003
−
0.002
−
0.001
0.0001
(0.002)
(0.094)
(0.414)
(0.369)
(0.589)
(0.630)
(0.011)
(0.014)
(0.579)
(0.510)
(0.601)
(0.908)
GDP
growth
−
0.249
−
0.259
−
0.739***
−
0.220
−
0.216***
0.051
−
0.031
0.042
−
0.341
0.060
−
0.024
0.033
(0.337)
(0.606)
(0.009)
(0.167)
(0.004)
(0.323)
(0.908)
(0.948)
(0.300)
(0.706)
(0.763)
(0.482)
Inflation
−
0.094***
−
0.011
−
0.084***
−
0.108***
−
0.070***
−
0.072***
0.0004***
0.001***
0.0006***
0.0003***
−
0.0001***
−
0.0003***
(0.008)
(0.718)
(0.000)
(0.000)
(0.000)
(0.000)
(0.000)
(0.000)
(0.000)
(0.000)
(0.006)
(0.000)
Public
Invt.
0.881***
0.924***
0.518**
0.666***
0.370***
0.102
0.770***
0.760**
0.444**
0.540***
0.204**
0.034
(0.000)
(0.004)
(0.018)
(0.000)
(0.000)
(0.187)
(0.000)
(0.015)
(0.019)
(0.000)
(0.014)
(0.642)
Foreign
Aid
−
0.736***
−
0.766***
−
1.103***
−
0.738***
−
0.834***
−
0.423***
−
0.666***
−
0.289*
−
0.870***
−
0.780***
−
0.668***
−
0.364***
(0.000)
(0.000)
(0.000)
(0.000)
(0.000)
(0.000)
(0.000)
(0.093)
(0.000)
(0.000)
(0.000)
(0.000)
Trade
0.035
0.067
0.075**
0.035*
0.002
0.011
0.044
0.114**
0.081**
0.025
0.009
0.004
(0.245)
(0.282)
(0.017)
(0.081)
(0.851)
(0.261)
(0.152)
(0.028)
(0.029)
(0.224)
(0.486)
(0.648)
Net
Effects
0.570
1.153
na
na
na
na
0.520
1.148
na
na
na
na
Thresholds
−
118.400
−
119.600
na
na
na
na
−
134.250
−
147.750
na
na
na
na
Pseudo
R
2/R
2
0.289
0.175
0.230
0.224
0.209
0.123
0.249
0.163
0.207
0.204
0.176
0.102
Fisher
61.62***
65.49***
Observations
297
297
297
297
297
297
265
265
265
265
265
265
*,**,***:
significance
levels
of
10,
5
and
1%
respectively.
GDPg
GDP
growth
rate,
Public
Invt
public
investment,
OLS
ordinary
least
squares.
R
2for
OLS
and
Pseudo
R
2for
quantile
regression.
Lower
quantiles
(e.g.,
Q
0.1)
signify
nations
where
financial
size
is
least.
na
not
applicable
because
corresponding
estimates
needed
for
computation
are
not
Appendix 1
Appendix 2
Table 9Summary statistics (2004–2011)
Variables Mean S.D Min. Max. Observations
Financial Development Economic Financial Depth (M2) 34.279 22.294 6.363 112.83 377 Financial System Depth (Fdgdp) 28.262 21.066 2.926 92.325 377 Banking System Efficiency (BcBd) 68.118 27.725 14.804 171.85 402 Financial System Efficiency (FcFd) 68.118 27.725 14.804 171.85 402 Banking System Activity (Pcrb) 72.722 35.884 22.200 252.88 377 Financial System Activity (Pcrbof) 21.571 24.154 0.010 149.77 379 Financial Size (Dbacba) 78.073 20.255 4.032 99.949 399 Information Asymmetry Public Credit registries (PCR) 2.155 5.812 0 49.8 381 Private Credit Bureaus (PCB) 4.223 13.734 0 64.8 380 Control Variables Economic Prosperity (GDPg) 4.996 4.556 −17.66 37.998 404
Inflation 7.801 4.720 0 43.011 357
Public Investment 74.778 1241.70 −8.974 24,411 387 Development Assistance 10.396 12.958 0.027 147.05 411 Trade Openness (Trade) 80.861 32.935 24.968 186.15 392
S.Dstandard deviation,Minminimum,Maxmaximum,M2money supply,Fdgdpfinancial deposits(liquid liabilities),BcBd bank credit on Bank deposits,FcFdfinancial credit on Financial deposits,Pcrbprivate domestic credit from deposit banks, Pcrbofprivate domestic credit from deposit banks and other financial institutions,Dbacbadeposit bank assets on central bank assets plus deposit bank assets,GDPgGDP growth
Table 10Correlation Analysis (Uniform sample size: 291)
Financial Development Dynamics
Info. Asymmetry
Other variables
Financial Depth
Financial Efficiency
Financial Activity
Fin. Size
M2 Fdgdp BcBd FcFd Prcb Pcrbof Dbacba PCR PCB GDPg Inflation PubIvt NODA Trade
1.000 0.970 0.094 0.103 0.821 0.629 0.398 0.416 0.147 −0.104 −0.080 0.055 −0.295 0.140 M2
1.000 0.130 0.220 0.886 0.754 0.452 0.409 0.303 −0.091 −0.063 0.070 −0.320 0.149 Fdgdp
1.000 0.859 0.490 0.495 0.243 0.154 0.303 −0.016 −0.144 −0.169 −0.133 −0.176 Bcbd
1.000 0.583 0.743 0.242 0.067 0.510 −0.056 −0.097 −0.149 −0.179 −0.189 FcFd
1.000 0.922 0.478 0.448 0.439 −0.092 −0.089 −0.055 −0.343 0.093 Pcrb
1.000 0.413 0.293 0.556 −0.088 −0.073 −0.057 −0.324 0.019 Pcrbof
1.000 0.249 0.343 −0.061 −0.142 0.198 −0.403 0.210 Dbacba
1.000 −0.140 −0.026 −0.081 0.068 −0.154 0.207 PCR
1.000 −0.101 −0.035 −0.047 −0.329 0.084 PCB
1.000 −0.169 0.129 0.122 0.037 GDPg
1.000 −0.081 −0.0004 −0.006 Inflation
1.000 0.059 0.130 PubIvt
1.000 −0.309 NODA
1.000 Trade
M2Money Supply,Fdgdpfinancial deposits(liquid liabilities),BcBdbank credit on bank deposits,FcFdfinancial credit on Financial
deposits,Pcrbprivate domestic credit from deposit banks
Pcrbofprivate domestic credit from deposit banks and other financial institutions,Dbacbadeposit bank assets on central bank
assets plus deposit bank assets,Infoinformation,PCRpublic credit Registries
PCBPrivate Credit Bureaus,GDPgGDP growth,Popgpopulation growth,PubIvtPublic Investment,NODANet Official Development
Appendix 3
Appendix 4
Table 11Definitions of variables
Variables Signs Definitions of variables Sources
Economic Financial Depth M2 Money Supply (% of GDP) World Bank (FDSD)
Financial System Depth Fdgdp Liquid Liabilities (% of GDP) World Bank (FDSD) Banking System Efficiency BcBd Bank credit on Bank deposits World Bank (FDSD) Financial System Efficiency FcFd Financial credit on Financial
deposits
World Bank (FDSD)
Banking System Activity Prcb Private domestic credit from deposit banks (% of GDP)
World Bank (FDSD)
Financial System Activity Prcbof Private domestic credit from financial institutions (% of GDP)
World Bank (FDSD)
Financial Size Dbacba Deposit bank assets on Central bank assets plus Deposit bank assets
World Bank (FDSD)
Information Asymmetry PCR Public credit registry coverage (% of adults)
World Bank (WDI)
PCB Private credit bureau coverage (% of adults)
World Bank (WDI)
Economic Prosperity GDPg GDP Growth (annual %) World Bank (WDI)
Inflation Infl Consumer Price Index (annual %) World Bank (WDI)
Public Investment PubIvt Gross Public Investment (% of GDP) World Bank (WDI) Development Assistance NODA Total Net Official Development
Assistance (% of GDP)
World Bank (WDI)
Trade openness Trade Imports plus Exports in commodities (% of GDP)
World Bank (WDI)
WDIWorld Bank Development Indicators,FDSDFinancial Development and Structure Database
Table 12Country-specific average values from information sharing bureaus
Public Credit Registries Private Credit Bureaus
1) Algeria 0.216 0 .000
2) Angola 2.412 0.000
3) Benin 8.037 0.000
4) Botswana 0 .000 48.150
5) Burkina Faso 1.750 0.000
6) Burundi 0.212 0.000
7) Cameroon 2.312 0.000
8) Cape Verde 17.042 0.000
9) Central African Republic 1.412 0.000
10) Chad 0.400 0.000
11) Comoros 0.000 0.000
12) Congo Democratic Republic 0.000 0.000
13) Congo Republic 3.400 0.000
14) Côte d’Ivoire 2.487 0.000
Acknowledgement
The authors are indebted to the editor and reviewers for their constructive comments.
Funding
The authors are self-funded and have received no funding for this manuscript.
Table 12Country-specific average values from information sharing bureaus(Continued)
16) Egypt 2.062 5.271
17) Equatorial Guinea 2.566 0.000
18) Eritrea 0.000 0.000
19) Ethiopia 0.087 0.000
20) Gabon 12.716 0.000
21) The Gambia 0.000 0.000
22) Ghana 0.000 1.700
23) Guinea 0.000 0.000
24) Guinea-Bissau 1.000 0.000
25) Kenya 0.000 1.750
26) Lesotho 0.000 0.000
27) Liberia 0.280 0.000
28) Libya na na
29) Madagascar 0.162 0.000
30) Malawi 0.000 0.000
31) Mali 2.812 0.000
32) Mauritania 0.187 0.000
33) Mauritius 27.866 0.000
34) Morocco 1.200 4.812
35) Mozambique 1.637 0.000
36) Namibia 0.000 50.362
37) Niger 0.825 0.000
38) Nigeria 0.025 0.000
39) Rwanda 0.425 0.275
40) Sao Tome & Principe 0.000 0.000
41) Senegal 3.787 0.000
42) Seychelles 0.000 0.000
43) Sierra Leone 0.000 0.000
44) Somalia na na
45) South Africa 0.000 57.312
46) Sudan 0.000 0.000
47) Swaziland 0.000 40.216
48) Tanzania 0.000 0.000
49) Togo 2.550 0.000
50) Tunisia 15.975 0.000
51) Uganda 0.000 0.512
52) Zambia 0.000 0.975
53) Zimbabwe 0.000 0.000
Authors’contributions
SAA wrote the manuscript while JCN participated in the revision of the manuscript. Both authors read and approved the final manuscript.
Competing interests
The authors declare that they have no competing interests.
Ethics approval and consent to participate
This article does not contain any studies with human participants or animals.
Publisher’s Note
Springer Nature remains neutral with regard to jurisdictional claims in published maps and institutional affiliations.
Author details 1
African Governance and Development Institute, P.O. Box 8413, Yaoundé, Cameroon.2Department of Economics, University of South Africa, P. O. Box 392, Pretoria UNISA 0003, South Africa.3School of Economics, Finance and
Accounting, Faculty of Business and Law, Coventry University, Priory Street, Coventry CV1 5FB, UK.
Received: 15 November 2016 Accepted: 15 May 2017
References
Acharya V, Amihud Y, Litov L (2011) Creditor rights and corporate risk taking. J Financ Econ 102(1):150–166
Aggarwal R, Demirgüç-Kunt A, Peria MSM (2011) Do remittances promote financial development? J Dev Econ 96(2):
255–264
Ashraf Q, Galor O (2013) The out of Africa hypothesis, human genetic diversity, and comparative economic
development. Am Econ Rev 103(1):1–46
Asongu SA (2012) Government quality determinants of stock market performance in African countries. J Afr Bus 13(2):
183–199
Asongu SA (2013) Fighting consumer price inflation in Africa: what do dynamics in money, credit, efficiency and size
tell us? Journal of Financial Economic Policy 5(1):39–60
Asongu SA (2014a) Correcting inflation with financial dynamic fundamentals: which adjustments matter in Africa? J Afr
Bus 15(1):64–73
Asongu SA (2014b) Financial development dynamic thresholds of financial globalisation: evidence from Africa. J Econ
Stud 41(2):166–195
Asongu SA (2015) Finance and growth: new evidence from meta-analysis. Manag Financ 41(6):615–639
Asongu SA, Anyanwu JC, Tchamyou SV (2017) Technology-driven information sharing and conditional financial development in Africa. Inf Technol Dev. doi:10.1080/02681102.2017.1311833
Asongu SA, De Moor L (2017) Financial globalisation dynamic thresholds for financial development: evidence from
Africa. Eur J Dev Res 29(1):192–212
Asongu SA, Nwachukwu JC (2017) The synergy of financial sector development and information sharing in financial
access: propositions and empirical evidence. Res Int Bus Financ 40(April):242–258
Asongu SA, Nwachukwu J, Tchamyou SV (2016) Information asymmetry and financial development dynamics in Africa.
Review of Development Finance 6(2):126–138
Barth J, Lin C, Lin P, Song F (2009) Corruption in bank lending to firms: cross-country micro evidence on the beneficial
role of competition and information sharing. J Financ Econ 99(3):361–368
Batuo ME (2015) The role of telecommunications infrastructure in the regional economic growth of Africa. The Journal
of Development Areas 49(1):313–330
Billger SM, Goel RK (2009) Do existing corruption levels matter in controlling corruption? Cross-country quantile
regression estimates. J Dev Econ 90(2):299–305
Boyd JH, Levine R, Smith BD (2001) The impact of inflation on financial sector performance. J Monet Econ 47(2):221–
248
Brown M, Jappelli T, Pagano M (2009) Information sharing and credit: firm-level evidence from transition countries. J
Financ Intermed 18(2):151–172
Canay IA (2011) A simple approach to quantile regression for panel data. Econ J 14(3):368–386
Claessens S, Klapper L (2005) Bankruptcy around the world: explanations of its relative use. American Law and
Economics Review 7(1):253–283
Claus I, Grimes A (2003) Asymmetric Information, Financial Intermediation and the Monetary Transmission Mechanism: A Critical Review, NZ Treasury Working Paper No. 13/019. New Zealand Treasury, Wellington
Coccorese P (2012) Information sharing, market competition and antitrust intervention: a lesson from the Italian
insurance sector. Appl Econ 44(3):351–359
Cummins J (2000) Language, power and pedagogy: bilingual children in the crossfire. Multilingual Matters, Clevedon
Diamond DW (1984) Financial intermediation and delegated monitoring. Review of Economic Studies 51(3):393–414
Diamond DW, Dybvig PH (1983) Bank runs, deposit insurance, and liquidity. J Polit Econ 91(3):401–449
Djankov S, McLeish C, Shleifer A (2007) Private credit in 129 countries. J Financ Econ 84(2):299–329
Do QT, Levchenko AA (2004) Trade and financial development, World Bank Policy Research Working Paper No. 3347. International Monetary Fund, Washington
Efobi U, Osabuohein SE, Oluwatobi S (2015) One Dollar, One Bank Account: Remittance and Bank Breath in Nigeria. J
El Ghoul S, Guedhami O, Cho S-S, Suh J (2012) Creditor Rights and Capital Structure: Evidence from International Data, University of Seoul, Korea
Fouda OJP (2009) The excess liquidity of banks in franc zone: how to explain the paradox in the CEMAC. Revue
Africaine de l’Integration 3(2):1–56
Galindo A, Miller M (2001) Can credit registries reduce credit constraints? Empirical evidence on the role of credit registries in firm investment decisions. Inter-American Development Bank Working Paper, Washington
Greenwood J, Jovanovic B (1990) Financial development, growth and distribution of income. J Polit Econ 98(5):1076–
1107
Henderson DJ, Papageorgiou C, Parmeter CF (2013) Who benefits from financial development? New methods, new
evidence. Eur Econ Rev 63(October):47–67
Houston JF, Lin C, Lin P, Ma Y (2010) Creditor rights, information sharing and bank risk taking. J Financ Econ 96(3):485–
512
Huang Y (2011) Private Investment and financial development in a globalised world, Empirical. Economics, 41(1):43-56.
Huang Y (2005) What determines financial development? , Bristol University,Discussion PaperNo. 05/580, Bristol
Huang Y, Temple JRW (2005) Does external trade promote financial development? CEPR Discussion Paper No. 5150, London
Huybens E, Smith BD (1999) Inflation, financial markets and long-run real activity. J Monet Econ 43(2):283–315
IFAD (2011)“enabling poor rural people to overcome poverty”, conference proceedings, conference on new directions
for smallholder agriculture 24–25 January 2011. Rome, IFAD HQ
https://www.ifad.org/documents/10180/6b9784c3-73cc-4064-9673-44c4c9c9a9be. Accessed 13 May 2016.
Ivashina V (2009) Asymmetric information effects on loan spreads. J Financ Econ 92(2):300–319
Jaffee D, Levonian M (2001) Structure of banking systems in developed and transition economies. European Financial
Management 7(2):161–181
Jaffee DM, Russell T (1976) Imperfect information, uncertainty, and credit rationing. Q J Econ 90(4):651–666
Jappelli T, Pagano M (2002) Information sharing, lending and default: cross-country evidence. J Bank Financ 26(10):
2017–2045
Leland HE, Pyle DH (1977) Informational asymmetries, financial structure, and financial intermediation. J Financ 32(2):
371–387
Koenker R, Hallock FK (2001) Quantile regression. J Econ Perspect 15(4):143–156
Levine R (1997) Financial development and economic growth: views and agenda. J Econ Lit 35(2):688–726
Love I, Mylenko N (2003) Credit reporting and financing constraints, World Bank Policy Research Working Paper Series No. 3142. The World Bank, Washington
Mlachila M, Tapsoba R, Tapsoba SJA (2014) A Quality of Growth Index for Developing Countries: A Proposal, IMF Working Paper No. 14/172, International Monetary Fund, Washington
Mylenko N (2008) Developing Credit Reporting in Africa: Opportunities and Challenges, African Finance for the 21st Century, High Level Seminar Organized by the IMF Institute in collaboration with the Joint Africa Institute, Tunis,
Tunisia, March 4–5, 2008. http://www.imf.org/external/np/seminars/eng/2008/afrfin/pdf/mylenko.pdf. Accessed 18
May 2016.
Nyasha S, Odhiambo NM (2015a) Do banks and stock market spur economic growth? Kenya’s experience. International
Journal of Sustainable Economy 7(1):54–65
Nyasha S, Odhiambo NM (2015b) The impact of banks and stock market development on economic growth in South
Africa: an ARDL-bounds testing approach. Contemporary Economics 9(1):93–108
Okada K, Samreth S (2012) The effect of foreign aid on corruption: a quantile regression approach. Econ Lett 115(2):
240–243
Osabuohien ES, Efobi ER (2013) Africa’s money in Africa. South African Journal of Economics 81(2):292–306
Owusu EL, Odhiambo NM (2014) Stock market development and economic growth in Ghana: an ARDL-bounds testing
approach. Appl Econ Lett 21(4):229–234
Roller L-H, Waverman L (2001) Telecommunications infrastructure and economic development: a simultaneous
approach. Am Econ Rev 91(4):909–923
Saint Paul G (1992) Technological choice, financial markets and economic development. Eur Econ Rev 36(4):763–781
Saxegaard M (2006) Excess liquidity and effectiveness of monetary policy: evidence from sub-Saharan Africa, IMF Working Paper No. 06/115. International Monetary Fund, Washington
Singh RJ, Kpodar K, Ghura D (2009) Financial deepening in the CFA zone: the role of institutions, IMF Working Paper no. 09/113. Washington
Stiglitz JE, Weiss A (1981) Credit rationing in markets with imperfect information. Am Econ Rev 71(3):393–410
Tanjung YS, Marciano D, Bartle J (2010) Asymmetry Information and Diversification Effect on Loan Pricing in Asia Pacific
Region 2006–2010. Faculty of Business & Economics, University of Surabaya, Surabaya
Tchamyou VS, Asongu SA (2017) Information sharing and financial sector development in Africa. J Afr Bus 18(1):24–49
Triki T, Gajigo O (2014) Credit bureaus and registries and access to finance: new evidence from 42 African countries.
Journal of African Development 16(2):73–101
Williamson SD (1986) Costly monitoring, financial intermediation, and equilibrium credit rationing. J Monet Econ 18(2):