Singaporean Journal of BuSineSS
Economics, and managEmEnt studiEs (sJBEm)
DOI: 10.12816/0048421NBL NLB
Research Article
Research Article
OPTIMAL BUFFER ALLOCATION IN A JOB-SHOP SYSTEM USING A
SIMULATION MODEL AND WITH THE HELP OF TAGUCHI METHOD
Mohsen Manoochehri (first author)
Department of Industrial Engineering, Kerman branch, Islamic Azad University, kerman, Iran Marjan Mohammadjafari (corresponding author)
Department of Industrial Engineering, Kerman branch, Islamic Azad University, kerman, Iran
Abstract
Buffers are integral components of any production system that fits the type of system, its size can vary. Buffers marked changes in parameters such as time and cost of a system's output. Given that the components of each system can be successful in his career. This study defined a problem and it will create a simulation model of a Job-shop system to using the Taguchi method, optimum size of the buffer (Optimal buffer allocation), and to assign them. The purpose of this type of allocation, reducing the total production time and thus to minimize the total cost of production. In this Job-shop system, each workshop includes a number of production machines. In problem-solving research related to the rate of arrival of parts to machines in the workplace and machine downtime random so we solve the problem in random conditions. The results of this experiment were checked. We can evaluate and use the results of this and similar problems compared with traditional measures, we know much more successful.
Keywords: Optimal buffer allocation, Job-shop system, Simulation model, Taguchi method
Introduction and Literature Review
Experts believe that attention to detail all the components in the industry can increase productivity and reduce the negative factors in the production. Each unit contains a lot of elements that in this article we will examine the one that buffer .However, this buffer can be one of the component parts of each plant was not paying much attention to it but little can facilitate large role in optimizing time and production costs have. Here are the important and influential role in some production systems, we allocate buffer. High quality and low cost are the most important factors in competitive manufacturing industries. Quality control satisfies both of them since it brings the effects of fewer rework labor hours, less material wastes and high quality of final goods.
To accomplish such quality control, high-performance production lines have quality inspection machines that inspect the quality of parts and then reject defective parts. Each part is required to be processed on each machine during a fixed amount of time called processing time. Due to the machine failure, blocking and starvation phenomena are possible at all stages of the production line. Two types of machine failures, referred to as operation-dependent failure and time-dependent failure have been considered (Buzacott & Shanthikumar, 1993; Dallery & Gershwin, 1992; Gershwin, 1994). The former cannot occur when the upstream buffer is empty while the latter can occur even if the upstream buffer is empty. An important decision in the design of flow-line production system is the amount of buffer space to install between successive stages. This decision is of great practical importance to such industries as bottling, packaging, assembling and automotive production. If the buffer space installed between two machines is insufficient there will not be enough time to repair the machines before the entire flow-line fails. Too much buffer space will incur a cost that in higher than necessary. Given a required availability, secondary criteria have to be used we order to
These costs can be a function of the size of the installed buffer or a function of the average usage of the buffer. In both cases cost limits the amount of buffer space that can be installed. The optimal buffer allocation is an important research issue in the design of homogeneous and non-homogeneous lines. It consist of devising an allocation plan for distributing a certain amount of buffer space among the intermediate buffers of a production line. The efficiency of the system can be them improved by providing optimally the sizes of the buffers between the machines. An expression is derived for the buffer capacity which minimizes the sum of the delay, inventory carrying, and storage facility costs. In order to improve the efficiency of such production systems, in-process inventory is normally introduced as a decoupling agent to smooth and balance the flow of semi-finished parts between successive production operations.
Soo Han and Jo Park (2002), is formulated the buffer allocation problem to find the minimum capacity of buffers to achieve a desired throughput. Using the proposed approximation method, the penalty function method, and the steepest descent method, we suggest an analytic method for the buffer allocation problem. Finally suggested methods are validated by computer simulations. Sorensen and Janssens (2001) proposed the use of a hyper-exponential distribution as a better approximation. We also examine in which cases the values of uptimes and downtimes are exponentially distributed and in which those are not. Nahas and Ait-Kadi and Nourelfath, (2006), is used a variant of a local search meta-heuristic, called the degraded ceiling approach, for solving the BAP. This approach was recently introduced in Burke et al. (2002), where it has been tested on real-world university examination timetabling problems and the experiments have confirmed its high effectiveness. We address the buffer allocation problem in the design of production lines that comprise a sequence of machines in series. Mack (1986), a simple optimal buffer capacity model is developed for series production lines where the service time variability is described by the normal distribution and the buffers are allocated the same capacity. Practical data obtained from an actual production line manufacturing electric ceiling fans are used to illustrate the theory. Numerical comparisons are made with the results obtained using computer simulation. It is shown that the simple model developed in this paper provides a close approximation to the optimal buffer capacity for the production line considered.
The problem statement
Generally, buffers, temporary storage areas are adjacent to each machine that performs integrated manufacturing operations and prefabricated components for their manufacturing operations are complementary. As has been said here allocating buffers is one component of the production parameters. In this study, the objective is to optimize the allocation of buffers should be made to minimize the total production and thus minimize the cost of products. In this study, we used a new process, to identify the optimal allocation of buffers and the allocation of capacity is specified in each of the buffers, the total time taken to minimize production. In this process, the computer simulation to simulate the atmosphere of the job-shop system, we use it to get some information at the time of production of the products we use. We should note that in this study, the rate of entry into any machine parts and machine failure rate is random. So to get them at the time of manufacture and import of Taguchi method in the software Minitab, and the end result is a series of activities that the optimal allocation of the buffer is reached. It should be noted that in this paper, the optimal allocation of buffers in the Job-Shop production examined.
job-shop system
The layout of the job-shop, the necessary machinery for the production of products in sectors are separate. In this arrangement, the piece must pass certain processing pathways. In this system, the maximum flexibility possible for products intended to be able to respond and factory order is varied. The objectives of the job-shop production system, accumulated production of various sizes small. However, to achieve the goal of a multi-purpose machine that can perform multiple operations are used to but in many cases the plant production system is inefficient. For example, 95% of the production time spent waiting for processing and the remaining 5% is divided between the installation pieces on the machine and process it. The results of such arrangement, half-made parts inventory is between workstations. Another problem is the system that fragment workshop for processing workshops are sometimes required in all directions so managers have to transfer plant for the economy of the process is the accumulation of the desired product. By doing this, each piece has to wait for the completion of its parts to stay. The increase in product development time, increased semi-finished parts inventory and production costs and lower production rate as well. The advantages and disadvantages of job-shop production system are as follows:
Benefits
Reduction on machinery investment
Stop the machine does not stop production.
Changes in product design has little effect Machines
Flexible in order to produce new products
Flexibility in production planning.
Open the plant less on the impact of the deployment plan.
Skill workers due to work with a variety of machines increases.
Disadvantages
Planning and control is difficult.
The increase in unit cost
Transport due to increased instability in the production process.
The large space is required.
Inventory increases in process.
Because of the variety of products and the preparation of this machinery and delays resulting from it, not high-performance machines. (Planning and scheduling of batch systems, more complex than other systems. This complexity is due to several factors such as the number of product types, volume of materials or goods under production at a given time, product, multiple stages of production, the type of production capacities and etc.)
Note: Given the shortcomings in the production system workshop can be seen, it was decided that the role of recovery and the correct allocation of buffers in the system is studied.
Solution methodology
The evaluation methodology
In this study, we intend to use the simulation model and also using Taguchi method to allocate buffer optimized for individual plants. As already mentioned, the main objective of this paper is to determine the capacity of buffers to minimize the sum of the production potential in terms of the random arrival rate components for cars, random time each piece of equipment is also likely to fail .Finally, the mechanism we have to go where the total production time for each segment (Make Span), this is due to at least minimize production costs .In that case, according to the details can be argued that the main goal of industrial engineering is the optimization of production costs, we have achieved. This study, like other papers based on certain assumptions. Spent some time and also conduct random allocation process in the job-shop production of these assumptions are. However it is safe to say that the results of the paper ahead for all production systems ranging from the manufacture or production process used, But the author of this article assumes that the system has been manufacturing plant as well as the possible conditions; As mentioned earlier, such as machine failure probability and random arrival rate components and the atmosphere reigns in this study. To solve the problem, we use computer simulation software and also Mini Tab.
The problem goal approach
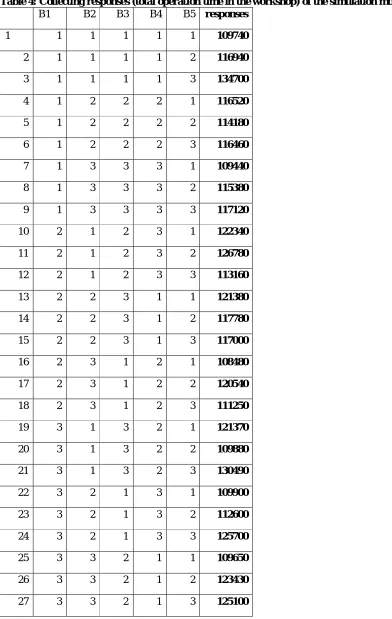
As has been said here, the main purpose of this is to minimize the total cost of production time is minimized to help achieve this goal through the efficient allocation of buffer capacity, we follow. In the previous section we discussed the allocation of buffers using the simulation model and the Taguchi method in the Minitab program is embedded, will do. Firstly, we must enter the data into these programs to collect and analyze what are. Our data consisted of the random arrival of parts, time to work on the piece, and the accident rate is machine downtime. Based on a real case or unrealistic, simulation model of the production process are made. The aforementioned data to the simulation model, we entered. After running the program, the response time of each experiment as a whole will be given to us. This process can take a few more times for the program to respond to most of the programs have to be. We enter these answers in Minitab for the implementation of the Taguchi method and obtaining optimal allocation.
Numerical example
number of workshops in the system to assume that with this specification: In this workshop to us on three different product, the product 1, product 2 and product 3 operation is performed. The number of pre-made products that are entered are random. This means that 25% of type 1, type 2 and 50% to 25% of the products are also of type 3. The time between arrival of goods as well as normal with an average of 10 minutes and a standard deviation of 5 minutes is considered. In this line of 5 machines manufactured there, all of which has a capacity buffers are different products. The processing time for each product on each machine in minutes are given in (Table 1):
Table 1: processing time for each product on each machine
Product 1 15 - 8 - 16
Product 2 - 32 - 11 -
Product 3 3 7 7 - -
Also product sequence of operations is as follows
Product 1: M M M
Product 2: M M
Product 3: M M M
Required information about the issue that is mentioned in the relevant workshop. Now step by step we must enter these data into our programs for solving the problem.
Simulation
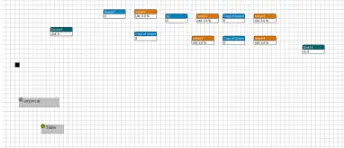
In this section we should simulate the plant site. The simulation model contains all the machinery of production, stops, the input and output, storage, time, parameters and the buffer of each production machines. The software used in this simulation is Ed. First simulation model of the plant, machinery and buffers prepared (Figure 1).
Figure 1: The simulation model of the site workshops
Taguchi method
Here is a table (Table 2) of the number of buffers as factors, the buffer level (Level including high level, middle level and low level are determined by management and after the operations in software, After the operations in software, each level of the buffer specified and the number corresponding to that level, as the allocation of optimal size for the buffer intended to be considered) and the capacity of each level will be announced by management, are:
Table 2: Entrance to the Taguchi method includes the number of factors and number of levels
Buffer 1 20 40 60
Buffer 2 15 30 45
Buffer 3 7 14 21
Buffer 4 10 20 30
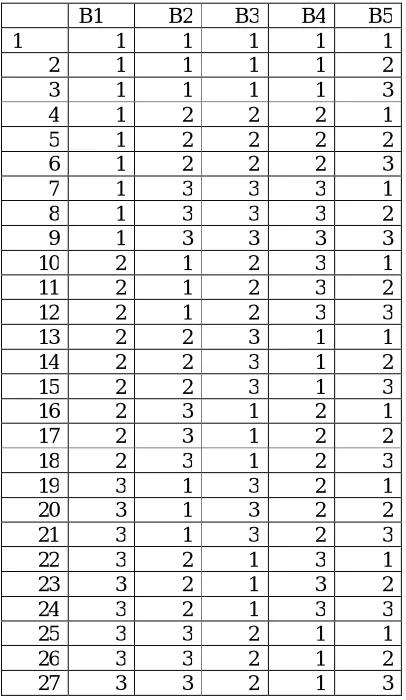
As specified in the table above, the number of factors (the number of buffers) is considered the number 5 and the number of levels (as management has determined) number 3 has been considered that's mean we have 3 levels of high level, middle level and have a low level. This information can be used as input to the Taguchi method. After entering this information Taguchi method, an experiment consisted of 27 scenarios designed (By entering the number 3 as level and number 5 as factor, Taguchi method determines L27 automatically as an experiment with 27 scenarios. The experiment is as follows:
Table 3: Initial experiment on the Taguchi method
B5 B4 B3 B2 B1 1 1 1 1 1 1 2 1 1 1 1 2 3 1 1 1 1 3 1 2 2 2 1 4 2 2 2 2 1 5 3 2 2 2 1 6 1 3 3 3 1 7 2 3 3 3 1 8 3 3 3 3 1 9 1 3 2 1 2 10 2 3 2 1 2 11 3 3 2 1 2 12 1 1 3 2 2 13 2 1 3 2 2 14 3 1 3 2 2 15 1 2 1 3 2 16 2 2 1 3 2 17 3 2 1 3 2 18 1 2 3 1 3 19 2 2 3 1 3 20 3 2 3 1 3 21 1 3 1 2 3 22 2 3 1 2 3 23 3 3 1 2 3 24 1 1 2 3 3 25 2 1 2 3 3 26 3 1 2 3 3 27
Result
After analyzing these values in the Taguchi method, the optimal allocations that are identified, But before the final results, we need to talk about how the responses gathered from the simulation model are analyzed.
How to analyze responses
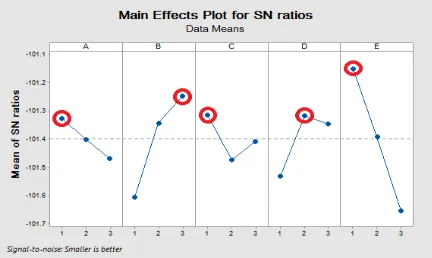
It is important to say that the resulting tables, formulas and relations act according to signal to noise ratio (Signal To Noise) for short (S/N) can be expressed, are known. Since the objective of minimizing the time and consequently minimizing the cost, so it should be at the tables for this component (smaller-is-better), the tables are quite logical. The Signal to Noise (S/N) ratio is calculated for each factor level combination. The formula for the smaller-is-better S/N ratio using base 10 log is: / =−10∗log(∑( )/ ). Where Y= responses for the given factor level combination and n= number of responses in the factor level combination. Below, analysis and data values after the implementation of Taguchi shows:
Figure 2: The final implementation of information Taguchi method
The final result
Taguchi method based on the ultimate goal of acts means it considers the highest or lowest point or exceptions in each table based on the ultimate goal. As the purpose of the notice, we are looking to minimize the total time and total cost of production. To achieve this goal we and tables to choose the kind of test, the lower the better option to chose. This means that the time and cost less, is better for us. Here are the optimal allocation of buffers and the size of each of them so that the objectives possible. We should note that in the selection of input parameters (buffer size at issue) should be the highest among lower is better, our choice. As mentioned, the Taguchi method because the method is based on the ultimate goal. Where at the bottom have been chosen in the optimum size of buffers that if they as much as the optimal buffer to the total production and total production costs are minimized and, in fact, the goal is to achieve it. The following figure shows the optimum solution is: (Figure 3)
Figure 3: Determining the Optimum (optimal allocation buffer size based on the issue) 3
2 1 -101.1
-101.2
-101.3
-101.4
-101.5
-101.6
-101.7
3 2
1 1 2 3 1 2 3 1 2 3
A
M
e
a
n
o
f
S
N
r
a
ti
o
s
B C D E
Main Effects Plot for SN ratios
Data Means
Signal-to-noise: Smaller is better
3 2 1 122000
121000
120000
119000
118000
117000
116000
115000
114000
3 2
1 1 2 3 1 2 3 1 2 3
A
M
e
a
n
o
f
M
e
a
n
s
B C D E
Main Effects Plot for Means
Discussion and Conclusion
In this method, the method of allocating buffers is innovative in the testing and validation of the rubber factory was obvious Kerman it was found that using this method greatly reduced the total time to produce an effect that reduces the time of production, reduce the total cost of production as well. Most of the factories and workshops dot use a good method for allocating buffers. In fact, either randomly, or using experimental or computational capacity specified by the value of the work was done on machines but using such methods to manage factories is clear and indisputable that using of this method is logical, scientific, efficient and effective and avoids indiscriminate waste of time and money largely. Therefore, it is suggested that the method used to allocate buffers to optimize capacity. Say it is not unpleasant to use these methods in the design, manufacture, Can be replaced in the near future and some other handy ways to get high accuracy. These studies are presented, suitable for study and pass the test methods and errors in setting up industries in the future. In this paper, an optimal buffer was studied. With using a simulation model to the workshop site and also using Taguchi method and its process, more efficient and more cost-effective way to generate the optimal allocation of buffers machines which reduces the total production time and also reduces the total cost of production.
Reference
Burke, E.K., Bykov, Y., Newall, J.P., Petrovic, S., 2002. A new local search approach with execution time as an input parameter. Computer Science Technical Report No. NOTTCS-TR-2002-3. School of Computer Science and Information Technology. University of Nottingham.
Buzacott, J. A., & Shanthikumar, J. G. (1993). Stochastic models of manufacturing systems, Englewood Cliffs, NJ: Prentice-Hall.
Dallery, Y., & Gershwin, S.B. (1992). Manufacturing flow line systems; a review of models and analytical results. Queuing Systems, 12, 3-92.
Gershwin, S. B. (1994). Manufacturing system engineering, Englewood Cliffs, NJ: Prentice-Hall.
K. L. MAK. The allocation of interstage buffer storage capacity in production lines. Department Of Industrial Engineering, University Of Hong Kong, Pokfulam Road, Hong Kong, (1986) 163-169
Kenneth Sorensen*,Gerrit K. Janssens. Buffer allocation and required availability in a transfer line with unreliable machines. Production Economics 74 (2001) 163-173
Man-Soo Han a,*, Dong-Jo Park b1. Optimal buffer allocation of serial production lines with quality inspection machines. Computers & Industrial Engineering 42 (2002) 75-89