R E S E A R C H A R T I C L E
Open Access
Shell neurons of the master circadian clock
coordinate the phase of tissue clocks
throughout the brain and body
Jennifer A. Evans
1*, Ting-Chung Suen
2, Ben L. Callif
1, Andrew S. Mitchell
2, Oscar Castanon-Cervantes
2,
Kimberly M. Baker
1, Ian Kloehn
1, Kenkichi Baba
3, Brett J. W. Teubner
4,6, J. Christopher Ehlen
2, Ketema N. Paul
2,
Timothy J. Bartness
4, Gianluca Tosini
3, Tanya Leise
5and Alec J. Davidson
2Abstract
Background:Daily rhythms in mammals are programmed by a master clock in the suprachiasmatic nucleus (SCN). The SCN contains two main compartments (shell and core), but the role of each region in system-level coordination remains ill defined. Herein, we use a functional assay to investigate how downstream tissues interpret region-specific outputs by usingin vivoexposure to long day photoperiods to temporally dissociate the SCN. We then analyze resulting changes in the rhythms of clocks located throughout the brain and body to examine whether they maintain phase synchrony with the SCN shell or core.
Results:Nearly all of the 17 tissues examined in the brain and body maintain phase synchrony with the SCN shell, but not the SCN core, which indicates that downstream oscillators are set by cues controlled specifically by the SCN shell. Interestingly, we also found that SCN dissociation diminished the amplitude of rhythms in core clock gene and protein expression in brain tissues by 50–75 %, which suggests that light-driven changes in the functional organization of the SCN markedly influence the strength of rhythms in downstream tissues.
Conclusions:Overall, our results reveal that body clocks receive time-of-day cues specifically from the SCN shell, which may be an adaptive design principle that serves to maintain system-level phase relationships in a changing environment. Further, we demonstrate that lighting conditions alter the amplitude of the molecular clock in downstream tissues, which uncovers a new form of plasticity that may contribute to seasonal changes in physiology and behavior.
Keywords:Circadian, Coupling, Peripheral and central oscillators, Photoperiod, Suprachiasmatic nucleus
Background
Daily rhythms in mammalian behavior and physiology are programmed by a system of biological clocks that os-cillate with a period of approximately 24 h [1]. At the cellular level, self-sustained circadian rhythms are gener-ated by interconnected feedback loops involving the transcription of clock genes (e.g.,Period1 (Per1),Period2
(Per2), Cryptochrome1 (Cry1), Cryptochrome2 (Cry2)) whose protein products inhibit their own transcription
once every 24 h [2]. Although this molecular clock exists in nearly every cell of the body, a central pacemaker within the suprachiasmatic nucleus (SCN) is needed to coordinate these clocks with one another and the solar day [1]. The SCN synchronizes downstream tissues through a variety of pathways, including direct synaptic connections, release of humoral factors, and via control of overt rhythms such as locomotion, body temperature, feeding, and hormone release [3]. This complexity in SCN outputs has made it difficult to precisely map the functional connections between the SCN and down-stream tissues. Deeper understanding of how the SCN communicates with downstream tissues would provide critical insight into the functional organization of the
* Correspondence:[email protected]
1
Department of Biomedical Sciences, Marquette University, Milwaukee, WI 53233, USA
Full list of author information is available at the end of the article
circadian system, which may reveal novel ways to ma-nipulate temporal coordination in the circadian system and alleviate the adverse health consequences of shift work and jetlag [4].
With regards to system-level organization, a funda-mental question that remains unresolved is whether time-of-day cues are transmitted by a specific subclass of SCN neuron. The SCN is a network of neural oscillators organized into two functionally distinct compartments (i.e., SCN shell and core) distinguished by connectivity, gene expression, neuropeptide expression, and responses to environmental stimuli [5–10]. Although species differ-ences exist, the SCN shell contains a dense population of arginine vasopressin (AVP) neurons, and the SCN core contains vasoactive intestinal polypeptide (VIP) neurons [11]. Neuroanatomical studies indicate that both AVP and VIP neurons form connections with proximal targets in the brain, often projecting to the same structure [5, 12]. These neuroanatomical studies provide insight into SCN efferent pathways, but it remains unclear if the outputs from SCN shell and core are redundant or functionally distinct. Because the SCN can communicate with target tissues through non-synaptic mechanisms (e.g., paracrine signaling, control of overt rhythms) [3], addressing the import of outputs from different SCN regions requires a functional assay that can detect the downstream conse-quences of cues transmitted by each SCN compartment. Herein, we develop a functional assay to identify the SCN compartment that provides time-of-day cues to down-stream tissues, based on previous work demonstrating that a clock maintains a stable phase relationship with its syn-chronizing stimulus. Extending this logic to the entraining influence of the SCN, we can infer a functional relation-ship when a given tissue maintains phase synchrony with a specific SCN compartment. The strength of this ap-proach is that it does not require direct synaptic connec-tions, nor does it require that tissues express rhythms that are in phase with the SCN.
One difficulty in applying this approach is that neu-rons in the SCN shell and core typically display synchro-nized rhythms. Because regional activity patterns usually overlap in time, this limits the ability to distinguish how downstream tissues interpret outputs from a specific SCN compartment. However, rhythms of SCN shell and core neurons can be dissociated by manipulating environ-mental lighting conditions in vivo. For example, chronic exposure to constant light (LL)“splits”the activity rhythm in nocturnal rodents. LL-induced split rhythms at the be-havioral level correspond to anti-phase rhythms between the left and right SCN [13–16], as well as anti-phase rhythms between the shell and core within each SCN lobe [13, 16]. In LL-induced split hamsters, it has been shown that the lateral subparaventricular zone tracks the phase of the SCN shell and the paraventricular nucleus tracks
the phase of the SCN core, which suggests that outputs from these SCN regions are functionally distinct and tis-sue specific [13]. However, the SCN region providing cues to these downstream tissues remains unclear because LL does not produce a clear dissociation of SCN shell and core, instead causing the SCN core to cycle in phase with the contralateral shell (i.e., in the opposite SCN lobe) [13–15]. Further, becausec-foswas used as an index of connectivity, the relevance of these region-specific changes for molecular clock function in downstream tissues is not clear. Complementary studies using non-24 h light:dark cycles to dissociate the SCN shell and core of the rat also indicate that both SCN compart-ments contribute to the expression of overt rhythms, with the phase of rapid eye movement sleep and some hormonal rhythms dictated specifically by the SCN shell [17–20]. However, changes in the function of down-stream clocks have yet to be examined under non-24 h light:dark cycles or LL. Collectively, these studies suggest that the SCN shell and core differ in their contribution to system-level coordination, but it remains an open ques-tion whether SCN outputs derive from a specific compart-ment or whether each compartcompart-ment provides cues in a tissue-specific or functionally-distinct manner.
In addition to the exotic lighting conditions described above, the SCN can be dissociated using more naturalis-tic environmental manipulations such as simulated sea-sonal changes in day length [21–23]. We have recently demonstrated thatin vivoexposure to long, summer-like day lengths causes the SCN shell and core to cycle out of phase in mice [21]. Use of seasonal changes in day length presents a unique opportunity to examine the functional role of outputs from each SCN compartment because the system is stably entrained and under strict experimental control. Furthermore, there is less variabil-ity among individual mice in the timing and pattern of network reorganization relative to other dissociation pro-tocols. Finally, because SCN dissociation through photo-periodic manipulations temporally reorganizes the SCN core and shell, but not the left and right SCN, this ap-proach can be used to more precisely establish the neuro-anatomical source of the cues. Herein, we take advantage of SCN dissociation under long day lengths to investigate the functional role of SCN shell and core outputs. After inducing SCN dissociation with long day lengths, we assessed whether molecular rhythms in tissues throughout the brain and body maintain phase synchrony with the SCN shell or the SCN core. Our results indicate that SCN compartments differ in their functional contribution to system-level coordination, with the SCN shell setting the phase of nearly all of the 17 tissues studied here. These data demonstrate that the function of outputs from differ-ent SCN compartmdiffer-ents is highly specialized, which serves to maintain timing among clocks in the brain and body in
a changing environment. Although the SCN core does not appear to regulate the phase of downstream oscillators, we find evidence that the integrated function of the SCN is critically important for maintaining the amplitude of the molecular clock in downstream tissues. Photoperiodic modulation of molecular rhythm amplitude in down-stream tissues reveals a new form of plasticity that may encode time of year at the level of the local clock.
Results
Long day lengths dissociate rhythms in the SCN shell and core
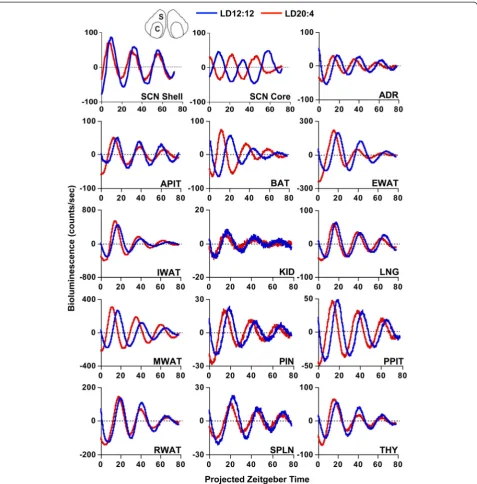
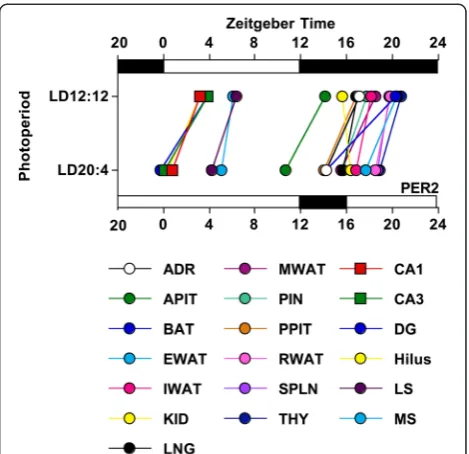
Male PERIOD2::LUCIFERASE (PER2::LUC) mice [24] were housed under a standard lighting condition with 12 h of light (LD12:12) or a long day with 20 h of light (LD20:4), which produced re-entrainment of both loco-motor activity and sleep rhythms (Additional file 1: Figure S1). To confirm photoperiodic reorganization of the SCN network, SCN slices were collected for real-time bioluminescence imaging of PER2::LUC rhythms. Consistent with our previous work [21], LD20:4 tem-porally reorganized the SCN network through region-specific shifts in the phase of PER2::LUC rhythms (Figs. 1 and 2). Relative to LD12:12,in vivoexposure to LD20:4 caused both the SCN shell and core to display an earlier time of peak PER2::LUC expression on the first cycle in vitro. The SCN shell and core, however, displayed differential responses (Fig. 1), with the SCN shell advancing by approximately 3.5 h and the SCN core shifting by approximately 12 h. These results con-firm that in vivo exposure to long day lengths dissoci-ates the SCN shell and core, which can be used to assess the functional role of region-specific communication with downstream tissues.
The SCN shell sets the phase of peripheral clocks
PER2::LUC rhythms were evident in a wide range of cen-tral and peripheral structures, with tissue-specific differ-ences in peak time, period, amplitude, and damping rate
in vitro(Figs. 1 and 2, Additional file 1: Table S1). First we assessed whether the phase of PER2::LUC rhythms
in vitrois a faithful reflection ofin vivophase by collect-ing tissues from LD12:12 mice either 2 h before lights-off or 2 h after lights-on. By assessing the effect of dissections performed at different times of day, this test determines whether the phase of PER2::LUC rhythms
in vitro is reset by the culture procedure itself [25]. The majority of peripheral tissues were unaffected by dissec-tion, with only 5/18 affected by the timing of the culture procedure (Additional file 1: Figure S2). The only per-ipheral tissues completely reset by dissection were the three ocular tissues (cornea, retina, retinal pigmented epithelium), although the liver and esophagus were also shifted (Additional file 1: Figure S2). For tissues not reset
by dissection, dissection did not produce systematic ef-fects on other rhythmic parameters, including amplitude and period of PER2::LUC rhythms (Additional file 1: Table S1). The relatively low number of tissues affected by the culture procedure supports the use ofex vivo real-time bioluminescence luminometry to assessin vivo photo-periodic changes in peripheral clock function. Further, these results demonstrate the utility of PER2::LUC assays to investigate a wide variety of peripheral tissues that may be of interest in circadian and non-circadian research.
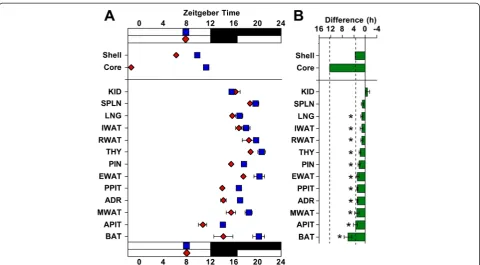
To test for photoperiodic changes in downstream os-cillators, tissues not reset by dissection were collected from LD12:12 and LD20:4 mice 2–4 h before lights-off (Figs. 1 and 2, Additional file 1: Table S2). After expos-ure to LD20:4, nearly all peripheral tissues exhibited a 2–4 h advance in the time of peak PER2::LUC, which was similar in magnitude to the 3 h shift displayed by the SCN shell (Figs. 1 and 2). In contrast, none of the peripheral tissues displayed a large 12 h advance like that displayed by the SCN core (Figs. 1 and 2), suggest-ing that this specific SCN compartment does not set the phase of these tissues. The consistency of these results is highlighted by the variety of systems examined here, including numerous endocrine glands (adrenal gland, anterior pituitary, pineal gland, posterior pituitary, and thymus) and several different adipose depots (epididymal white adipose, mesenteric white adipose, and brown adi-pose). Overall, this pattern of results demonstrates that peripheral tissues maintain phase synchrony with the SCN shell, which indicates that they receive time-of-day cues from this specific SCN compartment.
Because overt behavior and molecular rhythms in some peripheral tissues can be influenced directly by light [26–30], light exposure under LD20:4 may deter-mine the phase of peripheral tissues. To test whether photoperiodic changes were due to light-induced masking, mice were released from LD12:12 or LD20:4 into constant darkness for 1 day before collection of peripheral tissues (adrenal, epididymal white adipose tissue, and spleen). This acute release into constant darkness was designed to eliminate the masking effects of light, but maintain SCN dissociation and prevent the resynchronization of SCN shell and core that occurs with longer exposure to con-stant darkness [21]. Consistent with this previous work, the SCN shell and core remained dissociated after 1 day in constant darkness (Fig. 3). Further, peripheral tissues con-tinued to exhibit a phase advance similar in magnitude to that displayed by the SCN shell (Fig. 3), which indicates that light is not directly driving photoperiodic changes in the phase of peripheral clocks.
The SCN shell sets the phase of central clocks
tissue-specific differences in the density of innervation from each region [5]. This raises the possibility that central clocks may be distinct from peripheral tissues in that they receive time-of-day cues from each SCN region in a tissue-specific manner. Because PER2::LUC rhythms in central tissues can be reset by the culture procedure [31, 32], more trad-itional techniques were required to address this question.
Thus, to test whether photoperiodic reorganization of the SCN influences the phase of central tissues in a manner similar to peripheral tissues, brains were collected from LD12:12 and LD20:4 mice at eight time-points spanning the circadian cycle. Cerebellum, hippocampus, olfactory bulb, and septum were collected for qRT-PCR analyses of Per2 rhythms. To assess photoperiodic changes,
Fig. 1Representative time series of bioluminescence rhythms measuredin vitrofrom tissues collected from PER2::LUC mice housed under LD12:12 or LD20:4. Time series are de-trended and corrected for the Zeitgeber Time (ZT) of dissection. SCN shell and SCN core regions used for analyses are illustrated at the top of the figure (S and C, respectively). ADR, Adrenal gland; APIT, Anterior pituitary gland; BAT, Brown adipose tissue; EWAT, Epididymal white adipose tissue; IWAT, Inguinal white adipose tissue; KID, Kidney; LNG, Lung; MWAT, Mesenteric white adipose tissue; PIN, Pineal gland; PPIT, Posterior pituitary gland; RWAT, Retroperitoneal white adipose tissue; SPLN, Spleen; THY, Thymus
cosinor analyses were used to evaluate whether daily fluctuations in Per2 expression were rhythmic and to determine the center of gravity of clock gene expression patterns (Additional file 1: Table S3). Under LD12:12, each tissue displayed significantPer2rhythms with peak expression during the dark phase (Fig. 4, Additional
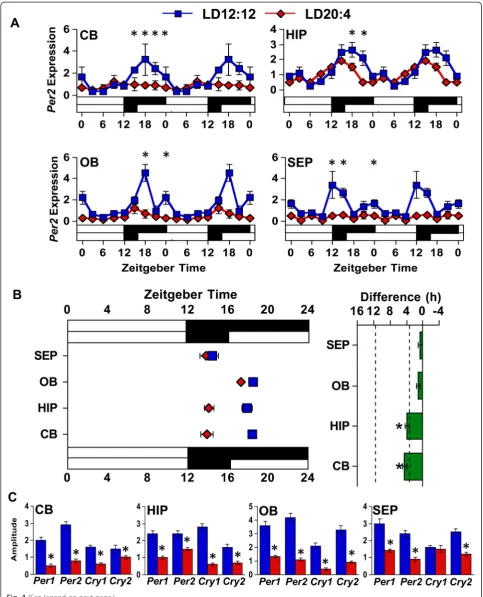
file 1: Table S3). Under LD20:4, none of these central tissues shifted in a manner similar to the SCN core. Ra-ther, the cerebellum and hippocampus displayed a 3 h advance of the Per2 rhythm, while the olfactory bulb and septum did not shift significantly. Overall, these re-sults support the conclusion that downstream oscillators
Fig. 3Photoperiodic changes in the phase of peripheral tissues persist after release into constant darkness.aTime of peak bioluminescence (± SEM) on the first cyclein vitrodisplayed by SCN regions and peripheral tissues collected after release into constant darkness from LD12:12 (blue symbols) or LD20:4 (red symbols).n= 3/photoperiod for SCN,n= 6/photoperiod for peripheral tissues.bSummary plots of photoperiod-induced changes in the phase of peripheral tissues after release into constant darkness. Tissues are ordered by the magnitude of the difference in peak time. Dashed vertical lines indicate the magnitude of the shift displayed by the SCN shell and SCN core after release into constant darkness. *Significant phase shift different from 0 h, one samplet-test,P<0.05
Fig. 4(See legend on next page.)
are reset by time-of-day cues controlled specifically by the SCN shell, which is similar to conclusions based on PER2::LUC rhythms in peripheral tissues.
SCN dissociation diminishes rhythms in central clocks
Unexpectedly, SCN reorganization was found to be asso-ciated with a 50–75 % reduction in the amplitude of
Per2 rhythms in central targets (Fig. 4, Additional file 1: Table S3). This large reduction in Per2 amplitude was evident in each of the four tissues, although its magnitude varied by tissue (Fig. 4a, Additional file 1: Table S3). Inter-estingly, Per2 amplitude was consistently reduced across all four tissues regardless of whether the tissue displayed a significant 3 h shift (i.e., hippocampus, cerebellum) or no shift (i.e., septum, olfactory bulb). For each tissue, similar results were obtained for the core clock genesPer1,Cry1, andCry2, with the rhythms in each likewise blunted in a nearly universal manner (Fig. 4c, Additional file 1: Figure S3 and Additional file 1: Table S3). Thus, long day lengths that dissociate the SCN network markedly reduce the amplitude of core clock gene rhythms in four distinct cen-tral brain structures.
Although highly consistent across tissues, the reduced amplitude could reflect that subregions of each tissue shifted in different directions. To test whether decreased
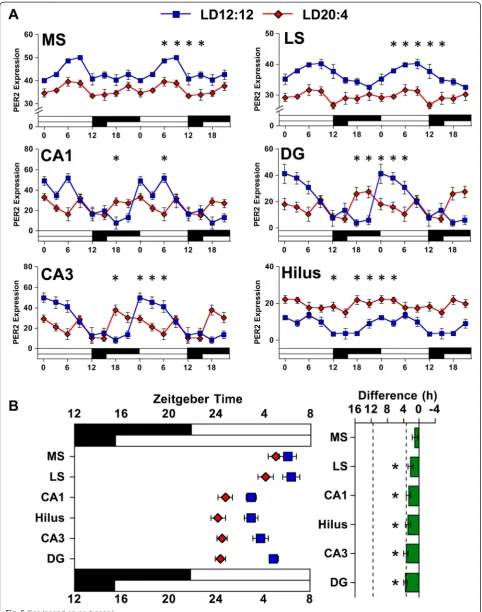
Per2 amplitude reflected differential responses at the microcircuit level, PER2 rhythms were analyzed in the hippocampus and septum using immunohistochemistry (Additional file 1: Figure S4, and Figure S5). Consistent with our Per2 results, PER2 expression was rhythmic under LD12:12 in each tissue and subregion examined (Fig. 5, Additional file 1: Table S4). Overall, changes in the phase and amplitude of PER2 expression under LD20:4 were consistent with our Per2 results for both the septum and hippocampus. Under LD20:4, both the lateral and medial subdivisions of the septum displayed an arrhythmic pattern of PER2 expression with a large decrease in amplitude (Fig. 5, Additional file 1: Table S4). In the hippocampus, LD20:4 advanced the time of peak PER2 expression by 3–6 h in each of the four subregions examined, and the amplitude of PER2 rhythms was
decreased consistently, with the magnitude of this de-crease dependent on subregion (Fig. 5, Additional file 1: Table S4). Thus, we observed that substructures within each tissue shifted in the same direction, shifted by a similar amount, and displayed a marked reduction in amplitude. Collectively, these data indicate that the reduc-tion in amplitude under LD20:4 does not reflect differen-tial responses at the microcircuit level, but instead a consistent decrease in amplitude that is evident across tissues and subregions at both the transcriptional and translational level.
SCN dissociation diminishes shell output
The marked reduction in the amplitude of rhythms in downstream tissues may indicate that there are function-ally important outputs from both SCN compartments, with the SCN shell setting the phase of downstream tis-sues and the SCN core influencing amplitude. On the other hand, these results may reflect that the amplitude of rhythms in the SCN shell have been diminished by long day lengths, which would not require direct com-munication from the SCN core to downstream tissues. To distinguish between these two hypotheses, we tested whether LD20:4 decreased the amplitude of rhythms in the SCN shell using immunohistochemistry (Additional file 1: Figure S6, and Figure S7). Consistent with previ-ous work [21] and the PER2::LUC imaging data de-scribed above, PER2 rhythms in the SCN shell and core were similarly phased under LD12:12 but adopted differ-ent peak times under LD20:4 (Fig. 6, Additional file 1: Table S4, see also [21]). Despite the change in phase re-lationship, LD20:4 did not decrease the amplitude of PER2 rhythms in either the SCN shell or SCN core (Fig. 6, Additional file 1: Table S4). To test changes in the amplitude of outputs from the SCN shell, we next analyzed rhythms in AVP protein expression (Additional file 1: Figure S7), which is a major output of the SCN shell [33]. Consistent with previous work, AVP expres-sion in the SCN was rhythmic under LD12:12 (Fig. 6, Additional file 1: Table S4). In contrast, AVP expression was not rhythmic under LD20:4, with a 50 % reduction
(See figure on previous page.)
Fig. 4The phase and amplitude of clock gene rhythms in central tissues is influenced by photoperiod.aDouble-plotted rhythms inPer2mRNA expression were measured with qRT-PCR for the cerebellum (CB), hippocampus (HIP), olfactory bulb (OB), and septum (SEP) under LD12:12 (blue symbols) and LD20:4 (red symbols). White and black bars on the abscissa represent lighting conditions.n= 3/time-point/photoperiod. *LD12:12 versus LD20:4, LS Means Contrasts,P<0.006. Cosinor analyses of Per2 rhythms are shown in Additional file 1: Table S3.bSummary plots of photoperiod-induced changes in the phase ofPer2rhythms in central tissues. Tissues are ordered by the magnitude of the difference in peak time. Dashed vertical lines indicate the magnitude of the shift displayed by the SCN shell and SCN corein vivo, as detected with PER2 immunohistochemistry (c.f., Additional file 1: Table S4). *Significant phase shift different from 0 h, one samplet-test,P<0.05.cAmplitude of core clock gene expression is reduced in all four tissues. *Student’st-test,P<0.05. Clock gene rhythms for all four tissues are illustrated in
Fig. 5(See legend on next page.)
in amplitude of expression due to higher expression dur-ing daytime and lower expression durdur-ing nighttime, rela-tive to LD12:12 (Fig. 6, Additional file 1: Table S4). This suggests that outputs from the SCN shell are attenuated under long day photoperiods, with light-driven changes in the functional organization of the SCN producing a decrease in the amplitude of AVP rhythms. Given the
import of this SCN shell output, this may provide a par-simonious explanation for diminished amplitude of clock gene/protein rhythms in downstream tissues.
Discussion
The SCN is important for coordinating downstream tis-sues in the circadian system so that they are synchro-nized to one another and the environment. Herein, we have used in vivo lighting conditions to differentially shift the SCN shell and core to assess the functional role of region-specific outputs to peripheral and central tis-sues. Overall, our findings demonstrate that downstream tissues maintain phase synchrony with the SCN shell, but not the SCN core. Additionally, we found that light-driven reorganization of the SCN network produced a striking decrease in the amplitude of clock gene/protein rhythms in central brain tissues. These data support a model where the SCN shell coordinates phase at the sys-tem level, but yet the integrated function of the SCN net-work is necessary for maintaining high amplitude rhythms in downstream tissues. Further, this study reveals that photoperiod can modulate the amplitude of molecular rhythms in local clocks of non-SCN tissues, which is a new form of circadian plasticity that may contribute to seasonal changes in physiology and behavior.
It has been known for some time that the SCN sets the phase of downstream tissues and that both of its main compartments can influence the properties of overt rhythms [34]. Previous neuroanatomical work in different rodent species suggested that the SCN shell and core pro-ject to both common and distinct targets [5, 13, 17, 35], but the relevance of regional projections for downstream clock function remained unclear. The current study repre-sents the most comprehensive attack on this issue to date by examining how SCN dissociation changes the molecu-lar clock of downstream tissues. Nearly all of the tissues examined here maintained phase synchrony with the SCN shell and not the SCN core. Additionally, we find that the correspondence between the phase of the SCN shell and peripheral tissues was maintained after release into con-stant darkness, which suggests that light is not directly masking the phase of peripheral tissues. We further attempted to evaluate the potential role of light exposure and overt rhythms by investigating re-entrainment of locomotor and sleep rhythms under LD20:4 (Additional
(See figure on previous page.)
Fig. 5The phase and amplitude of PER2 rhythms in central tissues is influenced by photoperiod.aDouble-plotted rhythms in PER2 expression were measured with immunohistochemistry for the subdivisions of the septum [medial septum (MS), lateral septum (LS)] and hippocampus (CA1, CA3, Dentate Gyrus, Hilus) under LD12:12 (blue symbols) and LD20:4 (red symbols). White and black bars on the abscissa represent lighting conditions.n= 4–6/time-point/photoperiod. * LD12:12 versus LD20:4, LS Means Contrasts,P<0.006. Cosinor analyses of PER2 rhythms are shown in Additional file 1: Table S4.bSummary plots of photoperiodic changes in the phase of central tissues. Tissues are ordered by the magnitude of the difference in peak time. Dashed vertical lines indicate the magnitude of the shift displayed by the SCN shell and SCN corein vivo, as detected with PER2 immunohistochemistry (c.f., Additional file 1: Table S4). * Significant phase difference, one samplet-test,P<0.05
Fig. 6The amplitude of AVP expression in the SCN is decreased by long day photoperiods. Double-plotted rhythms of PER2 and AVP expression measured in the SCN with immunohistochemistry. White and black bars on the abscissa represent lighting conditions.
file 1: Figure S1). These two specific rhythms displayed small to negligible shifts, similar to three tissues that failed to display a significant phase shift under LD20:4 (i.e., the kidney, the spleen, and the olfactory bulb). Thus, the phase of these three specific tissues may be masked by light or influenced by overt rhythms that do not shift under LD20:4. However, the vast majority of tissues shift to a degree that suggests they receive time-of-day cues provided by the SCN shell. Although we have sampled a wide range of tissues and systems, not all peripheral and central tissues were examined, and thus it remains pos-sible that the SCN core sets the phase of clocks not included here. This caveat aside, this study supports a model emphasizing the role of the SCN shell in transmit-ting time-of-day cues to the wider circadian system [33].
The mechanisms underlying the regulation of phase by the SCN shell may involve direct synaptic connections, release of humoral signals, and indirect control via other tissues or overt rhythms [3]. Herein, we have taken the first steps towards evaluating potential resetting signals from the SCN shell by examining photoperiodic changes in AVP expression, which is a major SCN output [33]. Because we find that AVP expression is arrhythmic under long days, this suggests that downstream tissues are not reset by AVP specifically, but by other signals produced by the SCN shell that remain rhythmic [36–38]. Although it is possible an arrhythmic AVP output could serve as a re-setting signal in the presence of rhythmic responses in downstream tissues [39, 40], it is unlikely that all 17 tis-sues studied here are reset by one common signal given evidence that different target systems rely on different SCN signaling pathways, including from synaptic connec-tions [41–43], humoral factors [44, 45], and indirect control via overt rhythms [29]. Furthermore, retrograde tract tracing studies conducted in the rat indicate that downstream tissues receive inputs from both AVP and non-AVP neurons in the SCN shell [46]. While the specific output mechanisms that set the phase of periph-eral tissues remain unclear, the current results serve to focus attention on signals provided by SCN neurons in the shell compartment.
Unexpectedly, we found that exposure to long day photoperiods also produced a striking decrease in the amplitude of clock gene and protein expression in sev-eral distinct brain structures, which was sufficient to abolish the rhythm in some of these tissues. Given the 3 h temporal resolution of the current analyses and the consistency of these results, it is highly unlikely that the decreased amplitude is due to a“missed”peak or trough. Additionally, the brain tissues examined here do not re-ceive retinal innervation [47], which suggests that the decrease in amplitude is not a direct response to longer light exposure. Further, previous work suggests that rhythms in Per2/PER2 expression in peripheral tissues
are specifically regulated by systemic cues controlled by the SCN [29, 48, 49]. We find that reduced amplitude was not attributable to desynchrony at the microcircuit level, although it remains possible that cells within each region were desynchronized under long day lengths. Future work employing bioluminescence imaging of these brain structures may be able to resolve this, al-though use of this technology may be difficult given that neural tissues can be reset by the dissection procedure itself [31, 32].
Consistent with the decreased amplitude of core clock gene/protein expression in central tissues, we find that the daily rhythm in AVP expression in the SCN shell was diminished under long day lengths. Because AVP serves as both an output itself and regulator of other SCN outputs, such as prokineticin2 [37], this may indi-cate that the overall strength of outputs from the SCN shell are compromised under long day lengths. This has important implications because it indicates that the ampli-tude of overt rhythms may be modulated by targeting the SCN shell specifically. Further, the correspondence be-tween the loss of AVP rhythms under LD20:4 and the re-duced amplitude of core clock gene/protein rhythms in downstream tissues may reflect an important role for AVP in modulating the amplitude of the molecular clock in downstream tissues. Consistent with this, previous work indicates that AVP can regulate the amplitude of overt rhythms, including the expression of corticosterone, sleep, and melatonin [37, 50–52]. Considering these changes occur in a variety of overt rhythms, it remains possible that photoperiodic modulation of amplitude is more wide-spread than detected here. For example, changes in the amplitude of PER2::LUC rhythms may have been occluded by the effects of tissue collection, although dissection-induced effects on amplitude were not evident in 12/13 of the tissues retained in our analyses.
Thus, amplitude suppression in central structures is associated with reduced amplitude of AVP expression in the SCN, which prompts the question: What might cause the decrease in this output signal? We propose that this reflects the light-driven change in the relative phase of the SCN core, which during an integrated state provides cues to amplify rhythmic outputs from the SCN shell [53]. Thus, according to this model, the in-ternal misalignment of the SCN network is the ultimate cause of reduced amplitude in downstream clocks. Con-sistent with this hypothesis, recent work using a forced desynchrony model in rats demonstrates that SCN dissociation decreases the daily peak in luteinizing hor-mone and corticosterone secretion [17, 19] and alters the waveform of daily melatonin release [20]. Based on these previous results and our current data, we propose that light-driven SCN dissociation produces a widespread reduction in amplitude that is not specific to hormonal
rhythms. Our current results suggest that this reduction in amplitude reflects a decrease in the strength of SCN shell outputs caused by the change in the functional organization of the SCN network. Within the context of this model, the SCN core need not directly innervate downstream tissues, although it remains possible that the SCN core provides cues that directly modulate the ampli-tude of downstream tissues. Because it is clear that SCN core neurons do indeed form connections with other structures in the brain [5, 13, 35, 54], further work is warranted to investigate the functional relevance of these outputs. Regardless, the current observation that lighting conditions modulate amplitude in downstream tissues re-veals a new form of molecular plasticity that may serve to encode day length and contribute to seasonal changes in physiology and behavior.
Conclusions
The current study suggests that there is a general reliance on the SCN shell for setting the phase of downstream tissues, which may be an adaptive design feature critical for maintaining system-level temporal organization in a changing environment. Using the current results as an in-dication, the specialization of the SCN shell in providing time-of-day cues would appear to conserve system-level phase relationships during seasonal changes in day length (Fig. 7). A division of labor among SCN compartments may be of particular importance given findings that the spatiotemporal organization of the SCN network can be markedly altered by both acute and chronic changes in en-vironmental conditions (present results, [21, 55]). Overall, downstream clocks were highly consistent in the direction of phase shifts displayed under long day lengths; however, differences in the magnitude of these phase shifts did alter some phase relationships across and within tissues (Fig. 7). In contrast to the modest changes in phase relationships observed here, an abrupt shift in the light:dark cycle (i.e., simulated jetlag) produces large changes in oscillator phase relationships at the system-level due to differ-ences in the rate and direction of resetting across tissues [55–57]. Given recent work linking depression to al-tered phase relationships at the system and molecular level [58], a critical question for future study is whether the photoperiodic modulation observed in the current study alters behavioral and physiological indices known to vary with season and circadian disruption [4].
Methods Mice
Homozygous PER2::LUC knockin mice [24], backcrossed onto a C57BL/6 background, were bred and raised under a 24 h light:dark (LD) cycle with 12 h of light and 12 h of darkness (LD12:12, lights off: 1800 EST). Throughout life, ambient temperature was maintained at 22 ± 2 °C,
and animals had ad libitum access to water and food (Purina Rodent Chow #5001, St Louis, MO). At wean-ing, animals were group-housed in cages without run-ning wheels. At 6–10 weeks of age, male PER2::LUC mice were transferred to individual wheel-running cages housed within light- and temperature-controlled second-ary enclosures. For at least 12 weeks, mice were either maintained under LD12:12 or re-entrained to a long day photoperiod with 20 h of light (LD20:4, lights off: 2200 EST). All procedures were conducted according to the NIH Guide for the Care and Use of Animals and were approved by the Institutional Animal Care and Use Committees at the Morehouse School of Medicine and Marquette University.
PER2::LUC tissue culture
Male PER2::LUC mice were sacrificed with CO2
asphyxi-ation and cervical dislocasphyxi-ation prior to tissue collection at specific times relative to lights-off (defined as Zeitgeber Time 12, ZT12). Brains were removed, bathed in chilled Hank’s solution, and sectioned in the coronal plane with
a motorized vibratome. SCN slices (150μm) were imaged using a Stanford Photonics MEGA-10Z cooled intensified CCD camera housed in a light-tight environmental cham-ber set at 36.5 °C, as described previously [21]. Other tis-sues were excised, placed in chilled Hank’s solution, and trimmed by hand with a scalpel, as described previously [55]. A wide variety of tissues was selected to represent a cross-section of multiple physiological systems, with as-sessment of adrenal gland, anterior pituitary gland, poster-ior pituitary gland, pineal gland, lung, spleen, thymus, esophagus, liver, kidney, retina, retinal pigmented epithe-lium, cornea, brown adipose tissue, epididymal white adi-pose tissue, inguinal white adiadi-pose tissue, mesenteric white adipose tissue, and retroperitoneal white adipose tis-sue. All tissues were cultured on a membrane with 1.2 mL of air-buffered medium containing 0.1 mM beetle luciferin (Gold Biotechnologies). Bioluminescence rhythms from peripheral tissues were measured with a luminometer (Actimetrics Inc., Evanston, IL) housed inside a light-tight incubator set at 36 °C. For bioluminescence imaging ana-lyses, SCN shell and core regions were identified visually based on spatial location (Fig. 1), as in [21]. PER2::LUC time series were corrected for the ZT12 start time of the recording and de-trended by subtracting the 24 h running average from the raw data. PER2::LUC time series were analyzed with Lumicycle analysis software (Actimetrics) by fitting a damped sine wave to the first three cycles
in vitro, starting with the time of the first troughin vitro. Peak time was recorded as the first peak within this re-cording interval and expressed relative to projected ZT12 in vitro, as in previous studies [55–57]. This method has been established for inferringin vivophase, but similar results were obtained when the time of peak PER2::LUC expression in vitro was directly compared across photoperiodic conditions.
qRT-PCR
Male PER2::LUC mice from each photoperiod were eu-thanized with CO2asphyxiation and cervical dislocation
at time-points spanning the circadian cycle (n= 3/time-point/photoperiod). Brains were immediately post fixed in 4 % paraformaldehyde for 6 h, then cryoprotected in 20 % sucrose solution for 3–5 days. A variety of central brain structures were retained to represent a cross-section of different behavioral systems, with assessment of the cerebellum, hippocampus, olfactory bulb, and septum. Brains were blocked and one lobe of the olfac-tory bulb and cerebellum was retained before brains were sectioned on a cryostat (100μm). Hippocampus and septum were excised by hand with a scalpel from three consecutive slices. Tissue samples were homogenized and digested overnight at 55 °C in a lysis buffer supplemented with 50 μL of proteinase K (20 mg/mL). Total RNA was purified with TRIzol, mixed with chloroform, and then
centrifuged for 15 min. RNA was precipitated with 70 % isopropanol and centrifuged for 15 min. Resulting pellets were washed with 75 % ethanol and centrifuged for 15 min. Pellets were then dried and re-suspended with 10 μL RNAase DNAase free water. RNA concentration and purity was quantified with 260/280 nm absorbance ra-tios measured with a Nanodrop 1000 spectrophotometer (Thermo Scientific, Wilmington, DE). First strand cDNA synthesis was achieved with reverse transcription using a high-capacity cDNA reverse transcription kit (Applied Biosystems, Cat#4368813). RNA and cDNA was stored at −20 °C prior to processing. qRT-PCR assays were performed with a BioRad or Applied Biosystem thermo-cycler using Sso Advanced SYBR Green Supermix (Cat#172-5261). The thermal cycling program was set for 95 °C for 15 s, 60 °C for 30 s, and 72 °C for 45 s for 40 cycles, followed by melt curve analysis using a 0.5 °C 5 s stepwise gradient from 60 °C to 95 °C. Sequences of the primers used are listed in Additional file 1: Table S5.
P0was selected as the reference gene based on its stable expression across the circadian cycle relative to four other commonly used reference genes (βactin,18S, cyclophilin,
gapdh). Cycle thresholds were analyzed with the ΔΔCT method by normalizing to the average of gene expression under LD12:12 collapsed across time-points.
Immunohistochemistry
Brains were collected as described above and sectioned on a cryostat (40 μm). Slices containing SCN and non-SCN structures were retained and stored in cryoprotect-ant at−20 °C. Free-floating slices were washed in 0.1 M phosphate-buffered solution (PBS) and then incubated for 48 h at 4 °C with primary antibodies (Non-SCN: PER2, 1:1 K, Millipore Cat#AB2202, SCN: PER2, 1:2 K and AVP, 1:4 K, Bachem Cat#T-5048). Slices were then washed in PBS before 2 h incubation at room temperature with secondary antibodies (Jackson ImmunoResearch, Alexa Flour 488 Cat#711-545-152, Alexa Flour 594 Cat#706-585-148; both at 1:500). Slices were then washed with PBS and mounted using Promount anti-fade gold reagent (Cat#P36935). Fluorescence images were obtained with a Zeiss LMS 700 confocal microscope using sequen-tial scanning and identical settings for all samples. Z stack images were compressed and analyzed with ImageJ. Specific signal intensity was quantified by subtracting background intensity values. For SCN analyses, PER2 ex-pression in SCN shell and core regions was quantified by identifying neurons with and without AVP immunoreac-tivity (ir), respectively (also see [21]). PER2-ir and AVP-ir cells were identified with ImageJ software using the Analyze Particles method. Briefly, the ten consecutive z-stack images were summed, the summed image was duplicated, converted to 8-bit grayscale, and then thre-sholded to produce a binary image (Additional file 1:
Figure S6, and S7). After watershed separation, cell-like re-gions of interest were identified in each image using size and circularity criteria to distinguish cells from fibers and non-specific staining. Average signal intensity value for the cell-like regions of interest was then calculated by referencing the original, thresholded image. For non-SCN structures with moderate to low cell density (Medial Septum, Lateral Septum, Hilus), average signal intensity was calculated for PER2-ir neurons using the Analyze Particles method. For non-SCN structures with higher cell density (CA1, CA3, dentate gyrus), PER2-ir was calculated using the average intensity values of five larger regions of interest manually positioned onto the relevant structure for each image.
Behavioral analyses
Wheel running rhythms were monitored and analyzed with the Clocklab data collection and analysis system (Actimetrics) as previously described [21]. Briefly, activ-ity onset was identified as the first bin above a threshold of five counts that was preceded by at least 2 h of in-activity and followed by at least 1 h of in-activity likewise above threshold. Wheel-running revolutions were calcu-lated during the light and dark phases for the last week of entrainment using the average activity profile for each mouse. Sleep data were collected and analyzed as previ-ously outlined [59]. Briefly, electroencephalogram (EEG) and electromyography (EMG) electrodes (frontal elec-trode: 1.5 mm anterior to bregma, 1.5 mm lateral to cen-tral suture; interparietal electrodes: 2.5 mm posterior to bregma, ±1.5 mm lateral to central suture) were im-planted in anesthetized mice using a prefabricated head mount (integrated 2 × 3 pin grid array, Pinnacle Tech-nologies, Lawrence, KS). EMG activity was monitored using stainless-steel Teflon-coated wires that were inserted bilaterally into the nuchal muscle. Two weeks after surgery, mice were moved to the sleep-recording chamber and connected to a lightweight tether attached to a low-resistance commutator mounted over the cage (Pinnacle Technologies, Lawrence, KS). EEG and EMG recording began following one-week acclimation to the tether and recording chamber. Data were collected with Sirenia Acquisition software (Pinnacle Technologies). EEG signals were low-pass filtered with a 40-Hz cutoff and collected continuously at a sampling rate of 400 Hz. All recordings were scored offline in 10 s epochs. All waveforms were classified by a trained observer using both EEG leads and EMG into the following states: Wake (low voltage, high frequency EEG; high amplitude EMG), non-rapid eye movement sleep (high voltage, mixed frequency EEG; low amplitude EMG), or rapid eye movement sleep (low voltage EEG with a predomin-ance of theta activity (6–10 Hz); very low amplitude EMG). EEG epochs determined to have an artifact
(interference caused by scratching, movement, eating, or drinking) were excluded from analyses.
Statistical analyses
Statistical analyses were performed with JMP software (SAS Institute, Cary, NC) or CircWave software [60]. Data are represented in figures and tables as mean ± SEM.
Additional file
Additional file 1: Table S1.PER2::LUC rhythms from non-SCN tissues collected at two different times of day. Table S2. Photoperiodic changes in PER2::LUC rhythms of non-SCN tissues. Table S3. Photoperiodic changes in clock gene rhythms of non-SCN tissues. Table S4. Photoperiodic changes in protein rhythms of SCN and non-SCN tissues. Table S5. Primers used for qRT-PCR. Figure S1. Re-entrainment of locomotor activity and sleep rhythms under LD20:4. Figure S2. The vast majority of peripheral tissues were not reset by culture. Figure S3. The phase and amplitude of core clock gene rhythms in central tissues is influenced by photoperiod. Figure S4. Representative, background-subtracted images representing PER2 expression in the hippocampus of mice held under LD12:12 and LD20:4 measured with immunohistochemistry. Figure S5. Representative, background-subtracted images representing PER2 expression in the septum of mice held under LD12:12 and LD20:4 measured with immunohistochemistry. Figure S6. Representative, background-subtracted images representing PER2 expression in the SCN of mice held under LD12:12 and LD20:4 measured with immunohistochemistry. Figure S7. Representative, background-subtracted images representing AVP expression in the SCN of mice held under LD12:12 and LD20:4 measured with immunohistochemistry.
Abbreviations
AVP:Arginine vasopressin; Cry1: Cryptochrome1; Cry2: Cryptochrome2; EEG: Electroencephalogram; EMG: Electromyography; LD: Light:dark; LD12:12: Standard lighting condition with 12 h of light; LD20:4: Long day with 20 h of light; LL: Constant light; Per1: Period1; Per2: Period2; PER2::LUC: PERIOD2::LUCIFERASE; SCN: Suprachiasmatic nucleus; VIP: Vasoactive intestinal polypeptide.
Competing interests
The authors declare that they have no competing interests.
Authors’contributions
Conceived and designed research: JAE and AJD. Performed research: JAE, TCS, BLC, ASM, OCC, KB, BJWT, and JCE. Developed tools: JAE, TL, and AJD. Analyzed data: JAE, TCS, BC, KMB, IK, and JCE. Wrote manuscript: JAE with the contribution of all authors. All authors read and approved the final manuscript.
Acknowledgements
This research was supported by Marquette University, NIH grants U54NS060659, F32NS071935, S21MD000101, R37DK35254, R01NS078410, R01EY022216, U54NS083932, 8G12MD007602, the Georgia Research Alliance, and the NSF Center for Behavioral Neuroscience. We thank Evan Hess for research assistance and Dr. Jason DeBruyne for critical reading of the manuscript.
Author details
1
Department of Biomedical Sciences, Marquette University, Milwaukee, WI 53233, USA.2Department of Neurobiology, Morehouse School of Medicine,
Atlanta, GA 30310, USA.3Department of Pharmacology, Morehouse School of Medicine, Atlanta, GA 30310, USA.4Department of Biology and Center for
Obesity Reversal, Georgia State University, Atlanta, GA 30302, USA.
5Department of Mathematics and Statistics, Amherst College, Amherst, MA
Received: 11 March 2015 Accepted: 16 June 2015
References
1. Mohawk JA, Green CB, Takahashi JS. Central and peripheral circadian clocks in mammals. Annu Rev Neurosci. 2012;35:445–62.
2. Ko CH, Takahashi JS. Molecular components of the mammalian circadian clock. Hum Mol Genet. 2006;15 Spec No 2:R271–7.
3. Dibner C, Schibler U, Albrecht U. The mammalian circadian timing system: Organization and coordination of central and peripheral clocks. Annu Rev Physiol. 2010;72:517–49.
4. Evans JA, Davidson AJ. Health consequences of circadian disruption in humans and animal models. Prog Mol Biol Transl Sci. 2013;119:283–323. 5. Abrahamson EE, Moore RY. Suprachiasmatic nucleus in the mouse: retinal
innervation, intrinsic organization and efferent projections. Brain Res. 2001;916:172–91.
6. Antle MC, Foley DK, Foley NC, Silver R. Gates and oscillators: a network model of the brain clock. J Biol Rhythms. 2003;18:339–50.
7. Nagano M, Adachi A, Nakahama K, Nakamura T, Tamada M, Meyer-Bernstein E, et al. An abrupt shift in the day/night cycle causes desynchrony in the mammalian circadian center. J Neurosci. 2003;23:6141–51.
8. Sumova A, Illnerova H. Effect of photic stimuli disturbing overt circadian rhythms on the dorsomedial and ventrolateral SCN rhythmicity. Brain Res. 2005;1048:161–9.
9. Nakamura W, Yamazaki S, Takasu NN, Mishima K, Block GD. Differential response of Period 1 expression within the suprachiasmatic nucleus. J Neurosci. 2005;25:5481–7.
10. Albus H, Vansteensel MJ, Michel S, Block GD, Meijer JH. A GABAergic mechanism is necessary for coupling dissociable ventral and dorsal regional oscillators within the circadian clock. Curr Biol. 2005;15:886–93.
11. Morin LP. SCN organization reconsidered. J Biol Rhythms. 2007;22:3–13. 12. Kriegsfeld LJ, Leak RK, Yackulic CB, LeSauter J, Silver R. Organization of
suprachiasmatic nucleus projections in Syrian hamsters (Mesocricetus
auratus): an anterograde and retrograde analysis. J Comp Neurol. 2004;468:361–79.
13. Yan L, Foley NC, Bobula JM, Kriegsfeld LJ, Silver R. Two antiphase oscillations occur in each suprachiasmatic nucleus of behaviorally split hamsters. J Neurosci. 2005;25:9017–26.
14. de la Iglesia HO, Meyer J, Carpino Jr A, Schwartz WJ. Antiphase oscillation of the left and right suprachiasmatic nuclei. Science. 2000;290:799–801. 15. Ohta H, Yamazaki S, McMahon DG. Constant light desynchronizes
mammalian clock neurons. Nat Neurosci. 2005;8:267–9.
16. Butler MP, Rainbow MN, Rodriguez E, Lyon SM, Silver R. Twelve-hour days in the brain and behavior of split hamsters. Eur J Neurosci. 2012;36:2556–66. 17. Smarr BL, Morris E, de la Iglesia HO. The dorsomedial suprachiasmatic
nucleus times circadian expression ofKiss1and the luteinizing hormone surge. Endocrinology. 2012;153:2839–50.
18. Lee ML, Swanson BE, de la Iglesia HO. Circadian timing of REM sleep is coupled to an oscillator within the dorsomedial suprachiasmatic nucleus. Curr Biol. 2009;19:848–52.
19. Wotus C, Lilley TR, Neal AS, Suleiman NL, Schmuck SC, Smarr BL, et al. Forced desynchrony reveals independent contributions of suprachiasmatic oscillators to the daily plasma corticosterone rhythm in male rats. PLoS One. 2013;8:e68793.
20. Schwartz MD, Wotus C, Liu T, Friesen WO, Borjigin J, Oda GA, et al. Dissociation of circadian and light inhibition of melatonin release through forced desynchronization in the rat. Proc Natl Acad Sci U S A.
2009;106:17540–5.
21. Evans JA, Leise TL, Castanon-Cervantes O, Davidson AJ. Dynamic interactions mediated by nonredundant signaling mechanisms couple circadian clock neurons. Neuron. 2013;80:973–83.
22. Inagaki N, Honma S, Ono D, Tanahashi Y, Honma K. Separate oscillating cell groups in mouse suprachiasmatic nucleus couple photoperiodically to the onset and end of daily activity. Proc Natl Acad Sci U S A. 2007;104:7664–9. 23. Naito E, Watanabe T, Tei H, Yoshimura T, Ebihara S. Reorganization of the
suprachiasmatic nucleus coding for day length. J Biol Rhythms. 2008;23:140–9.
24. Yoo SH, Yamazaki S, Lowrey PL, Shimomura K, Ko CH, Buhr ED, et al. PERIOD2::LUCIFERASE real-time reporting of circadian dynamics reveals persistent circadian oscillations in mouse peripheral tissues. Proc Natl Acad Sci U S A. 2004;101:5339–46.
25. Yoshikawa T, Yamazaki S, Menaker M. Effects of preparation time on phase of cultured tissues reveal complexity of circadian organization. J Biol Rhythms. 2005;20:500–12.
26. Ishida A, Mutoh T, Ueyama T, Bando H, Masubuchi S, Nakahara D, et al. Light activates the adrenal gland: timing of gene expression and glucocorticoid release. Cell Metab. 2005;2:297–307.
27. Redlin U, Mrosovsky N. Masking by light in hamsters with SCN lesions. J Comp Physiol A. 1999;184:439–48.
28. Husse J, Leliavski A, Tsang AH, Oster H, Eichele G. The light–dark cycle controls peripheral rhythmicity in mice with a genetically ablated suprachiasmatic nucleus clock. FASEB J. 2014;28:4950–60. 29. Son GH, Chung S, Choe HK, Kim HD, Baik SM, Lee H, et al. Adrenal
peripheral clock controls the autonomous circadian rhythm of
glucocorticoid by causing rhythmic steroid production. Proc Natl Acad Sci U S A. 2008;105:20970–5.
30. Kiessling S, Sollars PJ, Pickard GE. Light stimulates the mouse adrenal through a retinohypothalamic pathway independent of an effect on the clock in the suprachiasmatic nucleus. PLoS One. 2014;9:e92959.
31. Guilding C, Hughes AT, Brown TM, Namvar S, Piggins HD. A riot of rhythms: neuronal and glial circadian oscillators in the mediobasal hypothalamus. Mol Brain. 2009;2:28.
32. Guilding C, Hughes AT, Piggins HD. Circadian oscillators in the epithalamus. Neuroscience. 2010;169:1630–9.
33. Kalsbeek A, Fliers E, Hofman MA, Swaab DF, Buijs RM. Vasopressin and the output of the hypothalamic biological clock. J Neuroendocrinol. 2010;22:362–72.
34. Weaver DR. The suprachiasmatic nucleus: a 25-year retrospective. J Biol Rhythms. 1998;13:100–12.
35. Leak RK, Moore RY. Topographic organization of suprachiasmatic nucleus projection neurons. J Comp Neurol. 2001;433:312–34.
36. Zhou QY, Cheng MY. Prokineticin 2 and circadian clock output. FEBS J. 2005;272:5703–9.
37. Li JD, Burton KJ, Zhang C, Hu SB, Zhou QY. Vasopressin receptor V1a regulates circadian rhythms of locomotor activity and expression of clock-controlled genes in the suprachiasmatic nuclei. Am J Physiol Regul Integr Comp Physiol. 2009;296:R824–30.
38. Kramer A, Yang FC, Snodgrass P, Li X, Scammell TE, Davis FC, et al. Regulation of daily locomotor activity and sleep by hypothalamic EGF receptor signaling. Science. 2001;294:2511–5.
39. Yoder JM, Brandeland M, Engeland WC. Phase-dependent resetting of the adrenal clock by ACTHin vitro. Am J Physiol Regul Integr Comp Physiol. 2014;306:R387–93.
40. Wu C, Sui G, Archer SN, Sassone-Corsi P, Aitken K, Bagli D, et al. Local receptors as novel regulators for peripheral clock expression. FASEB J. 2014;28(11):4610–6.
41. de la Iglesia HO, Meyer J, Schwartz WJ. Lateralization of circadian pacemaker output: Activation of left- and right-sided luteinizing hormone-releasing hormone neurons involves a neural rather than a humoral pathway. J Neurosci. 2003;23:7412–4.
42. Meyer-Bernstein EL, Jetton AE, Matsumoto SI, Markuns JF, Lehman MN, Bittman EL. Effects of suprachiasmatic transplants on circadian rhythms of neuroendocrine function in golden hamsters. Endocrinology. 1999;140:207–18.
43. Teclemariam-Mesbah R, Ter Horst GJ, Postema F, Wortel J, Buijs RM. Anatomical demonstration of the suprachiasmatic nucleus-pineal pathway. J Comp Neurol. 1999;406:171–82.
44. Lehman MN, Silver R, Gladstone WR, Kahn RM, Gibson M, Bittman EL. Circadian rhythmicity restored by neural transplant. Immunocytochemical characterization of the graft and its integration with the host brain. J Neurosci. 1987;7:1626–38.
45. Guo H, Brewer JM, Champhekar A, Harris RB, Bittman EL. Differential control of peripheral circadian rhythms by suprachiasmatic-dependent neural signals. Proc Natl Acad Sci U S A. 2005;102:3111–6.
46. Ueyama T, Krout KE, Nguyen XV, Karpitskiy V, Kollert A, Mettenleiter TC, et al. Suprachiasmatic nucleus: a central autonomic clock. Nat Neurosci. 1999;2:1051–3.
47. Hattar S, Kumar M, Park A, Tong P, Tung J, Yau KW, et al. Central projections of melanopsin-expressing retinal ganglion cells in the mouse. J Comp Neurol. 2006;497:326–49.
48. Lamia KA, Storch KF, Weitz CJ. Physiological significance of a peripheral tissue circadian clock. Proc Natl Acad Sci U S A. 2008;105:15172–7.
49. Kornmann B, Schaad O, Bujard H, Takahashi JS, Schibler U. System-driven and oscillator-dependent circadian transcription in mice with a conditionally active liver clock. PLoS Biol. 2007;5:e34.
50. Kalsbeek A, van der Vliet J, Buijs RM. Decrease of endogenous vasopressin release necessary for expression of the circadian rise in plasma corticosterone: a reverse microdialysis study. J Neuroendocrinol. 1996;8:299–307.
51. Brown MH, Nunez AA. Vasopressin-deficient rats show a reduced amplitude of the circadian sleep rhythm. Physiol Behav. 1989;46:759–62.
52. Schroder H, Stehle J, Henschel M. Twenty-four-hour pineal melatonin synthesis in the vasopressin-deficient Brattleboro rat. Brain Res. 1988;459:328–32.
53. Aton SJ, Colwell CS, Harmar AJ, Waschek J, Herzog ED. Vasoactive intestinal polypeptide mediates circadian rhythmicity and synchrony in mammalian clock neurons. Nat Neurosci. 2005;8:476–83.
54. van der Beek EM, Wiegant VM, van der Donk HA, van den Hurk R, Buijs RM. Lesions of the suprachiasmatic nucleus indicate the presence of a direct vasoactive intestinal polypeptide-containing projection to gonadotrophin-releasing hormone neurons in the female rat. J Neuroendocrinol. 1993;5:137–44.
55. Sellix MT, Evans JA, Leise TL, Castanon-Cervantes O, Hill DD, DeLisser P, et al. Aging differentially affects the re-entrainment response of central and peripheral circadian oscillators. J Neurosci. 2012;32:16193–202.
56. Davidson AJ, Castanon-Cervantes O, Leise TL, Molyneux PC, Harrington ME. Visualizing jet lag in the mouse suprachiasmatic nucleus and peripheral circadian timing system. Eur J Neurosci. 2009;29:171–80.
57. Yamazaki S, Numano R, Abe M, Hida A, Takahashi R, Ueda M, et al. Resetting central and peripheral circadian oscillators in transgenic rats. Science. 2000;288:682–5.
58. Li JZ, Bunney BG, Meng F, Hagenauer MH, Walsh DM, Vawter MP, et al. Circadian patterns of gene expression in the human brain and disruption in major depressive disorder. Proc Natl Acad Sci U S A. 2013;110:9950–5. 59. Ehlen JC, Jefferson F, Brager AJ, Benveniste M, Paul KN. Period-amplitude
analysis reveals wake-dependent changes in the electroencephalogram during sleep deprivation. Sleep. 2013;36:1723–35.
60. Oster H, Damerow S, Hut RA, Eichele G. Transcriptional profiling in the adrenal gland reveals circadian regulation of hormone biosynthesis genes and nucleosome assembly genes. J Biol Rhythms. 2006;21:350–61.
Submit your next manuscript to BioMed Central and take full advantage of:
• Convenient online submission
• Thorough peer review
• No space constraints or color figure charges
• Immediate publication on acceptance
• Inclusion in PubMed, CAS, Scopus and Google Scholar
• Research which is freely available for redistribution