Modelling and Estimation of Volatility Using
ARCH/GARCH Models in Jordan’s Stock Market
Dana AL-Najjar
Dept. of Finance and Banking, Applied Science University
PO Box 166, Amman -Postal code 11931, Jordan
Tel: 962-777-476-164 E-mail: [email protected]
Received: March 1, 2016 Accepted: April 30, 2016 Published: June 1, 2016
doi:10.5296/ajfa.v8i1.9129 URL: http://dx.doi.org/10.5296/ajfa.v8i1.9129
Abstract
Financials have been concerned constantly with factors that have impact on both taking and assessing various financial decisions in firms. Hence modelling volatility in financial markets is one of the factors that have direct role and effect on pricing, risk and portfolio management. Therefore, this study aims to examine the volatility characteristics on Jordan’s capital market that include; clustering volatility, leptokurtosis, and leverage effect. This objective can be accomplished by selecting symmetric and asymmetric models from GARCH family models. This study applies; ARCH, GARCH, and EGARCH to investigate the behavior of stock return volatility for Amman Stock Exchange (ASE) covering the period from Jan. 1 2005 through Dec.31 2014. The main findings suggest that the symmetric ARCH /GARCH models can capture characteristics of ASE, and provide more evidence for both volatility clustering and leptokurtic, whereas EGARCH output reveals no support for the existence of leverage effect in the stock returns at Amman Stock Exchange.
1. Introduction
Financial markets are considered to have a keen role in economic conditions for countries worldwide. In this regard one of the major aspects of the financial markets is to model and estimate financial market volatility caused by its importance as an indicator for the dynamic fluctuations in stock prices (Raja and Selvam, 2011). Thus volatility is considered to be a measure of uncertainty for changes in asset prices, and it was used earlier by Markowitz (1952) as a measure of risk.
During the last three decades there were continuous need to find out accurate measurement of volatility due to its vital role in pricing assets, risk and portfolio management (Goudarzi, 2011; Ezzat, 2012; Gokbulut and Pekkaya, 2014).
Consequently, modelling volatility will improve the usefulness of stock prices as an appropriate signal for intrinsic value of securities; thereby better modelling gives us better prediction that in the end will provide practitioners and academics with more accurate pricing models for financial assets. That all in return will make it easier for different interested parties such as investors, managers, and policy makers to take various financial decisions such as raising capital, and investment decisions in financial markets (Emenike, 2010).
Moreover, early studies by Mandelbrot (1963), Fama (1965), and Black (1976), side by side with the recent numerous studies such as Poterba and Summer (1986), Tse (1991), McMillan et.al (2000), Najand (2002), Lee(2009), Emenike (2010), and Ezzat(2012); all have documented evidence showing that financial time series does exhibit both volatility clustering and leptokurtosis.
Regarding the occurrence of volatility clustering it is when large changes in stock prices are followed by large changes in price of both signs, and vice versa, i.e. the small price changes are followed by periods of small changes in prices. On the other hand, the case of non-normal distribution of financial return which tends to be fat tailed is called leptokurtosis. Furthermore, studies such as Kosapattarapim et.al (2011), Rousan and AL Khouri (2005), Liu and Huang (2010), Freedi et.al (2012), and Gokbulut and Pekkaya (2014); observed new insights encountered in time series studies that is leverage effect (Asymmetric) that was first detected by Black (1976). It occurs when stock return tends to have a negative correlation with changes in volatility, i.e. volatility is expected to rise in response to bad news and fall in response to good news.
In accordance to the aforementioned, all those characteristics accompanied with financial time series especially the part related to the estimation of volatility drives us away from linear models into searching for more appropriate statistical models. Thus, a study by Engle (1982) proposed to model time varying conditional variance through applying Auto Regressive Conditional Heteroscedasticity process (ARCH), which is expected to capture mainly the dynamic behavior of conditional variance using lagged disturbance.
instead of having infinite parameters using ARCH models, we can reduce the number into only two parameters in GARCH model.
Accordingly, both ARCH and GARCH models that were proposed by Engle (1982) and Bollerslev (1986) respectively, can capture simultaneously volatility clustering and leptokurtosis. So in return they have been widely employed in financial markets analysis studies. But on the other hand, they both fail to capture the leverage effect. Hence, Nelson (1991) proposed one of the extended ARCH models by using Exponential Generalized Auto Regressive Conditional Heteroscedasticity well known as (EGARCH) model, in order to track the asymmetric shocks of the conditional variance (Gokcan, 2000; Su, 2010; Abd AL Aal, 2011; Ezzat, 2012; Freedi et. al, 2012).
In regards to this study it aims to contribute to the available literature in that it adds new updated daily return gathered from one of the emerging economies which is Jordan; to investigate the behavior of stock return volatility for Amman Stock Exchange General Index (ASEI) during the period from 2005-2014 which covers the period of both recent financial crisis that affected all economies worldwide, also Arab spring revolutions in the middle east region. In addition this paper adopts GARCH model to capture the nature of volatility and employs Exponential GARCH (EGARCH) for capturing asymmetry in volatility clustering and the leverage effect in Jordan’s capital market for the period of 2005- 2014.
The remainder of this paper is organized as follows; section 2 Literature review, section 3 methodology, section 4 analytical analysis and empirical results, and section 5 concluding remarks.
2. Literature Review
The main early highlight studies to mention volatility clustering. Leptokurtosis, and leverage effect of stock return in financial market was provided by the following three studies of; Mandelbrot (1963), Fama (1965), and Black (1976).
Measuring and estimating the stock prices volatility is an important concept in finance in general, and in investment decisions in specific, due to its dynamic behavior. That led researchers to propose multiple mathematical and statistical models to capture volatility of stock return in financial markets worldwide. The pioneering studies in this field are referred to Engle (1982), and Bollerslev (1986) who proposed the use of both ARCH and GARCH models respectively. This section will provide brief review for the main empirical findings provided by researchers from both developed and emerging markets.
Applying the ARCH model shade light on some limitations regarding this model, hence to overcome them Bollerslev (1986) proposed a modified form through Generalized ARCH (GARCH) to allow a longer memory and a more flexible lag structure. Not only does GARCH shares with the ARCH model in the main assumption regarding conditional variance is specified as a linear function of past sample variance, but also it allows lagged conditional variances to enter in the model too.
More extended forms of the ARCH model were provided by many researchers such as; Engle et al. (1987) in which they introduced the GARCH –M, that allows the conditional variance to be determinant of the mean. In addition their empirical findings supports that risk premium are not time invariant; rather they vary systematically.
Moreover, to break the rigidness of the GARCH specifications, Nelson (1991) contributed a new model through Exponential GARCH (EGARCH) which supported that variance of return was affected differently by positive and negative excess returns. Also the empirical findings support the negative correlation between both excess returns and stock market variance.
Furthermore, depending on the previously mentioned GARCH-M model, Glosten et al. (1993) study modified the model by proposing GJR GARCH, in which their model is based on the fact that there is asymmetric response of volatility depending on the positive and negative shocks.
Since then successive studies came out with new proposed members to the GARCH models family to overcome drawbacks of each model, such as for example studies by; Ding et. al (1993) proposed Asymmetric Power GARCH (APGARCH), then Zokoian (1994) applied threshold GARCH (TGARCH), in the study of Caporin and McAleer (2006) their employed models were Dynamic Asymmetric (DAGARCH), Conditional Auto Regressive Range (CARR), and Quadratic GARCH (QGARCH) model, and so on with more models to be applied and tested by different researchers worldwide.
Concerning the effectiveness of the ARCH/GARCH, many empirical findings such as Hsieh (1989), Taylor (1994), Bekaert and Harvey (1997), Aggarwal et. al (1999), Brook and Burke (2003), Frimpong and Oteng (2006), and Olowe (2009); found similar conclusion that is; the best model to describe the data and measure the volatility is the GARCH (1,1). Also, they all confirm the ability of asymmetric GARCH models in capturing asymmetry in stock return volatility.
Recently, there is a growing empirical researches in which their methodologies depends on applying ARCH/ GARCH models on emerging stock markets to estimate and predict volatility such as; the studies of Aydin (2002), Akgül and Sayyan (2005) and Gokbulut and Pekkaya (2014) in turkey, Rashid and Ahmad (2008) in Pakistan, Goudarzi and Ramanarayanan (2011) in India. Their main findings were the occurrence of non-normality, volatility clusters, negative skewness, leptokurtosis for data gathered from emerging economies; in addition, the best fit model for the data is GARCH (1, 1). Also, Gokbulut and Pekkaya (2014) supported that the CGARCH and TGARCH appear to be superior in modelling volatility.
Consequently, many researchers in emerging countries are interested in applying and comparing between various ARCH/GARCH family models on selected data gathered from emerging economies, so at the end each empirical study may figure out the best fit models in their countries such as; Floros (2008), and Emenike (2010) in Nigeria Su (2010) in china, Angabini and Wasiuzzaman (2011) in Malaysia, Abd el Aal (2011), and Ezzat (2012) in Egypt, and Freedi et al. (2012) in Saudi Arabia. They all applied one or more from these models; GARCH, EGARCH, and GJR GARCH, and their main findings shows that EGARCH and GJR GARCH are the best models for measuring volatility, detecting clustering effect, leptokurtosis, also the leverage effect.
Although there are many studies around the world that tested the ARCH/GARCH family models in their capital markets, few studies were found in Jordan concerning this issue. Rousan and Al Khouri (2005) study investigated the volatility for Amman Stock Exchange (ASE) for the period during (1992-2004), depending on daily observations for the general index of the exchange; and their results support that ARCH/GARCH models can provide good approximation for capturing the characteristics of ASE. In addition the study applied multiple asymmetric models to track the leverage effect and found that the exchange is symmetric; hence, good and bad news has the same magnitude. For Rimony and Nader (2012) study, it measured the volatility and the effect of macroeconomics on it by applying ARCH/GARCH, and their findings were that the ARCH was found statistically significant. On the other hand, GARCH was found statistically insignificant during the period (1991-2010).
Consequently, our study will aim to update the data that were used in previous studies regarding measuring volatility and testing leverage effect for Amman Stock Exchange Index (ASEI100). Also, the period of the study will cover important events that affected the economic conditions regionally and worldwide such as recent financial crisis. Such kind of events is expected to stimulate the importance of estimating and forecasting stock market volatility so that it will ease taking various economic and investment decisions in firms.
3. Methodology
capture fluctuations of return in financial markets in particular especially in developed countries. The pioneer study in this field is credited to the study of Engle (1982) who offered modeling conditional volatility by using Autoregressive Conditional Heteroscedasticity (ARCH) process; which is in simple words a function of lagged squared residuals, and the general form of the model is:
= + ∑ (1)
Where α0 is mean, αi is conditional volatility and εt-i is white noise representing residuals of time series.
However, to overcome the weaknesses that were found while applying ARCH models, especially the one related to the inability to exhibit volatility clustering. Another proposal was introduced by Bollerslev (1986) study to modify the version of ARCH models, which is symmetric Generalized Autoregressive Conditional Heteroscedasticity (GARCH) model; that synchronized both lagged squared residuals and lagged variances. In this way GARCH model is allowed to be dependent on both recent variance of itself side by side with past shocks, so at the end it will provide us with volatility clustering. In general the GARCH (p, q) model is presented in the following formula:
= + ∑ + ∑ (2)
Where i=0,1,2,3,… p, conditional volatility, , , are non-negative constants with + < 1 it should be near to unity for an accurate model, εt-j is residuals and it is lagged conditional volatility. And the last part of the formula is the main difference in applying both ARCH and GARCH models. Hence, αj and εt-j2 are ARCH components and βj and are GARCH components. In addition, both ARCH and GARCH models depend on a major assumption that is; all of the shock effects on volatility have a symmetric distribution.
In accordance to the aforementioned, this study adopts in particular employing EGARCH model due to the ability of this model to show greater impact of volatility by large shocks, also this will be side by side with the classical models of ARCH/GARCH as well, to test and measure both asymmetric and symmetric distribution respectively and to find out the main characteristics of stock return at Amman Stock Exchange general Index (ASEI100). The formula of EGARCH can be expressed as following:
( ) = + ( ) + − 2 − (3)
Regarding the EGARCH formula it is easy to figure out its added advantages, in that; firstly, the parameters are guaranteed to be positive since the model uses the log of the variances. And secondly, no restrictions on the parameters included in the formula which are ,β ,γ.
Moreover, to make sure that the stationery assumption still holds β must be positive and less than 1, in addition, the value of gamma (γ) is the indicator of leverage effect (asymmetric) and must be both negative and significant.
Consequently, to accomplish the objective of this study our methodology depends mainly on applying the most widely used nonlinear models for specifying volatility; which are ARCH/GARCH models to stylized facts about volatility of stock return in Amman Stock Exchange (ASE). Also to investigate different properties in Jordan’s capital market regarding the availability of volatility clustering, long memory, leptokurtosis, and finally leverage effect through EGARCH model.
Therefore, the first stage in the analysis process is to investigate the presence of ARCH effect in the data by generating regression residuals through applying least square method. Afterwards, next step is to test the availability of volatility clustering by using GARCH. After making sure of the ARCH/GARCH effect existence there will be a necessity to run different statistical analysis to give a clearer image of the relation between volatility and stock return such as Jarque- bera test and Augmented Dickey-Fuller test (ADF) and many other test that will be discussed in details in the next section. The final step is to run EGARCH model to test leverage effect.
4. Analytical Analysis and Empirical Results 4.1 Data
This study employ’s data including; 2469daily closing observations of Amman Stock Exchange general index (ASEI100) for the period from Jan. 1. 2005 till Dec. 31. 2014. The ASEI100 stock return is calculated through:
Rt= Log (pt/pt-1) (4)
around mean value that is close to zero. Also the observations show consistent fluctuations that are considered to be high for certain periods and low for others.
4.2 Empirical Results
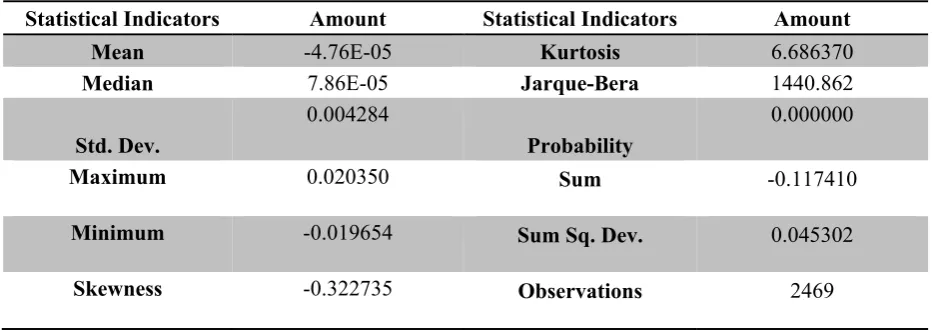
Table 1 reports the statistical description for daily observations of Amman Stock Exchange General Index (ASEI) during the period of 2005-2014 that contains; mean, median, max, min, skewness, kurtosis and Jarque and Bera results.
Table 1. Descriptive Statistics
Statistical Indicators Amount Statistical Indicators Amount
Mean -4.76E-05 Kurtosis 6.686370
Median 7.86E-05 Jarque-Bera 1440.862
Std. Dev.
0.004284
Probability
0.000000
Maximum 0.020350 Sum -0.117410
Minimum -0.019654 Sum Sq. Dev. 0.045302
Skewness -0.322735 Observations 2469
Figure1. Log Return Distribution
Moreover, by visual inspection for ASEI returns during 2005-2014 represented by Figure 1, it can be observed that volatility changes over time tends to cluster financial return, which is an indicator for long memory too. In other words large changes tend to be followed by large changes and vice versa the small changes are followed by small changes as well.
Table 2. Augmented Dickey-Fuller test
t-Statistic Prob.*
Augmented Dickey-Fuller test statistic -33.98253 0.0000
Test critical values: 1% level -3.432807
5% level -2.862511
10% level -2.567332
*MacKinnon (1996) one-sided p-values.
Table 2 represents the Augmented Dickey Fuller (ADF) test to examine the unit roots in return series. The main result based on this test is that; ADF is statistically significant at 1% level. This indicates to reject null hypothesis and accept that the returns are stationery; hence, it is mean reverting. That all confirms the non-existence of autocorrelation.
However, since the series are stationery, the next step is to determine the best fitting mean equation through applying Auto Regressive Moving Average (ARMA) to choose the best process in modelling the conditional mean, and it can expressed as following:
-.02 -.01 .00 .01 .02 .03
2005 2006 2007 2008 2009 2010 2011 2012 2013 2014
= + + (5)
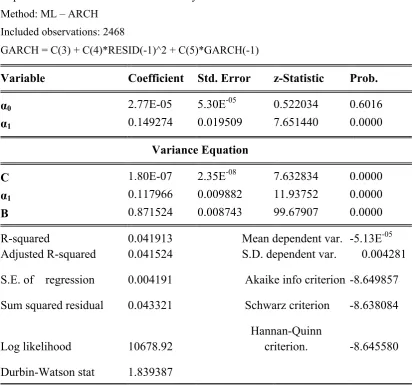
Table 3. ARCH/GARCH Model Output
Dependent Variable: Market return volatility Method: ML – ARCH
Included observations: 2468
GARCH = C(3) + C(4)*RESID(-1)^2 + C(5)*GARCH(-1)
Variable Coefficient Std. Error z-Statistic Prob.
α0 2.77E-05 5.30E-05 0.522034 0.6016
α1 0.149274 0.019509 7.651440 0.0000
Variance Equation
C 1.80E-07 2.35E-08 7.632834 0.0000
α1 0.117966 0.009882 11.93752 0.0000
Β 0.871524 0.008743 99.67907 0.0000
R-squared 0.041913 Mean dependent var. -5.13E-05
Adjusted R-squared 0.041524 S.D. dependent var. 0.004281
S.E. of regression 0.004191 Akaike info criterion -8.649857
Sum squared residual 0.043321 Schwarz criterion -8.638084
Log likelihood 10678.92
Hannan-Quinn
criterion. -8.645580
Durbin-Watson stat 1.839387
After building the ARMA model for estimating mean, the volatility will be modeled using both ARCH/GARCH model. According to Table 3 the ARCH model is significant at 1% level, implying to reject null hypothesis and accept that there is an ARCH effect in the return of ASEI, also it indicates that there is a direct effect between news that enters the market and the level of volatility in the ASE. The appropriate model is ARCH (1).
the more persistent is the stock to conditional variance. However, it appears from the analytical output that the (α + β) is around (0.99) which means that the ASEI return series have both attributes; volatility clustering and persistent. Hence, all previously mentioned tests indicate that the variance equation is well characterized and specified.
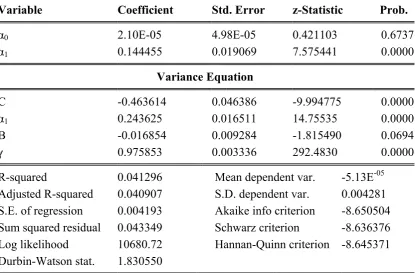
Table 4. EGARCH Model Output
Dependent Variable: Market Return Volatility Method: ML – ARCH
Included observations: 2468
LOG(GARCH) = C(3) + C(4)*ABS(RESID(-1)/@SQRT(GARCH(-1))) + C(5) *RESID(-1)/@SQRT(GARCH(-1)) +
C(6)*LOG(GARCH(-1))
Variable Coefficient Std. Error z-Statistic Prob.
α0 2.10E-05 4.98E-05 0.421103 0.6737
α1 0.144455 0.019069 7.575441 0.0000
Variance Equation
C -0.463614 0.046386 -9.994775 0.0000
α1 0.243625 0.016511 14.75535 0.0000
Β -0.016854 0.009284 -1.815490 0.0694
γ 0.975853 0.003336 292.4830 0.0000
R-squared 0.041296 Mean dependent var. -5.13E-05
Adjusted R-squared 0.040907 S.D. dependent var. 0.004281
S.E. of regression 0.004193 Akaike info criterion -8.650504
Sum squared residual 0.043349 Schwarz criterion -8.636376
Log likelihood 10680.72 Hannan-Quinn criterion -8.645371
Durbin-Watson stat. 1.830550
5. Main Conclusions
Measuring and modelling volatility is vital in determining cost of capital for financial securities, also in assessing leverage and investment decisions that will affect the firm performance and its continuity especially in emerging economies where essential number of investors is described to be risk averters.
Thus, this study attempts to model the volatility of stock market return in Jordan’s capital market. To achieve this goal the empirical analysis depends on running both ARCH/ GARCH models, so that to investigate the major volatility characteristics accompanied with Amman Stock Exchange General Index (ASEI) through the period from January 1. 2005 to December 31. 2014; which includes volatility clustering. Leptokurtic distribution, and leverage effect.
To capture the symmetry effect in Amman Stock exchange data, both ARCH and GARCH (1, 1) model is employed. The primary empirical findings of the stock return data is far from normality, whereas it showed existence of conditional Heteroscedasticity; in other words volatility clustering. Moreover, the statistical output reveals evidence for leptokurtosis, long memory, skewed to left (fat tailed), and persistence of volatility. All these results are consistent with many previous studies such as; Cohary and Rad (1994), Rousan and AL Khouri (2005), Emenike (2010), Goudarzi (2011), Ezzat (2012) and so on.
In regards to detecting the asymmetric effect in the data, the study applied EGARCH (1, 1) model, so that it can investigate if there is a various effect of good and bad news on the future volatility in Amman Stock Exchange (ASE). Therefore the expected outcome for the existence of asymmetric effect in the data is related to having negative significant gamma (γ), and since the results in our study is positively significant this indicates that; there is no support to the existence of leverage effect in Amman Stock Exchange. Thus, the stock return is considered to be volatile. Hence, whether the shocks are positive (good news) or negative (bad news) of the same magnitude, they will have the same impact on the future volatility. This part of the results in particular is consistent with few studies such as Cohary and Rad (1994), and Rousan and AL Khouri (2005). In addition, the unavailability of leverage effect at ASE can be due to many reasons such as; Jordan is an emerging country with limited resources that were affected by successive hard political and economic circumstances on both levels regionally and internationally, that all in return affected the economic conditions in Jordan in general, and capital market in specific; such as Iraq war in 2003, financial crisis of 2007-2011, and Arab spring revolutions, that all have had its material impact directly and indirectly on stock market (Amman Stock Exchange).
Overall results of this study provide more evidence for both volatility clustering and leptokurtic, whereas no support for the existence of leverage effect in the stock returns at Amman Stock Exchange.
References
Aggarwal, R., Inclan, C., & Leal R. (1999). Volatility in Emerging Stock Markets. Journal Financial Quantitative Analysis, 34(1), 33–55. http://dx.doi.org/10.2307/2676245
Akgül, I., & Sayyan, H. (2005). Forecasting volatility in ISE-30 stock returns with asymmetric conditional Heteroscedasticity models. Symposium of Traditional Finance, Marmara Universitesi Bankacılık ve Sigortacılık Yüksekokulu, Istanbul, Turkey
Al- Freedi, A., Shamiri, A. and Isa, Z.(2012). A Study on the Behavior of Volatility in Saudi Arabia Stock Market Using Symmetric and Asymmetric GARCH Models. Journal of Mathematics and Statistics, 8(1), 98-106
Al-Raimony, & El-Nader, H. M. (2012). The Sources of Stock Market Volatility in Jordon.
International Journal of Economics and Finance, 4(11), 108-121.
http://dx.doi.org/10.5539/ijef.v4n11p108
Angabini, A., & Wasiuzzaman, S. (2011). GARCH Models and the Financial Crisis-A Study of the Malaysian Stock Market. The International Journal of Applied Economics and Finance, 5(1), 226-236.
Awartani, B. M. A., & Corradi, V. (2005). Predicting the volatility of the S&P-500 stock index via GARCH Models: The role of asymmetries. International Journal of Forecasting, 21, 167–183. http://dx.doi.org/10.1016/j.ijforecast.2004.08.003
Aydın, K. (2002). Riske maruz değer hesaplamalarında EWMA ve GARCH metodlarının kullanılması: İMKB-30 endeks uygulaması. Yayımlanmamış Yüksek Lisans Tezi, Sosyal Bilimler Enstitüsü, Karaelmas Üniversitesi, Zonguldak
Bekaert, G., & Harvey C. R. (1997). Emerging Equity Market Volatility. Journal of Financial Economics, 43, 29-77. http://dx.doi.org/10.1016/S0304-405X(96)00889-6
Black, F. (1976). Studies of stock price volatility changes. Proceedings of the 1976 Business Meeting of the Business and Economics Statistics Section. American Statistical Association,
Washington, DC., 177–181.
Bollerslev, T. (1986). Generalized autoregressive conditional Heteroscedasticity. Journal of Econometrics, 31(3), 307–327. http://dx.doi.org/10.1016/0304-4076(86)90063-1
Brooks, C., & Burke, S. P. (2003). Information Criteria for GARCH Model Selection: An Application to High Frequency Data. European Journal of Finance, 9, 557-580.
http://dx.doi.org/10.1080/135184702100002918
Caporin, M., & McAleer, M. (2006). Dynamic asymmetric GARCH. Journal of Financial Econometrics, 4(3), 385–412. http://dx.doi.org/10.1093/jjfinec/nbj011
Cohary, A., & Rad, A. T. (1994). Statistical Properties of Daily Returns: Evidence from European Stock Markets. Journal of Business Finance and Accounting, 21, 271-282.
Ding, Z., Granger, C. W. J., & Angle, R. F. (1993). A long memory property of stocks market
returns and a new Model. Journal of Empirical Finance, 1(1), 83–106.
http://dx.doi.org/10.1016/0927-5398 (93)90006-D
Emenike, K. O. (2010). Modelling Stock Returns Volatility in Nigeria Using GARCH Models. African Journal of Management and Administration, 3(1), 8-15.
Engle, R. F. (1982). Autoregressive conditional heteroscedasticity with estimates of the
variance of United Kingdom inflation. Econometrica, 50(4), 987–1007.
http://dx.doi.org/10.2307/1912773
Engle, R., & Granger, C. (1987). Co-Integration and Error Correction: Representation, Estimation, and Testing. Econometrica, 55(2), 251-276. http://dx.doi.org/10.2307/1913236
Ezzat, H. (2012). The Application of GARCH and EGARCH in Modelling the Volatility of Daily Stock Returns during Massive Shocks: The Empirical Case of Egypt. Munich Personal RePEC Archive. Retrieved from http://mpra.ub.uni-muenchen.de/50530/
Fama, E. F. (1965). The behavior of stock market prices. Journal of Business, 38, 34–105.
http://dx.doi.org/10.1086/29474
Floros, C. (2008). Modelling volatility using GARCH models: evidence from Egypt and Israel. Middle Eastern Finance and Economics, 2, 32-41.
Franses, P.H., & D. Van Dijk, (1996). Forecasting stock market volatility using (non-linear)
GARCH models. Journal of Forecasting, 15, 229-235.
http://dx.doi.org/10.1002/(SICI)1099-131X(199604)15:3<229::AID-FOR620>3.0.CO;2-3
Frimpong, J. M., & Oteng-Abayie, E. F. (2006). Modelling and forecasting volatility of returns on the Ghana stock exchange using GARCH models. American Journal of Applied Sciences, 3, 2042-4048. http://dx.doi.org/10.3844/ajassp.2006.2042.2048
Glosten, L. R., Jagannathan, R., & Runkle, D. E. (1993). On the relation between expected value and the volatility of the nominal excess return on stocks. Journal of Finance, 48(5),
1779–1801. http://dx.doi.org/10.1111/j.1540-6261.1993.tb05128.x
Gökbulut, R., & Pekkaya, M. (2014). Estimating and Forecasting Volatility of Financial Markets Using Asymmetric GARCH Models: An Application on Turkish Financial Markets.
International Journal of Economics and Finance, 6(4), 23-33.
http://dx.doi.org/10.5539/ijef.v6n4p23
Gokcan, S. (2000). Forecasting volatility of emerging stock markets: Linear versus non-linear
GARCH models. Journal of Forecasting, 19, 499-504.
http://dx.doi.org/10.1002/1099-131x(200011)19:6<499::aid-for745>3.0.co;2-p
Goudarzi, H., & Ramanarayanan, C.S. (2011). Modeling Asymmetric Volatility in the Indian Stock Market. International Journal of Business and Management, 6(3), 221-231.
Hsieh, D.A. (1989). Modeling heteroscedasticity in daily foreign-exchange rates. Journal of Business & Economic Statistics, 7, 307-317. http://dx.doi.org/10.2307/1391528
Jarque, C.M., & Bera, A.K. (1980). Efficient tests for normality, homoscedasticity and serial
dependence of regression residuals. Economic Letter, 6, 255-259.
http://dx.doi.org/10.1016/0165-1765(80)90024-5
Jarque, C.M., & A.K. Bera (1987). A test for normality of observations and regression residuals. International Statistics Review, 55, 163-172. http://dx.doi.org/10.2307/1403192
Kosapattarapim, Chaiwat; Lin, Yan-Xia, & McCrae, Michael. (2011). Evaluating the volatility forecasting performance of best fitting GARCH models in emerging Asian stock markets. Centre for Statistical and Survey Methodology, University of Wollongong, Working Paper 13-11.
Lee, H. J. (2009). Forecasting performance of asymmetric GARCH stock market volatility
models. Journal of International Economic Studies, 13(2), 109–142. http:
//dx.doi.org/10.11644/ KIEP.JEAI. 2009.13.2.203.
Liu, H.C., & Hung J.C. (2010). Forecasting S&P-100 stock index volatility: The role of volatility asymmetry and distributional assumption in GARCH models. Expert Systems with Applications, 37, 4928-4934. http://dx.doi.org/10.1016/j.eswa.2009.12.022
Liu, H, Lee, Y., & Lee, M. (2009). Forecasting China Stock Markets Volatility via GARCH Models Under Skewed-GED Distribution. Journal of Money, Investment and Banking, 11.
Mandelbrot, B. (1963). The variation of certain speculative prices. Journal of Business, 36,
394-414. http://dx.doi.org/10.1086/294632
Markowitz, Harry. (1952). Portfolio Selection. The Journal of Finance, 7(1), 77-91.
http://dx.doi.org/10.1111/j.1540-6261.1952.tb01525.x
McMillan, D., Speight, A., & Apgwilym, O. (2000). Forecasting UK stock market volatility.
Applied Financial Economics, 10, 435–448. http://dx.doi.org/10.1080/09603100050031561
Miron, D., & Tudor, C. (2010). Asymmetric conditional volatility models: Empirical estimation and comparison of forecasting accuracy. Romanian Journal of Economic Forecasting, 3, 74–92.
Najand, M. (2002). Forecasting Stock Index Futures Price Volatility: Linear vs. Nonlinear Models. The Financial Review, 37, 93-104. http://dx.doi.org/10.1111/1540-6288.00006
Nelson, D. B. (1991). Conditional Heteroscedasticity in asset returns: A new approach.
Econometrica, 59(2), 347–370. http://dx.doi.org/10.2307/2938260
Olowe, R. A. (2009). Modelling Naira/Dollar Exchange Rate Volatility: Evidence from GARCH and Asymmetric Models. International Review of Business Research Papers, 5(3),
377-398.
Poterba, J. M., & Summers, L.H. (1986). The Persistence of Volatility and Stock Market Fluctuations. American Economic Review, 76, 1143-1151.
Raja, M., & M. Selvam, (2011). Measuring the time varying volatility of futures and options.
International Journal Applied Economic Finance, 5, 18-29.
http://dx.doi.org/10.3923/ijaef.2011.18.29
Rashid, A., & Ahmad, S. (2008). Predicting Stock Returns Volatility: An Evaluation of Linear vs. Nonlinear Methods. International Research Journal of Finance and Economics, 20.
Rousan, R., & Al-Khouri, R. (2005). Modeling Market Volatility in Emerging Markets in the Case of daily Data in Amman Stock Exchange 1992-2004. International Journal of Applied Econometrics and Quantitative Studies, 2(4), 99-118.
Su, C. (2010). Application of EGARCH model to estimate financial volatility of daily returns: The empirical case of China. University of Gothenburg, Master Degree Project No. 2010:142.
Taylor, S. (1994). Modelling Stochastic Volatility: A Review and Comparative Study.
Mathematical Finance, 4, 183-204. http://dx.doi.org/10.1111/j.1467-9965.1994.tb00057.x
Tse, Y. K. (1991). Stock return volatility in the Tokyo Stock Exchange. Japan and the World Economy, 3, 285–98. http://dx.doi.org/10.1016/0922-1425(91) 90011-Z
Yalama, A., & Sevil, G. (2008). Forecasting world stock markets volatility. International Research Journal of Finance and Economics, 15, 159–174.