R E S E A R C H
Open Access
Polymorphisms of
PTPN11
gene could influence
serum lipid levels in a sex-specific pattern
Zhi-Fang Jia
1, Xue-Yuan Cao
2, Dong-Hui Cao
1, Fei Kong
1, Punyaram Kharbuja
2and Jing Jiang
1*Abstract
Background:Previous studies have reported that different genotypes ofPTPN11gene (protein tyrosine
phosphatase, non-receptor 11) were associated with different levels of serum lipids. The aim of this study was to
explore the relationship between single nucleotide polymorphisms (SNPs) ofPTPN11and serum lipids in Northeast
Chinese.
Methods:A total of 1003 subjects, 584 males and 419 females, were included in the study and their serum lipids
were determined. Five htSNPs (rs2301756, rs12423190, rs12229892, rs7958372 and rs4767860) ofPTPN11gene were
genotyped using TaqMan assay method.
Results:All of the five SNPs were in Hardy-Weinberg equilibrium. The male subjects had higher triglyceride (TG), higher low-density lipoprotein cholesterol (LDL-C) and lower high-density lipoprotein cholesterol (HDL-C) level than females. In males, rs4767860 was found to be associated with serum TG and total cholesterol (TC) levels and rs12229892 was associated with TC level. However, these significant associations could not be observed in females. In females, rs2301756 was found to be associated with TG and rs7958372 was associated with LDL-C level.
Haplotype analysis showed that the GCGTG haplotype was associated with slightly higher TG level and ATGCG with higher TC level.
Conclusions:SNPs ofPTPN11may play a role in serum lipids in a sex-specific pattern. However, more studies are needed to confirm the conclusion and explore the underlying mechanism.
Keywords:PTPN11, Single nucleotide polymorphism (SNP), Triglyceride (TG), Total cholesterol (TC), Low-density lipoprotein cholesterol (LDL-C), High-density lipoprotein cholesterol (HDL-C)
Introduction
Dyslipidemia such as the increased levels of total choles-terol (TC), triglyceride (TG) or the decreased level of high-density lipoprotein cholesterol (HDL-C) has been concluded to be involved in the higher risk of cardiac-cerebral vascular disease [1–3] and has become a serious public health problem [4]. It is a complex trait that many factors, environmental and genetic [5,6], have been reported to be associated with it. However, these factors could only explain part of the total variance, and more factors need to be identified.
Src homology-2 domain-containing protein tyrosine phosphatase 2 (SHP2), a ubiquitously expressed protein tyrosine phosphatase, plays an essential role in many cell
signaling events such as metabolic control and transcrip-tion regulatranscrip-tion [7,8]. SHP2 could regulate the apoB (apolipoprotein B) secretion in insulin-dependent pat-tern via phosphatidylinositol 3′-kinase [9,10]. SHP2 activity was associated with the expression of the fatty acid-metabolizing enzyme Acyl-CoA synthetase 4 (ACSL4) [11] and the synthesis of steroid [12]. SHP2 deletion mice could develop a profile of higher serum levels of cholesterol, TG, and low-density lipoprotein [8]. Single nucleotide polymorphisms (SNPs) of protein tyro-sine phosphatase, non-receptor 11 (PTPN11) gene, which encodes SHP2, may be associated with serum lipid levels via changing the activity of SHP2 on lipometabolism.
Jamshidi et al. first reported that one of the tagging SNPs of the PTPN11 gene, rs11066320, was associated with serum low-density lipoprotein cholesterol (LDL-C) level in normal Caucasian female twins [13] and Lu et al. * Correspondence:[email protected]
1
Division of Clinical Epidemiology, First Hospital of Jilin University, Changchun 130021, China
Full list of author information is available at the end of the article
reported that rs11066322 was associated with plasma HDL-C level. The data from Hapmap database show that variants ofPTPN11gene present great varieties in differ-ent ethnicities. The role of PTPN11gene on lipid profile has not been described in Chinese so far. The aim of this study was to explore the association of tagging SNPs of PTPN11gene and lipid levels in Chinese normal people.
Methods
Subjects
From January to December 2009, people who attended the physical examination center of the First Hospital of Jilin University were invited to the study. A total of 1080 per-sons signed the informed consent and agreed to participate in this study. Subjects who had been taking lipid-lowing medication were excluded from the analysis (n= 73). At last, 1003 subjects, 584 males and 419 females, were in-cluded in the analysis. The range of age was from 35 to 79 years, with a median of 49 years. This study protocol was approved by the ethics committee of the First Hospital of Jilin University.
Venous blood samples were obtained from all subjects after overnight fasting. The levels of serum TC, TG, HDL-C and LDL-C were determined by enzymatic methods in an autoanalyzer (Type 7600; Hitachi Ltd., Japan) in our Clin-ical Laboratory Center. The inter-day coefficient variations (CV) of the two distinct analyte levels (Bio-Rad, USA) of the lab were 3.17% and 3.90% for TC, 2.74% and 2.64% for TG, 3.85% and 4.08% for HDL-C, 3.72% and 3.37% for LDL-C during the researching period.
Tagging SNPs selection and genotyping
SNP tagging was to identify a set of SNPs that efficiently tags all known SNPs. Haplotype tagging SNPs (htSNPs) were selected from the Han Chinese data in the HapMap Project (06-02-2009 HapMap) using the SNPbrowser™ Software v4.0 to capture SNPs with a minimum minor allele frequency (MAF) of 0.05 with a pair-wise r square of 0.8 or greater [14]. There were nine SNPs at MAF > 0.05 in thePTPN11gene in Chinese on HapMap, all of which were located in non-coding regions. Five SNPs, rs2301756, rs12423190, rs12229892, rs7958372 and rs4767860, were selected as htSNPs for further study.
Genomic DNA was extracted from whole blood follow-ing the protocols provided by the manufacturer (Axygen, USA). Genotypes of each SNP were determined using TaqMan SNP genotying assays (Applied Biosystems, USA) and the detailed process of polymerase chain reaction (PCR) was described elsewhere [15]. The amplified prod-ucts of PCR were read on ABI PRISM 7900 Sequence Detector in the end-point mode and genotypes were iden-tified using the Allelic Discrimination Sequence Detector Software V2.3.
Statistical analysis
Categorical data were described as frequency and percent-age and compared usingχ2test or Fisher exact test when appropriate. Continuous variables were summarized as median (25th to 75th percentiles) and compared by Kraskal-Wallis test among groups. The frequencies of ge-notypes of each SNP were determined via direct counting and deviation from Hardy-Weinberg equilibrium was assessed by a goodness-of-fit χ2 test. Levels of TC, TG, HDL-C and LDL-C were transformed to their logarithms to improve the normality of distribution. Associations of the SNPs and lipid levels were assessed using analysis of covariance within each gender type, adjusted for age, body mass index (BMI) and waist circumference. The above analyses were performed in SAS 9.1.3 software (SAS Insti-tute Inc, USA). For haplotypes with frequencies >1%, their associations with lipids were assessed compared to the most common haplotype using the linear regression model with the HAPSTAT software 3.0 [16]. The statistical significance wasP< 0.05.
Results
The baseline characteristics of the subjects are shown in Table 1. The body mass index (BMI) was higher than 24.0 Kg/m2in half of the subjects (the median value of BMI was 24.0 Kg/m2, with a quartile range from 21.9 to 26.1 Kg/m2). No difference was observed between males and females in terms of age, but BMI and waist circum-ference were higher in males than in females.
The linkage disequilibrium structure of the five SNPs studied, rs2301756, rs12423190, rs12229892, rs7958372 and rs4767860 is presented in Table 2. They were all in linkage disequilibrium, though to different extents. All of the five SNPs were in Hardy-Weinberg equilibrium (P= 0.540, 0.354, 0.778, 0.858, 0.489, respectively). There were no significant differences in the distribution of geno-types between males and females (Table 1). And no differ-ences were observed among genotypes of each SNP in terms of age, sex, BMI and waist circumference (data were not shown).
rs4767860, were found to have slightly higher serum TC compared to subjects with genotype AA (5.13 v.s. 4.98 mmol/L, P= 0.021) in males. The median levels of HDL-C and LDL-C were 1.27 mmol/L and 3.10 mmol/L, respectively, and no SNP was found to be related to them.
In females, however, the results were different. Female subjects had lower TG (1.21 v.s. 1.61 mmol/l), lower LDL-C (3.00 v.s. 3.10 mmol/L) and higher HDL-C (1.48
v.s. 1.27 mmol/L) level than males. The SNPs which were found to be significantly associated with TC or TG level in males could not be repeated in females. However, two other SNPs, rs2301756 and rs7958372, were found to be significantly associated with lipid level in females. The AA genotype of rs2301756 (P= 0.005) was found to be associ-ated with higher serum TG level and the CC genotype of rs7958372 (P= 0.019) was associated with higher LDL-C
Table 1 Characteristics of subjects included
All (n= 1003) Male (n= 584) Female (n= 419) P
Age (year) 49 (45–55) 49 (45–54) 48 (44–56) 0.640
Waist (cm) 85 (77–92) 90 (84–94) 77 (72–83) <0.001
BMI (Kg/m2) 24.0 (21.9–26.2) 24.9 (23.0–26.7) 22.6 (20.7–24.9) <0.001 TG (mmol/L) 1.44 (0.98–2.12) 1.61 (1.16–2.44) 1.21 (0.84–1.73) <0.001
TC (mmol/L) 5.04 (4.49–5.66) 5.03 (4.48–5.68) 5.09 (4.52–5.64) 0.669
HDL-C (mmol/L) 1.33 (1.15–1.56) 1.27 (1.10–1.45) 1.48 (1.27–1.70) <0.001 LDL–C (mmol/L) 3.09 (2.63–3.60) 3.10 (2.69–3.63) 3.00 (2.53–3.54) <0.001 rs2301756
GG 750 (74.8%) 439 (75.2%) 311 (74.2%) 0.625
GA 232 (23.1%) 131 (22.4%) 101 (24.1%)
AA 21 (2.1%) 14 (2.4%) 7 (1.7%)
rs12423190
TT 515 (51.3%) 304 (52.0%) 211 (50.4%) 0.782
TC 399 (39.8%) 227 (38.9%) 172 (41.0%)
CC 89 (8.9%) 53 (9.1%) 36 (8.6%)
rs12229892
GG 342 (34.1%) 189 (32.4%) 153 (36.5%) 0.271
GA 485 (48.4%) 285 (48.8%) 200 (47.7%)
AA 176 (17.5%) 110 (18.8%) 66 (15.8%)
rs7958372
TT 751 (74.9%) 439 (75.2%) 312 (74.5%) 0.962
TC 235 (23.4%) 135 (23.1%) 100 (23.9%)
CC 17 (1.7%) 10 (1.7%) 7 (1.7%)
rs4767860
AA 335 (33.4%) 198 (33.9%) 137 (32.7%) 0.666
GA 480 (47.9%) 282 (48.3%) 198 (47.3%)
GG 188 (18.7%) 104 (17.8%) 84 (20.0%)
Unless indicated, data were described as median (Q1–Q3).
Table 2 The linkage disequilibrium coefficient (Lewontin’sD’and r2) between SNPs of PTPN11
rs2301756 rs12423190 rs12229892 rs7958372 rs4767860
rs2301756 – 0.038 0.103 0.871 0.194
rs12423190 0.774 – 0.289 0.055 0.509
rs12229892 0.953 1.000 – 0.107 0.512
rs7958372 0.944 0.937 0.984 – 0.201
rs4767860 0.956 0.968 0.980 0.982 –
Table 3 Associations between SNPs ofPTNP11and lipid levels stratified by gender
Frequency (%)
TG TC HDL-C LDL-C
Median (Q1–Q3) P Median (Q1–Q3) P Median (Q1–Q3) P Median (Q1–Q3) P
Male (n= 584)
rs2301756
GG 439 (75.2) 1.59 (1.09–2.37) – 5.02 (4.45–5.63) – 1.25 (1.10–1.43) – 3.10 (2.68–3.61) – GA 131 (22.4) 1.63 (1.20–2.47) 0.319 5.07 (4.52–5.84) 0.161 1.30 (1.10–1.47) 0.164 3.10 (2.68–3.74) 0.236 AA 14 (2.4) 1.74 (1.19–2.85) 0.516 5.03 (4.76–5.32) 0.877 1.30 (1.12–1.60) 0.572 2.98 (2.75–3.65) 0.969 rs12423190
TT 304 (52.0) 1.57 (1.08–2.44) – 4.99 (4.46–5.57) – 1.27 (1.10–1.47) – 3.10 (2.65–3.62) – TC 227 (38.9) 1.67 (1.26–2.33) 0.184 5.10 (4.49–5.74) 0.411 1.26 (1.09–1.42) 0.309 3.14 (2.70–3.63) 0.380 CC 53 (9.1) 1.64 (1.08–2.68) 0.120 5.07 (4.49–5.76) 0.219 1.30 (1.07–1.51) 0.203 3.00 (2.72–3.70) 0.595
rs12229892
GG 189 (32.4) 1.67 (1.21–2.53) – 5.13 (4.53–5.72) – 1.30 (1.10–1.47) – 3.11 (2.70–3.67) – GA 285 (48.8) 1.61 (1.20–2.45) 0.405 5.02 (4.49–5.64) 0.106 1.23 (1.10–1.41) 0.988 3.14 (2.67–3.66) 0.386 AA 110 (18.8) 1.41 (0.96–2.16) 0.009 4.96 (4.35–5.50) 0.118 1.29 (1.14–1.49) 0.562 3.08 (2.64–3.57) 0.354 rs7958372
TT 439 (75.2) 1.59 (1.10–2.37) – 5.03 (4.46–5.64) – 1.25 (1.10–1.43) – 3.10 (2.69–3.61) – TC 135 (23.1) 1.64 (1.20–2.47) 0.351 5.05 (4.54–5.77) 0.200 1.30 (1.10–1.47) 0.197 3.10 (2.68–3.74) 0.260 CC 10 (1.7) 1.89 (1.22–2.85) 0.619 4.86 (4.56–5.28) 0.648 1.30 (1.12–1.45) 0.615 2.94 (2.61–3.65) 0.535 rs4767860
AA 198 (33.9) 1.53 (1.02–2.37) – 4.98 (4.42–5.51) – 1.25 (1.10–1.45) – 3.10 (2.60–3.60) – GA 282 (48.3) 1.63 (1.20–2.41) 0.024 5.03 (4.48–5.68) 0.185 1.28 (1.09–1.43) 0.973 3.10 (2.67–3.60) 0.252 GG 104 (17.8) 1.64 (1.22–2.64) 0.028 5.13 (4.56–5.80) 0.021 1.30 (1.10–1.47) 0.598 3.15 (2.75–3.71) 0.084 Female (n= 419)
rs2301756
GG 311 (74.2) 1.19 (0.83–1.71) – 4.94 (4.49–5.60) – 1.48 (1.27–1.69) – 2.98 (2.50–3.43) – GA 101 (24.1) 1.25 (0.85–1.85) 0.780 5.23 (4.72–5.87) 0.071 1.51 (1.27–1.76) 0.283 3.12 (2.66–3.69) 0.083 AA 7 (1.7) 2.33 (1.14–3.20) 0.005 5.02 (4.53–6.20) 0.300 1.37 (1.21–1.59) 0.605 3.16 (2.42–3.84) 0.555 rs12423190
TT 211 (50.4) 1.25 (0.82–1.75) – 5.03 (4.53–5.67) – 1.50 (1.27–1.71) – 3.04 (2.57–3.56) – TC 172 (41.0) 1.18 (0.87–1.64) 0.592 5.12 (4.47–5.68) 0.709 1.46 (1.26–1.66) 0.149 3.00 (2.47–3.56) 0.759 CC 36 (8.6) 1.10 (0.80–1.99) 0.388 5.00 (4.64–5.32) 0.877 1.40 (1.22–1.74) 0.184 2.97 (2.52–3.35) 0.895 rs12229892
GG 153 (36.5) 1.21 (0.85–1.71) – 5.11 (4.57–5.64) – 1.48 (1.26–1.70) – 3.00 (2.65–3.48) – GA 200 (47.7) 1.23 (0.86–1.74) 0.497 5.04 (4.45–5.67) 0.599 1.45 (1.27–1.68) 0.880 3.00 (2.51–3.60) 0.873 AA 66 (15.8) 1.19 (0.80–1.68) 0.232 5.07 (4.60–5.61) 0.463 1.53 (1.30–1.77) 0.128 3.07 (2.67–3.40) 0.526 rs7958372
TT 312 (74.5) 1.19 (0.83–1.71) – 4.95 (4.50–5.60) – 1.48 (1.27–1.69) – 2.98 (2.51–3.44) – TC 100 (23.9) 1.25 (0.87–1.88) 0.787 5.22 (4.67–5.93) 0.090 1.52 (1.26–1.76) 0.319 3.10 (2.62–3.63) 0.278 CC 7 (1.7) 1.92 (0.85–2.33) 0.201 5.02 (4.68–6.20) 0.183 1.31 (1.21–1.59) 0.418 3.48 (3.16–4.06) 0.019 rs4767861
level when compared to their most common genotype (Table 3). None of the five SNPs was observed to be asso-ciated with TC or HDL-C level.
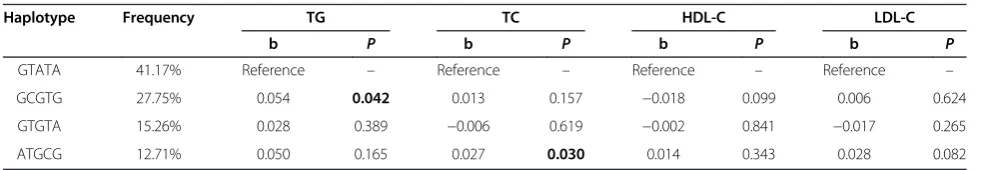
Because of the linkage disequilibrium, 18 haplotypes were observed using HAPSTAT software which estimated haplotype frequencies based on an EM algorithm and only four of them had the frequencies greater than 1% (Table 4). The GCGTG haplotype, with an estimated frequency of 27.75%, was found to be significantly associated with the increased level of serum TG compared to the most com-mon haplotype GTATA (41.17%) after adjusting for age, sex, BMI and waist circumference (The slope of the linear regression is 0.054, P = 0.042). The ATGCG haplotype (12.71%) was found to be associated with slightly higher TC level (The slope of the linear regression is 0.027, P= 0.030). None of the haplotypes was found to be associ-ated with HDL-C or LDL-C.
Discussion
The results of our study showed that lipid profile was different between males and females that the serum TG and LDL-C levels were higher and HDL-C lower in males than in females. But no difference was observed in the level of TC. These results were similar to those of previous reports [17,18].
The associations between SNPs of PTPN11 gene and serum lipid levels in 1003 Chinese people presented a sex-specific pattern though the distribution of genotypes had no differences between the two sexes. Rs4767860 and rs12229892 were associated with TG level in males, but these significant associations could not be observed in females. In females, the genotype AA of rs2301756 was found to be associated with higher TG compared to the most common genotype GG. The SNP of rs4767860 was associated with TC in males but no SNP was related to TC in females.
Genotypes of SNPs of PTPN11varied in different eth-nicities. In our study, the genotypes of GG, GA and AA of rs2301756 were 75.2%, 22.4% and 2.4%, respectively. They were similar to those of Japanese (62.1%, 32.9% and 5.0%, respectively) [19] but absolutely different from those of Caucasian (0.5%, 13.2% and 86.3%, respectively) [13]. The data from Hapmap show that rs12229892 and
rs4767860 are very rare or do not exist in Caucasian and African Americans while in Chinese and Japanese these two SNPs are very common. The A allele of rs12229892 was 41.7% and G allele of rs4767860 was 42.7% in our study. The C allele of rs7958372 in HapMap database is the dominant allele in Caucasian while in Asian it is the minor allele (13.4% in our study). Considering the diver-sity of variants of PTPN11 in different ethnicities, the positive associations observed in our study might not be repeated in other ethnic populations.
The PTPN11 gene, which encodes SHP2, has been reported to be associated withhelicobacter pylori-related gastric atrophy [15,20] and gastric cancer [21]. Jamshidi et al. [13] first selected three htSNPs of PTPN11 gene (rs2301756, rs11066320 and rs11066322) and assessed their associations with serum lipid levels in a Caucasian female population. They found that subjects with AA genotype of rs11066320 had lower LDL-C by 2.6% com-pared to subjects with GG genotype. They also observed a non-significant increasing trend of TG level from 1.26 mmol/L in rs11066322 GG genotype carriers to 1.47 mmol/L of AA genotype carriers. Lu et al. [22] reported that genotype AA of rs11066322 of PTPN11 was associated with the higher plasma HDL-C levels. However, the htSNPs were different in Chinese popula-tion. One of the SNPs, rs11066320, which had MAF > 0.05 in Caucasian, did not exist in Chinese and Japanese [19]. Rs2301756 and rs11066322 were in complete dis-equilibrium that rs11066322 could not be chosen as htSNP. Okada et al. [19] reported that the HDL-C levels were different in the non-smokers and the current smokers within the same rs2301756 genotype, however, the role of rs2301756 was not assessed. In our study, rs2301756 was associated with TG level in females that subjects of AA genotype had higher TG than subjects of GG genotype. The mechanism underlying these associa-tions was still in the stage of hypothesis which stated that the SNPs ofPTPN11might change the expression of the gene and consequently influenced the protein encoded, SHP2, which could regulate lipometabolism [9,10].
Two limitations should be noted in our study. The first one was only htSNPs with MAF > 5% were studied. We could not rule out the possibility that other SNPs,
Table 4 Haplotype analysis of SNPs ofPTPN11on the lipid levels
Haplotype Frequency TG TC HDL-C LDL-C
b P b P b P b P
GTATA 41.17% Reference – Reference – Reference – Reference –
GCGTG 27.75% 0.054 0.042 0.013 0.157 −0.018 0.099 0.006 0.624
GTGTA 15.26% 0.028 0.389 −0.006 0.619 −0.002 0.841 −0.017 0.265
ATGCG 12.71% 0.050 0.165 0.027 0.030 0.014 0.343 0.028 0.082
Differences between haplotype groups were assessed using the linear regression model adjusted for age, sex, BMI and waist circumference.Pvalue in bold indicated the difference was significant comparing to the most common haplotype group (P<0.05).
especially the rare SNPs, were associated with the lipid levels, as SNPs with low minor frequency had been reported to be associated with lipid profile [23–26]. Se-quencing of the whole gene might be the solution. The an-other limitation was that the influence of life style on lipid levels could not be assessed because of the design, as pre-vious studies had reported that lifestyle factors such as cigarette or alcohol consuming could affect lipid profile [27,28]. More rigorous design would be performed in the future study.
Conclusions
In summary, we found that SNPs of PTPN11gene were associated with serum lipid levels in a sex-specific pattern. Rs12229892 and rs4767860 may play an important role in lipid profile in males, and rs2301756 and rs7958372 may be related to TG and LDL-C levels in females. Further studies are needed to explore the mechanism on how PTPN11SNPs exert their effects on lipid profile.
Abbreviations
SNPs:Single nucleotide polymorphisms;PTPN11: Protein tyrosine phosphatase, non-receptor 11; TG: Triglyceride; TC: Total cholesterol; HDL-C: High-density lipoprotein cholesterol; LDL-HDL-C: Low-density lipoprotein cholesterol; SHP2: Src homology-2 domain-containing protein tyrosine phosphatase 2; BMI: Body mass index; htSNPs: Haplotype tagging SNPs; MAF: Minor allele frequency; PCR: Polymerase chain reaction.
Competing interests
The authors declare that they have no competing interests.
Authors’contributions
JJ and XYC designed the study. ZFJ, XYC, DHC and FK performed the experiments. ZFJ and JJ analyzed the data and wrote the first draft of manuscript. JJ and PK revised the manuscript. All authors read and approved the final manuscript.
Acknowledgements
This study was supported by the National Natural Science Foundation of China (Grant No. 81072369 and 30940060) and the Natural Science Fund of Jilin Province (Grant No: 201215035). The authors would like to thank all of those who participating in this study, especially to Chang-Song Guo for his work on sample collection.
Author details
1Division of Clinical Epidemiology, First Hospital of Jilin University,
Changchun 130021, China.2Department of Gastrointestinal Surgery, First Hospital of Jilin University, Changchun 130021, China.
Received: 15 March 2013 Accepted: 10 May 2013 Published: 14 May 2013
References
1. Castelli WP, Anderson K, Wilson PW, Levy D:Lipids and risk of coronary heart disease. The Framingham Study.Ann Epidemiol1992,2:23–28. 2. Kannel WB, Gordon T, Dawber TR:Role of lipids in the development of
brain infarction: the Framingham study.Stroke1974,5:679–685. 3. Boden WE:High-density lipoprotein cholesterol as an independent risk
factor in cardiovascular disease: assessing the data from Framingham to the Veterans Affairs High–Density Lipoprotein Intervention Trial. Am J Cardiol2000,86:19L–22L.
4. Gu D, Reynolds K, Wu X, Chen J, Duan X, Reynolds RF, Whelton PK, He J:
Prevalence of the metabolic syndrome and overweight among adults in China.Lancet2005,365:1398–1405.
5. Thomsen SB, Rathcke CN, Skaaby T, Linneberg A, Vestergaard H:The association between genetic variations of CHI3L1, levels of the encoded glycoprotein YKL-40 and the lipid profile in a danish population.PLoS One2012,7:e47094.
6. Yin RX, Wu DF, Miao L, Aung LH, Cao XL, Yan TT, Long XJ, Liu WY, Zhang L, Li M:Several genetic polymorphisms interact with overweight/obesity to influence serum lipid levels.Cardiovasc Diabetol2012,11:123.
7. Lauriol J, Kontaridis MI:PTPN11-associated mutations in the heart: has LEOPARD changed its RASpots?Trends Cardiovasc Med2011,21:97–104. 8. Krajewska M, Banares S, Zhang EE, Huang X, Scadeng M, Jhala US, Feng GS,
Krajewski S:Development of diabesity in mice with neuronal deletion of Shp2 tyrosine phosphatase.Am J Pathol2008,172:1312–1324. 9. Ugi S, Maegawa H, Kashiwagi A, Adachi M, Olefsky JM, Kikkawa R:
Expression of dominant negative mutant SHPTP2 attenuates
phosphatidylinositol 3′-kinase activity via modulation of phosphorylation of insulin receptor substrate-1.J Biol Chem1996,271:12595–12602. 10. Phung TL, Roncone A, Jensen KL, Sparks CE, Sparks JD:Phosphoinositide
3-kinase activity is necessary for insulin-dependent inhibition of apolipoprotein B secretion by rat hepatocytes and localizes to the endoplasmic reticulum.J Biol Chem1997,272:30693–30702. 11. Cooke M, Orlando U, Maloberti P, Podestá EJ, Maciel FC:Tyrosine
phosphatase SHP2 regulates the expression of acyl-CoA synthetase ACSL4.J Lipid Res2011,52:1936–1948.
12. Cooke M, Mele P, Maloberti P, Duarte A, Poderoso C, Orlando U, Paz C, Cornejo Maciel F, Podesta EJ:Tyrosine phosphatases as key regulators of StAR induction and cholesterol transport: SHP2 as a potential tyrosine phosphatase involved in steroid synthesis.Mol Cell Endocrinol2011,
336:63–69.
13. Jamshidi Y, Gooljar SB, Snieder H, Wang X, Ge D, Swaminathan R, Spector TD, O’Dell SD:SHP-2 and PI3-kinase genes PTPN11 and PIK3R1 may influence serum apoB and LDL cholesterol levels in normal women. Atherosclerosis2007,194:e26–e33.
14. De La Vega FM:Selecting single-nucleotide polymorphisms for association studies with SNPbrowser software.Meth Mol Biol2007,
376:177–193.
15. Jiang J, Jia ZF, Kong F, Jin MS, Wang YP, Tian S, Suo J, Cao X:Association of polymorphism of PTPN 11 encoding SHP-2 with gastric atrophy but not gastric cancer in helicobacter pylori seropositive Chinese population. BMC Gastroenterol2012,12:89.
16. Lin DY, Zeng D, Millikan R:Maximum likelihood estimation of haplotype effects and haplotype-environment interactions in association studies. Genet Epidemiol2005,29:299–312.
17. Kolovou V, Marvaki A, Karakosta A, Vasilopoulos G, Kalogiani A, Mavrogeni S, Degiannis D, Marvaki C, Kolovou G:Association of gender, ABCA1 gene polymorphisms and lipid profile in Greek young nurses.Lipids Health Dis
2012,11:62.
18. Bermudez OI, Velez-Carrasco W, Schaefer EJ, Tucker KL:Dietary and plasma lipid, lipoprotein, and apolipoprotein profiles among elderly hispanics and non-hispanics and their association with diabetes.Am J Clin Nutr
2002,76:1214–1221.
19. Okada R, Suzuki K, Nishio K, Ishida Y, Kawai S, Goto Y, Naito M, Wakai K, Ito Y, Hamajima N:Modification of the effect of smoking on cholesterol in Japanese carriers of a PTPN11 polymorphism.Mol Med Report2008,
1:595–598.
20. Zhu F, Loh M, Hill J, Lee S, Koh KX, Lai KW, Salto-Tellez M, Iacopetta B, Yeoh KG, Soong R:Genetic factors associated with intestinal metaplasia in a high risk Singapore-Chinese population: a cohort study.BMC Gastroenterol2009,9:76.
21. Hishida A, Matsuo K, Goto Y, Naito M, Wakai K, Tajima K, Hamajima N:
Associations of a PTPN11 G/A polymorphism at intron 3 with helicobactor pylori seropositivity, gastric atrophy and gastric cancer in Japanese.BMC Gastroenterol2009,9:51.
22. Lu Y, Dolle ME, Imholz S, Van’t Slot R, Verschuren WM, Wijmenga C, Feskens EJ, Boer JM:Multiple genetic variants along candidate pathways influence plasma high-density lipoprotein cholesterol concentrations. J Lipid Res2008,49:2582–2589.
23. Cohen JC, Kiss RS, Pertsemlidis A, Marcel YL, McPherson R, Hobbs HH:
Multiple rare alleles contribute to low plasma levels of HDL cholesterol. Science2004,305:869–872.
PCSK9 locus moderately lowers low-density lipoprotein cholesterol levels, but does not significantly lower vascular disease risk in an elderly population.Atherosclerosis2008,200:95–101.
25. Cohen JC, Boerwinkle E, Mosley TH Jr, Hobbs HH:Sequence variations in PCSK9, low LDL, and protection against coronary heart disease.N Engl J Med2006,354:1264–1272.
26. Hubacek JA, Wang WW, Skodova Z, Adamkova V, Vrablik M, Horinek A, Stulc T, Ceska R, Talmud PJ:APOA5 Ala315 > Val, identified in patients with severe hypertriglyceridemia, is a common mutation with no major effects on plasma lipid levels.Clin Chem Lab Med2008,46:773–777. 27. Cai H, Huang J, Xu G, Yang Z, Liu M, Mi Y, Liu W, Wang H, Qian D:
Prevalence and determinants of metabolic syndrome among women in Chinese rural areas.PLoS One2012,7:e36936.
28. Li Q, Wei XL, Yin RX:Association of ATP binding cassette transporter G8 rs4148217 SNP and serum lipid levels in Mulao and Han nationalities. Lipids Health Dis2012,11:46.
doi:10.1186/1476-511X-12-72
Cite this article as:Jiaet al.:Polymorphisms ofPTPN11gene could influence serum lipid levels in a sex-specific pattern.Lipids in Health and Disease201312:72.
Submit your next manuscript to BioMed Central and take full advantage of:
• Convenient online submission
• Thorough peer review
• No space constraints or color figure charges
• Immediate publication on acceptance
• Inclusion in PubMed, CAS, Scopus and Google Scholar
• Research which is freely available for redistribution