R E S E A R C H A R T I C L E
Open Access
Access to primary care for
socio-economically disadvantaged older people
in rural areas: exploring realist theory using
structural equation modelling in a linked
dataset
John A. Ford
1*, Andy Jones
1, Geoff Wong
2, Allan Clark
1, Tom Porter
3and Nick Steel
1Abstract
Background:Realist approaches seek to answer questions such as‘how?’,‘why?’,‘for whom?’,‘in what
circumstances?’and‘to what extent?’interventions‘work’ using context-mechanism-outcome (CMO) configurations. Quantitative methods are not well-established in realist approaches, but structural equation modelling (SEM) may be useful to explore CMO configurations. Our aim was to assess the feasibility and appropriateness of SEM to explore CMO configurations and, if appropriate, make recommendations based on our access to primary care research. Our specific objectives were to map variables from two large population datasets to CMO configurations from our realist review looking at access to primary care, generate latent variables where needed, and use SEM to quantitatively test the CMO configurations.
Methods:A linked dataset was created by merging individual patient data from the English Longitudinal Study of Ageing and practice data from the GP Patient Survey. Patients registered in rural practices and who were in the highest deprivation tertile were included. Three latent variables were defined using confirmatory factor analysis. SEM was used to explore the nine full CMOs. All models were estimated using robust maximum likelihoods and accounted for clustering at practice level. Ordinal variables were treated as continuous to ensure convergence. Results:We successfully explored our CMO configurations, but analysis was limited because of data availability. Two hundred seventy-six participants were included. We found a statistically significant direct (context to outcome) or indirect effect (context to outcome via mechanism) for two of nine CMOs. The strongest association was
between‘ease of getting through to the surgery’and‘being able to get an appointment’with an indirect mediated effect through convenience (proportion of the indirect effect of the total was 21%). Healthcare experience was not directly associated with getting an appointment, but there was a statistically significant indirect effect through convenience (53% mediated effect). Model fit indices showed adequate fit.
Conclusions:SEM allowed quantification of CMO configurations and could complement other qualitative and quantitative techniques in realist evaluations to support inferences about strengths of relationships. Future research exploring CMO configurations with SEM should aim to collect, preferably continuous, primary data.
* Correspondence:[email protected]
1Norwich Medical School, University of East Anglia, Chancellor’s Drive, Norwich, UK
Full list of author information is available at the end of the article
Background
Realist approaches have evolved over the past 20 years since Pawson and Tilley first developed realist evaluation [1]. Instead of asking ‘does an intervention work’, a real-ist evaluation seeks to answer questions such as ‘how?’, ‘why?’,‘for whom?’,‘in what circumstances?’and ‘to what extent?’ programmes or interventions‘work’. Realist re-view has since been developed by extending and adapt-ing some of the techniques from realist evaluation to literature reviewing [2,3]. Realist evaluation and reviews are pertinent because they mark a shift in thinking about interventions; from a success/failure spectrum to a con-textual understanding of whether, why and how, an inter-vention is more or less likely to work in certain situations.
The analytical building blocks of realist approaches are context-mechanism-outcome (CMO) configurations. Here a mechanism is triggered, under the right context, result-ing in an outcome. Realist approaches generate testable theories, based on CMO configurations to explain and understand how an intervention or programme works. They do not oppose quantitative techniques, but their place and purposes are less established within the field. Realist researchers are cautious about quantitative data because of concerns about trying to measure unobservable factors or reducing complex social changes to numerical values [4]. In addition, there are ontological and epistemo-logical concerns about using statistical techniques based on (post-) positivism which seek to compare averages using distributive data assumptions [5].
Structural equation modelling (SEM) is an established quantitative technique which combines both a meas-urement and structural component [6]. The measure-ment component allows identification of unobserved, or latent, variables usually through confirmatory factor analysis (CFA). For example, patient empowerment is an unobservable concept, but could be identified from several observed variables, such as confidence in knowing when to seek help, accessing services, raising concerns and find-ing solutions. These types of latent variables (such as pa-tient empowerment) are generally considered as reflective measures because patient empowerment leads confidence in knowing when to seek help, accessing services, raising concerns and finding solutions. Formative measures are the opposite and exist when the observed variables causes the latent variable. [7] For example, transport op-tions (formative variable) may be determined by car owner-ship, availability of public transport and mobility. There is a potential fit here between reflective measures and realist approaches because realist mechanisms are usually concep-tualised as being unobservable [8]. Therefore if we want to be able to measure them, then one possible approach is to use the concept of reflective measures. The structural com-ponent of SEM measures the relationship between latent or observable variables along a pre-specified path using
regression techniques. While CMOs are configurations, not correlations, they do have a natural sequential order of C-M-O and hence are potentially amenable to measurement.
Justification and study aim
Empirical quantitative data analysis techniques may be an additional means of testing realist theories and hence help to increase their plausibility. We do not propose that quantitative analyses would provide the answer or validate realist theory, but rather additional information to allow researchers to explore in more detail what works, for whom, in what circumstances and how. Therefore, our aim is to assess if it is feasible and appropri-ate to quantitatively model realist theory using structural equation modelling and, if so, make some recommendation on how this should be done based on our prior and con-tinuing research on access to primary care.
Theoretical underpinning of access to primary care
Previous research has found that older people and those in lower socio-economic groups or living in rural areas have worse access to health care [9]. There is likely to be a compounding effect when these co-exist; older, socio-economically disadvantaged people living in rural areas will find it difficult to see someone at their GP surgery. Poor access may lead to delayed diag-nosis [10], poor quality of care [11], higher mortality [12] and greater inequality [13]. We estimate that there are about 316,000 socio-economically disadvantaged older people living in England [14,15].
To understand the difficulties that socio-economically disadvantaged older people in rural areas face and to de-velop an intervention, we undertook a mixed methods study. The overarching protocol for this work is described elsewhere [16]. Briefly, we first undertook a realist review [17], followed by a qualitative study (submitted for publica-tion) and finally a quantitative analysis of the English Longi-tudinal Study of Ageing data (presented here). The realist review identified multiple contextual barriers to accessing primary care along a seven-step patient pathway [17]. Qualitative data, collected from semi-structured interviews with fifteen older people and four focus groups with health professionals, was used to refine each step in the pathway.
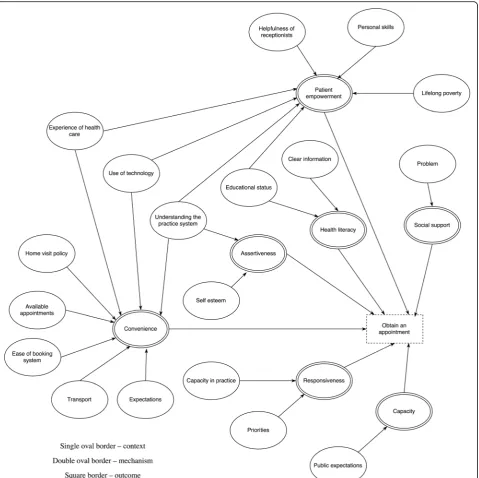
single step. To give one example, the context of ad-equate available appointments, triggers the mechanism of convenience which in turns increases the likelihood of obtaining an appointment. Contexts include concepts such as helpfulness of receptionists, available appoint-ments, ease of the booking system and lifelong poverty. Mechanisms included patient empowerment, social sup-port, health literacy, patient assertiveness, perceived con-venience, practice responsiveness and capacity within the GP surgery. Based on the realist review we were not able to identify which of the CMO configurations had
the greatest influence on the outcome of ‘Obtain an ap-pointment’. Here we explore if structure equation mod-elling might help with this.
Methods
Data sources and linkage
dataset of individual-level data from ELSA combined with GPpractice-leveldata from GPPS.
ELSA is a longitudinal face-to-face interview study of older people aged 50 and over. Data covering health, functioning, social participation, and economic position are collected every two years with biological and an-thropometric information gathered every four years. Wave 6 of ELSA (2012/3) has information on 10,601 individuals. The GPPS is undertaken by Ipsos MORI (a polling organ-isation) on behalf of NHS England and collects patients’ views on more than 99% of GP surgeries in England. Wave 7 of the data had two collection periods in summer 2012 and winter 2013. Questionnaires were sent to nearly 2.75 million patients over 18 years old who had been registered at their GP surgery for at least 6 months, across both data collection periods [18]; with 971,232 questionnaires returned (response rate 25.2%). Practice-level results are weighted to more accurately resemble the practice population. Full de-tails of weighting are described elsewhere [18].
GP surgery name and postcode were collected for 52% of participants in Wave 6 of ELSA, enabling linkage with GPPS. The datasets were linked based GP surgery post-code because this was present in both datasets and was more completely reported than the GP surgery name. Where two practices shared the same postcode, for ex-ample because of a shared site, but were lacking a complete surgery name, outputs averaged across both practices were used.
Patient selection
To be included participants had to be registered with a rural GP surgery, as defined by the Health and Social Care Infor-mation Centre, and belong to the lowest socio-economic class of the National Statistics Socio-economic three cat-egory classification. Only patients with both GPPS data and ELSA data were included.
Variable selection and measurement model
First, all possible variables from ELSA and GPPS were mapped to our pre-specified theoretical realist model of CMO configurations (i.e. Fig.1, full methods and findings from our realist review are published elsewhere [17]). We then, through discussion and looking at previously pub-lished studies, identified the best variable for observable concepts, or associated variables for latent concepts, for each individual CMO concept from the dataset. No vari-ables fitted for the following pre-specified theoretical con-cepts: patient empowerment, clinical problem, public expectations, capacity (in primary care), responsiveness (of primary care), priorities (for primary care), health care expectations, available appointments and home visit pol-icy. Therefore, data were available for nine complete CMOs (i.e. data available for context, mechanism and outcome).
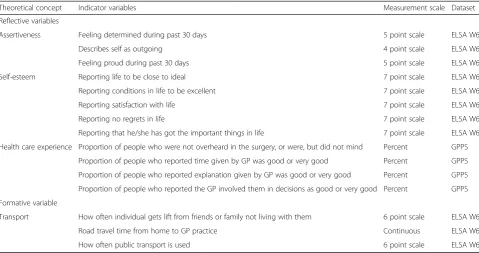
For unobservable concepts with sufficient data avail-ability, confirmatory factor analysis was used to explore the dimensionality of the latent variables. Observable variables which did not statistically significantly contrib-ute to the latent variable were removed. Initially mixed CFAs, combining continuous and categorical data were attempted, but this resulted in significant problems with the models, such as poor model fit or non-convergence. Therefore ordinal data, such a Likert scales, were treated as continuous variables. In total there were three latent, one formative variable and eight observed variables as shown in Tables 1 and 2. Health literacy was not col-lected in wave 6, therefore wave 5 data was used. The in-dicators for each latent variable are described below.
Healthcare experience was measured using four
questions from the GPPS about quality of care. Other quality of care measures from the GPPS were dropped because they were highly correlated or did not statistically significantly contribute to the model, such as GP listening or if the patient would
recommend the surgery to someone moving to the area. Quality of care measures in ELSA were not included because the low number of patients with data.
Assertiveness was not measured in the dataset.
Therefore we constructed a latent variable consisting of three variables exploring
determination, outgoingness and pride because these have been theoretically linked with assertiveness [19–21].
Self-esteem was not directly measured in the
dataset. Therefore we constructed a latent variable consisting of questions from the Satisfaction with Life Scale, which has a high correlation with self-esteem [22].
Transport was the only formative measure. It con-sisted of three questions about getting lifts from friends and family, use of public transport and travel time from home to GP surgery. Use of car and community trans-port were initially included, but these were dropped be-cause of low variance. Travel time was calculated using network analysis within Geographic Information System Software (ArcGIS 10.3). This involved georeferencing the postcodes of both the GP surgery and participant’s home, followed by calculating the travel time using an establish network dataset with road data, split by urban and rural motorways, A and B class roads and minor ones.
Structural model
analysis for each individual CMO configuration (data not presented), followed by those CMOs with a common mechanism/mediator (data not presented) and, finally, the full model with all CMOs in the same model. Analysis was clustered at the practice level. The model was ana-lysed using robust maximum likelihoods which estimate robust standard errors that are robust to non-normal data and dependent observations. We used this method be-cause observations were clustered at the practice level and ordinal data treated in a continuous manner. The resulting estimates are standard maximum likelihood estimates. Re-sults standardised by both latent and observed variable variances are used to allow comparison between regres-sion coefficients. Therefore the standardised regresregres-sion
coefficients should be interpreted as the amount of change in an outcome variable per standard deviation unit of pre-dictor variable.
Model fit was assessed using Root Mean Square Error of Approximation (RMSEA), Comparative Fit Index (CFI) and Tucker-Lewis Index (TLI). Based on Hu and Bentler [23], we considered a RMSEA of less than 0.06, CFI and TFI of more than 0.95 as a good fit. The chi squared value for model fit is not reported because of the use of maximum likelihood estimation with robust standard errors. Only model modifications which could be theoretically justified were made. Based on the modi-fication indices function within Mplus, three minor modifications were undertaken to correlate three factor
Table 1Reflective and formative variables
Theoretical concept Indicator variables Measurement scale Dataset
Reflective variables
Assertiveness Feeling determined during past 30 days 5 point scale ELSA W6
Describes self as outgoing 4 point scale ELSA W6
Feeling proud during past 30 days 5 point scale ELSA W6
Self-esteem Reporting life to be close to ideal 7 point scale ELSA W6
Reporting conditions in life to be excellent 7 point scale ELSA W6
Reporting satisfaction with life 7 point scale ELSA W6
Reporting no regrets in life 7 point scale ELSA W6
Reporting that he/she has got the important things in life 7 point scale ELSA W6
Health care experience Proportion of people who were not overheard in the surgery, or were, but did not mind Percent GPPS
Proportion of people who reported time given by GP was good or very good Percent GPPS
Proportion of people who reported explanation given by GP was good or very good Percent GPPS
Proportion of people who reported the GP involved them in decisions as good or very good Percent GPPS
Formative variable
Transport How often individual gets lift from friends or family not living with them 6 point scale ELSA W6
Road travel time from home to GP practice Continuous ELSA W6
How often public transport is used 6 point scale ELSA W6
ELSAEnglish Longitudinal Study of Ageing,W6wave 6,GGPSGP Patient Survey
Table 2Observed variables
Theoretical concept Variable Type Dataset
Health literacy Number of correct health literacy tests 5 point
scale
ELSA W5
Education Level of educational qualification Categorical ELSA
W6
Technology Frequency of using the internet 6 point
scale
ELSA W6
Convenience Proportion of people who found the appointment very or fairly convenient Percent GPPS
Ease at booking Proportion of people who wound it very or fairly easy to get through to someone at the surgery
Percent GPPS
Clear information Proportion of people who know how to contact out of hours Percent GPPS
Obtaining an appointment
Proportion that were able to get appointment when needed Percent GPPS
variables within the self-esteem latent variable which were judged to be theoretically justifiable by the research team. Stata [24] was used to prepare the data and MPlus [25] to undertake the analysis.
Results
Wave 6 of ELSA included 10,601 participants. GP data was available for 5482 of these (52%) and basic demo-graphic data between those who did and those who did not have GP data is shown in Additional file1: Table S1. The group with GP data had a similar proportion of fe-males but slightly more people aged 60–80 years old or in a higher socio-economic position. Of the 5482 partici-pants with GP data, 984 belonged to practices which were classified as rural and 4498 to practices classified as urban. Of the 984 patients belonging to a rural prac-tice, 276 patients were also in the lowest socio-economic class, representing 178 different GP surgeries, and there-fore 276 patients were included in the final analysis.
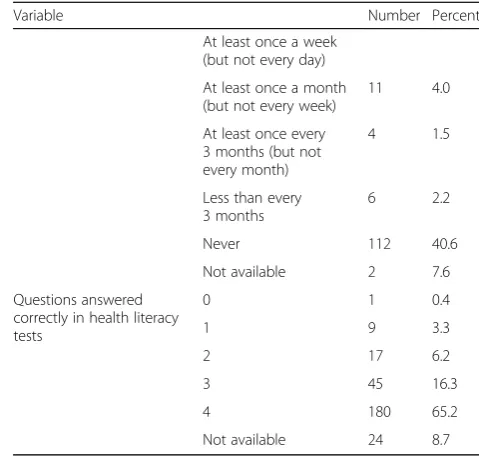
The baseline characteristics of included participants are shown in Table 3. There were slightly more females than males. Most people did not have a higher education qualification and their main occupations were routine or semi-routine. About one third of participants used public transport at least 2 or 3 times a month. The me-dian road travel time to the GP surgery was 4.80 min (inter-quartile range 2.76 to 7.88). Only a third of par-ticipants received lifts from friends or family who did not live with them. A third of participants used the internet or email every day and 40% never did. Most people scored highly on the health literacy tests.
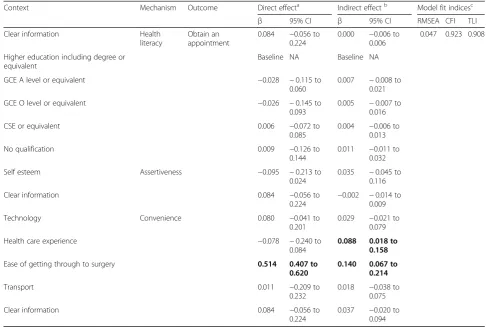
Figure2shows the standardised regression coefficients for paths within the structural model, except for the standardised direct regression coefficients from context to outcome which are presented separately in Table4to retain clarity. Table 4 also presents the standardised in-direct estimates and model fit. Model fit indices showed adequate fit–RMSEA was less 0.06 which is considered a good model fit, but CFI and TLI were less than 0.95 (0.923 and 0.908 respectively) indicating a less than good fit. We did not find any statistically significant direct or indirect effect for seven of the nine CMOs. The stron-gest association was between the ease of getting through to the surgery and being able to get an appointment. Our results suggest an indirect mediated effect through convenience and the percentage of the indirect effect of the total was 21% (i.e. indirect estimate divided by direct es-timate plus indirect eses-timate = 0.140/(0.140 + 0.514) = 0.21). Therefore patients who reported finding it easier to get through to the surgery were more likely to be able to get an appointment, and about half of this effect (53%) was medi-ated through the mechanism of convenience. Health care experience was not directly associated with getting an ap-pointment, but there was a statistically significant indirect
effect when convenience was added as a mediator (72% mediated effect).
Discussion
Statement of principal finding
Structural equation modelling was useful because it en-abled a greater understanding of the relative importance of each CMO configurations related to the ‘obtain ap-pointment’step in our pathway. We found that obtaining an appointment was directly associated with the ease of getting through to the surgery and this effect was medi-ated through the mechanism of convenience. We also found a mediated effect from previous health care experi-ence to obtaining an appointment through conveniexperi-ence.
Strengths and limitations
We believe this is the first study to explore CMO config-urations using structural equation modelling. Structural equation modelling allows each CMO configuration to be quantified and compared to assess relative strength. The main limitation was the lack of available data. Of the 23 proposed CMOs from our realist review for the ‘obtain an appointment’step, we were only able to test nine full CMOs. Furthermore the data included often did not exactly map to the underlying theoretical con-cept because the data had not been collected specifically to measure the constructs within our study leading to assumptions about data representation. For example, we used internet usage as a proxy for the context of use of technology, however it does not identify those that use the internet to help with primary care access; some may use it frequently for personal emails but never health-related activities. However, by using reflective and formative variables we were able to include more CMOs. There may be different CMO configurations which ex-plain access to primary care for this group than we in-cluded. We drew our CMO configurations based on our interpretation of the data from our realist review [17]; remaining true to our underlying theoretical constructs. However this has necessitated mapping data to concepts which may not perfectly match.
found a difference between the measures of model fit; RMSEA, the most commonly used measure, showed good fit, but TLI and CFI suggested less than good fit. MacCallum and colleagues have suggested the following thresholds for RMSEA: 0.01 indicates excellent fit, 0.05 good and 0.08 mediocre. [26] Using these thresholds both our models have good fit. The CFI and TLI measures suggest less than good fit because we these indices are af-fected by the large number of parameters to be estimated within our model. We standardised results, allowing a comparison of strength between different CMOs.
Comparison with other studies
Realist evaluations can include qualitative and quantita-tive data collection and analysis, but may be purely quantitative or qualitative [27]. In reality most realist evaluations in health are qualitative in nature and any quantitative analysis focuses on outcomes, tending to ei-ther be descriptive or use hypothesis testing to assess statistical significance before and after intervention im-plementation [28]. Few use more advanced statistical modelling techniques, such as interrupted time series or regression [29, 30]. However, these techniques are used to compare outcomes across time or in different groups, rather than explore the relationship between context, mechanism and outcome configurations. Hawkins suggests propensity score matching as a counterfactual analytical technique to test realist theory without necessitating a ran-domised controlled trial [31]. However propensity score
Table 3Baseline characteristics of included participants (n= 276)
Variable Number Percent
Female 169 61.2
Age 50–54 years 11 4.0
55–59 years 27 7.8
60–64 years 57 20.9
70–74 years 65 23.6
75–79 years 47 17.0
80+ years 35 12.0
Not available 1 0.4
Educational attainment No qualification 99 35.9
CSE or equivalent 24 8.7
GCE O level or equivalent
63 22.8
GCE A level or equivalent
22 8.0
Higher education below degree
36 13.0
Degree or equivalent 13 4.7
Not available 19 6.9
Occupation Routine occupations 74 26.8
Semi-routine occupations
134 48.6
Lower supervisory and technical occupations
63 22.8
Small employers and own account workers
3 1.1
Not available 2 0.7
Use of public transport Every day or nearly every day
11 4.0
Two or three times a week
26 9.4
Once a week 19 6.9
Two or three times a month
24 8.7
Once a month or less 83 30.1
Never 113 40.9
Road travel time to GP surgery (minutes) 4.80a 2.76 to 7.88b
Frequency of lifts from family or friends not living with them
Every day or nearly every day
1 0.4
Two or three times a week
17 6.2
Once a week 22 8.0
Two or three times a month
17 6.2
Once a month or less 25 9.1
Never 194 70.3
Frequency of internet or email use
Every day or almost every day
80 29.0
42 15.2
Table 3Baseline characteristics of included participants (n= 276)
(Continued)
Variable Number Percent
At least once a week (but not every day)
At least once a month (but not every week)
11 4.0
At least once every 3 months (but not every month)
4 1.5
Less than every 3 months
6 2.2
Never 112 40.6
Not available 2 7.6
Questions answered correctly in health literacy tests
0 1 0.4
1 9 3.3
2 17 6.2
3 45 16.3
4 180 65.2
Not available 24 8.7
nnumber,SDstandard deviation,GCEGeneral Certificate of Education,CSE
Certificate of Secondary Education a
median b
matching does not easily allow for latent variables or under-standing the relative strengths of CMO configurations.
A key discussion within realist methodology is what con-stitutes context within the context-mechanism-outcome logic. We have used the RAMESES II explanation of con-text within this analysis [32]. Here context is conceptualised
element of a Context-Mechanism-Outcome configuration”. Therefore context can be conceptualised as something that triggers a mechanism which in turn generates an outcome. This means that it can be internal or external to an individ-ual, such as self-esteem or ease of getting through to the GP surgery.
Meditation analysis, one component of structural equation modelling, has been proposed as a technique for analysing quantitative data within realist methods by three studies, but none have yet reported findings [33–35]. In their protocol, Jamal and colleagues propose mediation analysis to explore mechanisms within a realist RCT. How-ever, their methods have been debated [4]. Van Belle and colleagues argue that mediation analyses follow a successio-nist model of causal mechanisms (contexts lead to mechan-ism), rather than a realist generative model of mechanisms (“an unobserved entity, that when activated, generates an outcome of interest” [36]). Within a realist generative model of causation, mechanisms are a combination of rea-soning and resources which cause outcomes to happen.
Whilst Van Belle and colleagues do not appear to object to mediation analysis per se, they do disagree with a “mere variable”approach to analysis. While we agree that taking a purely variable approach to context-mechanism-outcomes configurations risks missing the rich explanatory benefits of realist approaches, we do not propose that structural equa-tion modelling, and by associaequa-tion mediaequa-tion analysis, should be the sole analysis technique for generating, explor-ing or assessexplor-ing the strength of CMO configurations. These techniques could complement analyses of qualitative data, for example, by helping to elucidate the relative importance of a range of CMOs that lead to a similar outcome (as in the case of this paper).
Policy implications
Hawkins argues that realist methods, and its subsequent theory, should consider both the effect size of CMO configurations and the extent to which they are reusable in complex adaptive systems [31]. Importantly, this would help decision makers by providing an estimated
Table 4Standardised direct and indirect regression coefficients from context to outcome for the structural equation model
Context Mechanism Outcome Direct effecta Indirect effectb Model fit indicesc
β 95% CI β 95% CI RMSEA CFI TLI
Clear information Health
literacy
Obtain an appointment
0.084 −0.056 to 0.224
0.000 −0.006 to 0.006
0.047 0.923 0.908
Higher education including degree or equivalent
Baseline NA Baseline NA
GCE A level or equivalent −0.028 −0.115 to
0.060
0.007 −0.008 to 0.021
GCE O level or equivalent −0.026 −0.145 to
0.093
0.005 −0.007 to 0.016
CSE or equivalent 0.006 −0.072 to
0.085
0.004 −0.006 to 0.013
No qualification 0.009 −0.126 to
0.144
0.011 −0.011 to 0.032
Self esteem Assertiveness −0.095 −0.213 to
0.024
0.035 −0.045 to 0.116
Clear information 0.084 −0.056 to
0.224 −
0.002 −0.014 to 0.009
Technology Convenience 0.080 −0.041 to
0.201
0.029 −0.021 to 0.079
Health care experience −0.078 −0.240 to
0.084
0.088 0.018 to
0.158
Ease of getting through to surgery 0.514 0.407 to
0.620
0.140 0.067 to
0.214
Transport 0.011 −0.209 to
0.232
0.018 −0.038 to 0.075
Clear information 0.084 −0.056 to
0.224
0.037 −0.020 to 0.094
βstandardised regression coefficients,CIconfidence intervals,RMSEARoot Mean Square Error of Approximation,CFIComparative Fit Index,TLITucker-Lewis Index,
GCEGeneral Certificate of Education,CSECertificate of Secondary Education,NAnot applicable,GCEGeneral Certificate of Education,CSECertificate of Secondary Education
a
direct effect refers to the relationship directly between“Context”and“Outcome” b
indirect effect refers to the relationship from“Context”to“Outcome”through the mediator of“Mechanism” c
degrees of freedom = 212
size of effect for each CMO, allowing a more informed decision to be made about which targeted contexts, if improved, would result in a greater change in outcome. These results can then be interpreted alongside financial considerations, qualitative findings and practical issues, such as infrastructure and workforce, to improve the intervention or programme.
Methodological implications
SEM is a useful technique to explore, and complement, realist theory. Future realist evaluations should consider using it to measure the associations between context and outcome via a mechanism. Some evaluations may benefit from both the measurement (i.e. generation of la-tent variables) and structural (e.g. mediation analysis) components or only the structural part. The measure-ment aspect would be most useful in evaluations where there are numerous unobservable or latent concepts.
Using primary data to support the CMO configura-tions (i.e. collecting data from patients based on a be-spoke questionnaire with measures of all the included concepts) would have improved the quality of our study. Our recommendation is that future studies using SEM to explore realist theory should endeavour, where pos-sible, to collect primary data to ensure that concepts are captured sufficiently. Furthermore, continuous variables should be preferred when using SEM to improve model identification. Future research should explore other SEM techniques, such as, growth mixture modelling to ex-plore changes over time, and multiple group comparison to compare groups.
Conclusions
Structural equation modelling allows quantification of context-mechanism-outcome configurations within real-ist theory; complementing qualitative data and descrip-tive quantitadescrip-tive analysis. Future research is needed to further develop the synthesis of structural equation modelling techniques and realist approaches.
Additional file
Additional file 1:Table S1.Comparison between participants with GP data and those without. (DOCX 17 kb)
Abbreviations
CFI:Comparative fit index; CMO: context-mechanism-outcome; ELSA: English longitudinal study of ageing; GPPS: GP patient survey; RMSEA: Root mean square error of approximation; SEM: Structural equation modelling; TLI: Tucker-Lewis Index
Acknowledgements
We thank Emma Coombes for her help with the Geographic Information System Software analysis.
Funding
This work was supported by the National Institute for Health Research Fellowship programme grant number DRF-2014-07-083. This article/paper/ report presents independent research funded by the National Institute for Health Research (NIHR). The views expressed are those of the author(s) and not necessarily those of the NHS, the NIHR or the Department of Health. The funder did not have any role in the design, collection, analysis or interpretation of data or in writing the manuscript.
Availability of data and materials
The data that support the findings of this study are available from NatCen and NHS England but restrictions apply to the availability of these data, which were used under license for the current study, and so are not publicly available. Data are however available from the authors upon reasonable request and with permission of NatCen and NHS England.
Authors’contributions
JAF, AJ, GW, AC, TP, and NS were involved in the conceptualisation of the study. All authors contributed to the methodology and formal analysis. JAF undertook the original draft preparation and all authors contributed to reviewing and editing. All authors read and approved the final version.
Ethics approval and consent to participate
The London Multicentre Research Ethics Committee granted ethical approval for the ELSA (MREC/01/2/91), and informed written consent was obtained from all participants.
Competing interests
The authors declare that they have no competing interests.
Publisher’s Note
Springer Nature remains neutral with regard to jurisdictional claims in published maps and institutional affiliations.
Author details
1
Norwich Medical School, University of East Anglia, Chancellor’s Drive, Norwich, UK.2Nuffield Department of Primary Care Health Sciences, University of Oxford, Oxford, UK.3School of Health Sciences, University of East Anglia, Norwich, UK.
Received: 15 June 2017 Accepted: 31 May 2018
References
1. Pawson R, Tilley N. Realist evaluation. In: Changes; 1997.
2. Pawson R, Greenhalgh T, Harvey G, Walshe K. Realist review-a new method of systematic review designed for complex policy interventions. J Health Serv Res Policy. 2005;10(Suppl 1):21–34.
3. Pawson R. Evidence-based policy: a realist perspective. London: SAGE Publications Ltd; 2006.
4. Van Belle S, Wong G, Westhorp G, Pearson M, Emmel N, Manzano A, et al. Can“realist”randomised controlled trials be genuinely realist? Trials. 2016;17:313.
5. Marchal B, Westhorp G, Wong G, Van Belle S, Greenhalgh T, Kegels G, et al. Realist RCTs of complex interventions - an oxymoron. Soc Sci Med. 2013;94:124–8.
6. Stein CM, Morris NJ, Nock NL. Structural equation modeling. Methods Mol Biol. 2012;850:495–512.
7. Bollen KA, Bauldry S. Three Cs in measurement models: causal indicators, composite indicators, and covariates. Psychol Methods. 2011;16(3):265–84. 8. Astbury B, Leeuw FL. Unpacking black boxes: mechanisms and theory
building in evaluation. Am J Eval. 2010;31(3):363–81.
9. Goddard M. In: Centre for Health Economics, editor. Quality in and Equality of Access to Healthcare Services in England. York: University of York; 2008. 10. Jones AP, Haynes R, Sauerzapf V, Crawford SM, Zhao H, Forman D. Travel
times to health care and survival from cancers in northern England. Eur J Cancer. 2008;44(2):269–74.
12. Jerant A, Fenton JJ, Franks P. Primary care attributes and mortality: a national person-level study. Ann Fam Med. 2012;10(1):34–41.
13. Starfield B, Shi L, Macinko J. Contribution of primary care to health systems and health. Milbank Q. 2005;83(3):457–502.
14. Age UK. Later life in rural England. In: London; 2013.
15. Department for Environment Food and Rural Affairs. Statistical digest of rural England 2013. London: Department for Environment and Rural Affairs; 2013. 16. Ford JA, Jones AP, Wong G, Clark AB, Porter T, Shakespeare T, et al.
Improving access to high-quality primary care for socioeconomically disadvantaged older people in rural areas: a mixed method study protocol. BMJ Open. 2015;5(9):e009104.
17. Ford JA, Wong G, Jones AP, Steel N. Access to primary care for socioeconomically disadvantaged older people in rural areas: a realist review. BMJ Open. 2016;6(5):e010652.
18. Ipsos MORI. GP patient survey - technical annex. London; 2013.https://gp-patient. co.uk/downloads/archive/2013/June/June%202013%20Technical%20Annex.pdf
19. Tomaka J, Palacios R, Schneider KT, Colotla M, Concha JB, Herrald MM. Assertiveness predicts threat and challenge reactions to potential stress among women. J Pers Soc Psychol. 1999;76(6):1008–21.
20. Alberti R, Emmons M: Your perfect right: assertiveness and equality in your life and relationships: new harbinger publications; 2017.
21. Rathus SA. A 30-item schedule for assessing assertive behavior. Behav Ther. 1973;4(3):398–406.
22. Pavot W, Diener E. Review of the satisfaction with life scale. Psychol Assessment. 1993;5(2):164–72.
23. HU L, Bentler PM. Cutoff criteria for fit indexes in covariance structure analysis: conventional criteria versus new alternatives. Struct Equ Modeling. 1999;6(1):1–55.
24. StataCorp LP. Stata statistical software: release 13 [computer software]. College Station: StataCorp LP; 2013.
25. Muthén BO, Muthén LK. Mplus (version 7) [computer software]. Los Angeles: Muthén & Muthén; 2012.
26. MacCallum RC, Browne MW, Sugawara HM. Power analysis and determination of sample size for covariance structure modeling. Psychol Methods. 1996;1(2):130.
27. Westhorpe G. In: Methods Lab, editor. Realist impact evaluation: an introduction. London; 2014. https://www.odi.org/sites/odi.org.uk/files/odi-assets/publications-opinion-files/9138.pdf
28. Gilmore B, McAuliffe E, Larkan F, Conteh M, Dunne N, Gaudrault M, et al. How do community health committees contribute to capacity building for maternal and child health? A realist evaluation protocol. BMJ Open. 2016; 6(11):e011885.
29. Mirzoev T, Etiaba E, Ebenso B, Uzochukwu B, Manzano A, Onwujekwe O, et al. Study protocol: realist evaluation of effectiveness and sustainability of a community health workers programme in improving maternal and child health in Nigeria. Implement Sci. 2016;11(1):83.
30. Allary C, Bourmaud A, Tinquaut F, Oriol M, Kalecinski J, Dutertre V, et al. ColoNav: patient navigation for colorectal cancer screening in deprived areas–study protocol. BMC Cancer. 2016;16(1):416.
31. Hawkins AJ. Realist evaluation and randomised controlled trials for testing program theory in complex social systems. Evaluation. 2016;22(3):270–85. 32. Greenhalgh T, Pawson R, Wong G, Westhorp G, Greenhalgh J, Manzano A
et al: What realists mean by context; or, why nothing works everywhere or for everyone. RAMESES II Project. 2017. Available athttp://ramesesproject. org/media/RAMESES_II_Context.pdf. Accessed 3 Jan 2018.
33. Gilmore B, Adams BJ, Bartoloni A, Alhaydar B, McAuliffe E, Raven J, et al. Improving the performance of community health workers in humanitarian emergencies: a realist evaluation protocol for the PIECES programme. BMJ Open. 2016;6(8):e011753.
34. Jamal F, Fletcher A, Shackleton N, Elbourne D, Viner R, Bonell C. The three stages of building and testing mid-level theories in a realist RCT: a theoretical and methodological case-example. Trials. 2015;16(1):466. 35. Sharma S, Adetoro OO, Vidler M, Drebit S, Payne BA, Akeju DO, et al. A process
evaluation plan for assessing a complex community-based maternal health intervention in Ogun State, Nigeria. BMC Health Serv Res. 2017;17(1):238. 36. Mahoney J. Beyond correlational analysis: recent innovations in theory and