M E T H O D O L O G Y
Open Access
Protocol: High-throughput and quantitative
assays of auxin and auxin precursors from minute
tissue samples
Xing Liu
1,2*, Adrian D Hegeman
1, Gary Gardner
1and Jerry D Cohen
1Abstract
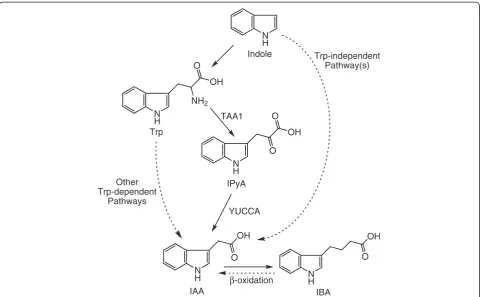
Background:The plant hormone auxin, indole-3-acetic acid (IAA), plays important roles in plant growth and development. The signaling response to IAA is largely dependent on the local concentration of IAA, and this concentration is regulated by multiple mechanisms in plants. Therefore, the precise quantification of local IAA concentration provides insights into the regulation of IAA and its biological roles. Meanwhile, pathways and genes involved in IAA biosynthesis are not fully understood, so it is necessary to analyze the production of IAA at the metabolite level for unbiased studies of IAA biosynthesis.
Results:We have developed high-throughput methods to quantify plant endogenous IAA and its biosynthetic precursors including indole, tryptophan, indole-3-pyruvic acid (IPyA), and indole-3-butyric acid (IBA). The protocol starts with homogenizing plant tissues with stable-labeled internal standards added, followed by analyte
purification using solid phase extraction (SPE) tips and analyte derivatization. The derivatized analytes are finally analyzed by selected reaction monitoring on a gas chromatograph-mass spectrometer (GC-MS/MS) to determine the precise abundance of analytes. The amount of plant tissue required for the assay is small (typically 2–10 mg fresh weight), and the use of SPE tips is simple and convenient, which allows preparation of large sets of samples within reasonable time periods.
Conclusions:The SPE tips and GC-MS/MS based method enables high-throughput and accurate quantification of IAA and its biosynthetic precursors from minute plant tissue samples. The protocol can be used for measurement of these endogenous compounds using isotope dilution, and it can also be applied to analyze IAA biosynthesis and biosynthetic pathways using stable isotope labeling. The method will potentially advance knowledge of the role and regulation of IAA.
Introduction
Auxin, the first discovered plant hormone, plays critical roles in plant growth, organ formation, and plant responses to environmental stimuli. As the major form of natural auxin, indole-3-acetic acid (IAA) has been exten-sively studied, and mechanisms of its function and regula-tion are being revealed. To trigger downstream signaling responses, IAA functions like molecular glue, which ties its receptor TIR1, an F-box protein, with Aux/IAA tran-scriptional repressors, leading to degradation of Aux/IAA
and thus releasing the transcriptional suppression of auxin responsive genes [1]. Based on this functional mechanism, auxin responses in cells can be partially controlled by the cellular concentration of IAA. Because IAA is a mobile signaling molecule that can be transported among cells to form auxin gradients and auxin maxima that are essential for plant development [2], a method that allows quick and precise measurement of IAA in specific plant tissues will greatly facilitate understanding of auxin-regulated plant growth and development.
Among the different pathways of IAA regulation [3], the biosynthesis of IAA is a central way to regulate cel-lular IAA levels and has been actively studied for the past six decades [4]. In general, two types of pathways exist in plants to synthesize IAA: Trp-dependent and * Correspondence:[email protected]
1
Plant Biological Sciences Graduate Program, Department of Horticultural Science, and Microbial and Plant Genomics Institute, University of Minnesota, 1970 Folwell Avenue, Saint Paul, MN 55108, USA
2Division of Biology, 156–29, California Institute of Technology, Pasadena, CA
91125, USA
Trp-independent (Figure 1). The Trp-independent bio-synthesis of IAA was suggested by a study showing low incorporation of 15N from [15N-indole]Trp into IAA [5] and was confirmed by studies showing the production of labeled IAA from its labeled precursors in Trp auxo-trophic mutant plants [6,7]. Because no genes involved in Trp-independent pathways have been identified, ana-lyzing the incorporation of labeled atoms into IAA and Trp from their common labeled precursors has been shown to be a useful tool to study the activity of Trp-independent IAA biosynthesis [6-10]. On the other hand, IAA can also be synthesized from multiple Trp-dependent pathways [11], and, importantly, several recent studies illustrated that in both Arabidopsis (Arabidopsis thaliana) and maize (Zea mays L.), IAA can be synthesized from Trp via the formation of indole-3-pyruvic acid (IPyA) [11-14] (Figure 1). Thus, IPyA has been demonstrated as an important intermediate of Trp-dependent IAA biosynthesis, and quantification of IPyA provides great potential to reveal mechanisms regulating this IAA biosynthetic pathway.
Indole-3-butyric acid (IBA) is another small molecule that displays auxin activity and has been identified as an endogenous plant compound [15]. Recent studies have confirmed that IAA can be produced from IBA via β -oxidation [16] and have shown that the IBA-derived IAA
is important for plant development [17]. Additionally, the regulation of IBA metabolism also affects plant de-velopment and stress tolerance [18]. Therefore, analysis of IBA levels and its conversion to IAA also provides insights into the understanding of IAA regulation.
We previously reported a method for quantitative ana-lyses of IAA and IBA, using solid phase extraction (SPE) columns and gas chromatography (GC) coupled with selected ion monitoring (SIM) on a single quadrupole mass spectrometer (MS) [19,20]. Here we describe an improved method that allows simpler equipment setup for sample preparation and smaller amounts of plant tis-sues collected for analysis, using selected reaction moni-toring (SRM) on a GC triple-quadrupole MS (GC-MS/ MS). In addition, this protocol describes methods for analyses of IAA precursors, including indole, Trp, and IPyA, and methods for rapid synthesis of stable-labeled internal standards. Thus, this protocol can be used to ei-ther measure levels of IAA and its precursors or to analyze IAA biosynthesis in plants.
Materials
Reagents
Nitrogen gas [ultra high purity (UHP)]
Helium gas (UHP) N
H NH
OH
O
OH
O
IBA N
H
NH2 OH O
Trp
N H
O OH O
IPyA
IAA
N H Indole
β-oxidation
Trp-independent Pathway(s)
TAA1
YUCCA Other
Trp-dependent Pathways
Argon gas (UHP)
Hexane (HPLC grade; Fisher, cat. no. H302) ►CAUTION: flammable
Ethyl acetate (HPLC grade; Fisher, cat. no. E195) ►CAUTION: flammable
Acetonitrile (HPLC grade; Fisher, cat. no. A998) ►CAUTION: flammable
Methanol (HPLC grade; Fisher, cat. no. A452) ►CAUTION: flammable
Dichloromethane (Sigma-Aldrich, cat. no. 154792) ►CAUTION: harmful
Pyridine (ACS grade; EMC Chemicals, cat. no. PX2020)►CAUTION: flammable
Diethyl ether (HPLC grade; Sigma-Aldrich, cat. no. 309966)►CAUTION: flammable; forms peroxides
[13C6]IAA (Cambridge Isotope Laboratories, cat. no.
CLM-1896)
►CRITICAL: keep container tightly closed and store in a dry place at−20°C.
[13C8,15N1]Indole (Cambridge Isotope Laboratories,
cat. no. CNLM-4786)
[13C8,15N1]IBA (synthesized from [13C8,15N]indole
as described in Additional file1[19,21])
[13C11,15N1]IPyA (synthesized from [13C11,15N2] Trp
as described in Additional file2)
Sodium sulfate (Na2SO4, anhydrous; Sigma-Aldrich,
cat. no. 239313)
Sodium borodeuteride (NaB2H4; Sigma-Aldrich, cat.
no. 205591)
Methanol : water (8:1, v:v)
Methanol : 8 M ammonium hydroxide (NH4OH;
Fisher, cat. no. A669) (1:1, v:v)
0.3 N Sodium hydroxide (NaOH; Sigma-Aldrich, cat. no. S8045)
0.1 M Sodium bicarbonate, pH 7.0 (NaHCO3;
Mallinckrodt, cat. no. 7412)
50 mM NaHCO3
0.2 M Imidazole, pH 7.0 (Sigma-Aldrich, cat. no. 56750)►CAUTION: corrosive
NOTE: yellows with storage and yellowed material is not suitable for use. It may be recrystallized; otherwise should be discarded
50% (v/v) Isopropanol (HPLC grade; Fisher, cat. no. A451)
Homogenization buffer: 65% isopropanol and 35% 0.2 M imidazole (pH 7.0)
0.25% Phosphoric acid (PA) (ACS grade; Fisher, cat. no. A242)
0.1 M Succinic acid, pH 6.0 (SA) (Sigma-Aldrich, cat. no. 224731)
►CRITICAL: store in refrigerator or prepare freshly, because bacteria grow well on succinic acid
solutions.
PA:SA (5:1, v:v), pH 3.0
►CRITICAL: store in refrigerator or prepare freshly, because bacteria grow well on succinic acid
solutions.
25% (w/v) Polymethylmethacrylate epoxide resin (PMME, Macro-Prep; Bio-Rad, cat. no. 156–0000) suspension in 0.1 M NaHCO3(pH 7.0)
25% (w/v) NH2resin (Agilent, cat. no. 12213020)
suspension in distilled water
25% (w/v) DOWEXW50X2-400 ion-exchange resin (Sigma-Aldrich, cat. no. 217476), H+form,
suspension in distilled water
25% (w/v) OasisWHLB resin (collected from HLB cartridges; Waters, cat. no. WAT106202) suspension in methanol
Ethereal diazomethane (prepared as previously described [22,23])
Methyl chloroformate (MCF; Sigma-Aldrich, cat. no. M35304)►CAUTION: flammable, highly toxic by inhalation, toxic by ingestion, corrosive.
Equipment
MICROMAN positive-displacement pipettes (Gilson, cat. no. F148501, F148502, F148503, F148504, F148505, F148506)
MICROMAN positive-displacement pipette tips (Gilson, cat. no. F148412, F148112, F148113, F148414, F148114, F148560)
10–200μl Empty TopTip for solid phase extraction (SPE) and adaptors for centrifugation (Glygen, cat. no. TT2EMT)
RepeaterWplus positive displacement pipette (Eppendorf, cat. no. 022260201)
Eppendorf Combitips plus (1.0 ml, 5.0 ml; Eppendorf, cat. no. 022266209, 022266403)
Tungsten-carbide beads (2.38 mm; Craig Ball Sales, cat. no. CATU.002380.000.0010)
SealRiteWmicrocentrifuge tubes (0.5 ml, 2.0 ml; USA Scientific, cat. no. 1605–0000, 1620–2700)
Teflon Mixer-Mill adapter for 1.5- to 2-ml microcentrifuge tubes (Qiagen, cat. no. 69984)
Vibration Mill (Mixer-Mill; Qiagen, cat. no. MM300)
Microcentrifuge (Eppendorf, cat. no. 5417R)
2-ml Clear glass vials with polytetrafluoroethylene (PTFE)-lined caps (Fisher Scientific, cat.
no. 03-391-7A)
2-ml Amber glass vials with PTFE-lined caps (Fisher Scientific, cat. no. 03-391-8A)
8-ml Clear glass vials with PTFE-lined caps (Fisher Scientific, cat. no. 03-391-7C)
4-ml Amber glass vials with PTFE-lined caps (Fisher Scientific, cat. no. 03-391-8B)
Color pHast Strips (Fisher Scientific, cat. no. S60170)
Wide-mouth crimp vials (Chrom Tech, cat. no. CTV-1104)
250μl Glass inserts with bottom spring (Chrom Tech, cat. no. CTI-9425)
Crimp cap with silicone rubber septum, PTFE coated (Chrom Tech, cat. no. 515011)
Crimper for 11-mm crimp caps (Sigma-Aldrich, cat. no. 33195)
Decapping pliers (Chrom Tech, cat. no. 904371)
Micro-dissecting forceps (Sigma-Aldrich, cat. no. F4017)
Gas chromatograph (GC)-mass spectrometer (MS): Trace GC Ultra with TriPlus autosampler, TSQ Quantum triple quadrupole MS (Thermo ScientificW)
GC capillary column 1: HP-5 ms, 30 m, 0.25 mm diameter, 0.25μm film thickness (Agilent Technologies, cat. no. 19091 S-433UI)
GC capillary column 2 (for analysis of indole-3-pyruvic acid only): DB-17 ms, 30 m, 0.25 mm diameter, 0.25μm film thickness (Agilent Technologies, cat. no. 122–4732)
Equipment setup
Diazomethane derivatization equipment The following items are needed:
Glass diazomethane generator with clear-seal joints as described in Cohen [23]
Teflon tubing (3 mm, Cole-Parmer, cat. no. C-06407-10)
8-ml Clear glass vials with PTFE-lined caps (Fisher Scientific, cat. no. 03-391-7C
Stainless steel evaporator (six-position evaporator, Barvap 6, Zanntek, cat. no. 11–06000)
Sand bath heated to 55°C
The stainless steel evaporator is connected with N2 gas tank by Teflon tubing, and the probes of the evapor-ator are positioned above the sand bath so that samples can be heated while being evaporated by flowing N2gas. The Teflon tubing can be connected with the diazo-methane generator during the diazodiazo-methane generation process [22,23].
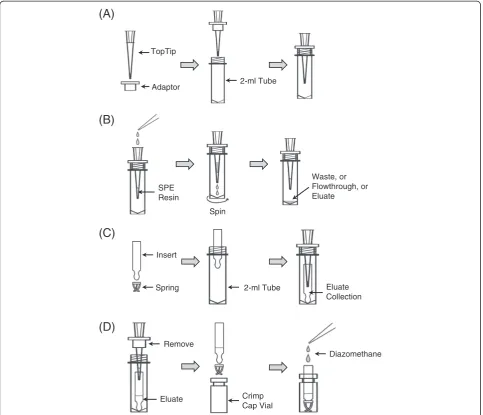
SPE TopTips
Insert empty TopTips into adaptors that are placed on top of 2-ml screw capped micro tubes (Figure 2A). Load SPE resin suspension into each tip from the top of the tip. For NH2resin, DOWEXW 50X2-400 ion-exchange resin, or OasisW HLB resin, load 20μl suspensions; for PMME resin, load 80μl sus-pension. Then, spin the micro tubes together with the tips at 3,000 g for a few seconds (use“short”button on centrifuge). Repeat with higher centrifugal force and/or longer time if li-quiddoesnotpassthoughthetips.
GC-MS/MS system setup
The following items are used to set up the GC:
Merlin Microseal™high pressure kit (Thermo ScientificW, part no. 19050205, or contact Thermo ScientificWfor the current part number)
Merlin Microseal high pressure replacement septum (Merlin, part no. 410)
Customized Teflon washer (made by Metro Industries, Inc. to the exact dimensions of the vespel/graphite washer supplied by Thermo ScientificW; a number of extras are available directly from our laboratory)
10μl Syringe with an 80-mm needle (SGE Analytical Science, cat. no. 002989)
Custom liners: Quartz glass tubes (outside diameter: 8 mm, inside diameter: 4 mm; part no. 4x8,
Technical Glass Products, Inc.) cut to a length of 105 mm, lightly fire-polished and treated with Sylon CT™(Sigma-Aldrich, cat. no. 33065-U) to deactivate the surface.
Silanized quartz wool (Alltech, cat. no. 4233)
The GC was equipped with a split/splitless capillary inlet, and the standard septum was replaced by an adapter to accept the Merlin Microseal™ high pressure seal. To provide a better seal of the inlet and avoid ad-sorption of indolic compounds, the original vespel/ graphite seal from the Thermo Scientific adapter kit was replaced by the custom Teflon washer, which was placed under the hexagonal adapter. A 10-μl syringe with an 80-mm needle was installed in the injector of the auto-sampler, and the injector position was adjusted to match the position and height of the Merlin Microseal™ valve. The original straight inlet liner (Restek, cat. no. 20939) was replaced by a custom quartz liner with a cluster of quartz wool inserted at the center. The MS was equipped with an electron impact (EI) source with an electron emission of 70 eV.
GC-MS/MS program
part. no. XCALI-64251) were installed to operate the GC-MS/MS.
TriPlus Autosampler: Sample volume was 1.0μl; injection depth was standard; pre- and post-injection dwell time was 0 s; sampling depth mode was custom and sampling vial depth was 88%; sample type was“non viscous”.
TRACE GC Ultra: in the“Oven”tab, under “Ramps”, the initial oven temperature was 70°C and the hold time was 2 minutes; the Ramp 1 rate was 20°C/min until temperature reached 280°C, and the hold time was 5 minutes. In the“Right SSL”tab, the inlet mode was splitless; the inlet temperature was 240°C; the split flow was 10 ml/min, and the
splitless time was 1 min; the“constant septum purge”was checked. In the“Right Carrier”tab, the carrier gas was run under“constant flow”mode, and the flow rate was 1.0 ml/min; the“vacuum
compensation”was checked. In the“Aux Zones” tab, the MS transfer line temperature was set to 280°C.
TSQ Quantum (Condition 1): in the“EI/CI”tab, the number of states was 2; the state at start of run was “off”, and the state duration was 4 min; the emission current was 100μA. The calibration gas setting was “off”and the CI method was unchecked. In the “scan editor”tab, the calibration correction method was unchecked; the MS acquire time was 17.50 min; scan type can be either SRM (selected reaction
(C)
Insert
Spring 2-ml Tube Eluate
Collection
(D)
Crimp Cap Vial
Diazomethane Remove
Eluate
(A)
TopTip
Adaptor 2-ml Tube
(B)
Spin SPE
Resin
Waste, or Flowthrough, or Eluate
monitoring) or SIM (selected ion monitoring), and scan time was 0.025 s; the polarity was positive and the data type was centroid. When SRM mode was used, the argon collision gas pressure was 1.5 mTorr, and the collision energy was 10 V. The masses of ions to be monitored depended on the metabolites analyzed and will be described in the “procedure”section.
TSQ Quantum (Condition 2, for analysis of indole-3-pyruvic acid only): similar to Condition 1, but the emission current in the“EI/CI”tab was 120μA, the scan type in the“scan editor”tab was SRM, and the collision energy was 25 V.
Protocol
Plant sample preparation and homogenization
1. Collect plant material in 0.5-ml microcentrifuge tubes, and quickly freeze the tubes in liquid N2. If
performing absolute quantification of endogenous metabolites, determine the exact fresh weight (FW) of plant material quickly and accurately before freezing the tubes. Keep tubes on dry ice or store them at−80°C.
CRITICAL STEP: Sufficient plant material is necessary for the yield of satisfactory GC-MS/MS signals. Usually, 2–10 mg plant tissue is enough for the analysis of IAA/IBA, indole, and Trp; about 10 mg plant tissue is needed for the analysis of IPyA alone. Because IAA, IBA, indole, and Trp are extracted from the same aliquot of plant homogenate while IPyA is extracted from a separate aliquot of plant homogenate, this protocol assumes that ~20 mg plant tissue is collected as one sample.
PAUSE POINT: Frozen samples can be stored at
−80°C or shipped in a dry ice package.
2. Add 40μl homogenization buffer and a tungsten carbide bead to each tube. If performing absolute quantification of endogenous compounds, add known amounts of internal standards together with
homogenization buffer. Samples need to be kept on dry ice before next step.
CRITICAL STEP: Add 20μl homogenization buffer for a sample containing no more than 10 mg plant tissue. For every increment of 10 mg plant tissue, add an additional 20μl
homogenization buffer.
CRITICAL STEP: For absolute quantification, accurate amounts of [13C6]IAA, [13C8,15N]IBA,
[13C8,15N]indole, [13C11,15N]IPyA and (or) 100 ng
of [13C11,15N2]Trp are added. To make sure that
the detector’s response is within the linear range, the amount of internal standards should not exceed 10× of the endogenous level, or below
1/10 of the endogenous amount. For 20 mg of plant tissue, addition of 0.1-0.5 ng of each internal standard is suggested except that addition of 100–500 ng of [13
C11,15N2]Trp is suggested.
3. Place the sample tubes into a vibration mill (with the Teflon adaptor and de-capped 2.0-ml
microcentrifuge tubes placed in the adaptor), and homogenize for 4 min at 20–25 Hz. Repeat this step if tissues are not fully homogenized. If tissues are difficult to homogenize, add more tungsten carbide beads and increase the vibration frequency.
Extraction and derivatization of IPyA
4. Transfer 20μl plant homogenate into a new tube. Leave the rest of plant homogenate on ice (see Step 24).
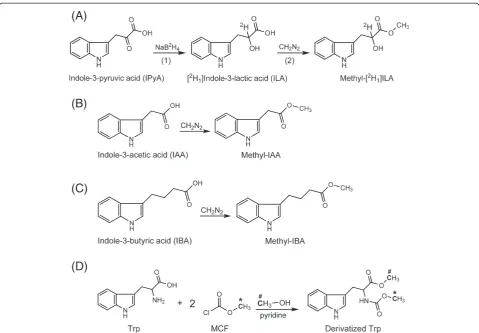
5. Add 8μl 20 mg/ml NaB2H4into each tube, and mix
well (Figure3A).
►CRITICAL: The 20 mg/ml NaB2H4needs to be freshly prepared in 0.3 N NaOH, because NaB2H4 decomposes over time in aqueous solutions [24]. Perform this step soon after homogenization to avoid significant degradation of IPyA.
6. Incubate samples at 35°C for 1 h.
PAUSE POINT: IPyA is reduced to [2H1
]indole-3-lactic acid ([2H1]ILA), which is much more stable
than IPyA, so samples can be stored at−20°C for a few days.
7. Add 5μl 25% PA to acidify the sample and consume the residual NaB2H4.
8. Dilute the sample 10 fold by adding 200μl distilled water and mixing well.
9. Check the pH of the diluted sample using a pH strip. The pH should be 2.5-3.0.
10. Wash the TopTips containing OasisWHLB resin two times with 80μl methanol and two times with 80μl PA:SA (pH 3.0). Use repeater pipette to dispense the liquid into multiple TopTips. Liquid is forced to pass through TopTips by centrifugation at 3,000-6,000 g for a few seconds (Figure2B).
liquid waste when ~400μl liquid has passed through TopTips. If 2-ml microcentrifuge tubes are used instead of screw capped tubes, less liquid can be held and the liquid waste needs to be discarded more frequently.
11. Spin the diluted samples at 12,000 g for 10 min. 12. Load the supernatant of each sample into individual
TopTip.
13. Spin TopTips at 2,000 g to allow samples to pass through slowly and completely.
14. Wash the TopTips two times with 60μl PA:SA (pH 3.0).
15. Wash the TopTips with 10μl methanol. Spin the TopTips at 10,000 g for 1–2 min.
CRITICAL STEP: The methanol wash and long period of centrifugation are designed to remove the water residue in the resin. If a significant amount of water is retained in the resin, the efficiency of methylation (by ethereal
diazomethane) will be reduced, and the drying process will be extended.
16. Transfer the TopTips to new 2-ml tubes to collect the eluate.
17. Elute TopTips three times with 70μl methanol. 18. Discard the TopTips.
19. Transfer the methanol eluate into a 2-ml clear glass vial.
PAUSE POINT: Samples can be stored in capped vials at−20°C for a few days.
20. Fill each glass vial with ethereal diazomethane, and incubate for ~5 minutes (Figure3A).
21. Evaporate the solvents to complete dryness using a gentle N2gas stream in a sand bath heated to 55°C.
►Caution: Diazomethane is a toxic and explosive gaseous compound, and it is potentially explosive on contact with sharp edges such as scratched or broken
(A)
(B)
(C)
(D)
glass. It should be prepared and used only in a fume hood and handled by hands protected with gloves. Read precautions in Cohen JD [23] and Barkawi LS and Cohen JD [22] before use.
22. Use 15μl of ethyl acetate to re-suspend the sample, and transfer the ethyl acetate solution into a glass insert.
23. Place the glass insert into a crimp vial, and cap the vial.
PAUSE POINT: Methylated samples can be stored at−20°C for a few days before GC-MS/MS analysis.
Extraction of Indole, IAA, and IBA
24. Leave the rest of plant homogenate on ice for at least 1 h for isotopic equilibration.
NOTE: This step follows Step 4
PAUSE POINT: Homogenized samples can be stored at−20°C overnight.
25. Spin samples a short time to pellet plant homogenate debris to the bottom of the tubes. 26. Dilute the sample 10 fold by adding 180μl distilled
water and mix thoroughly.
27. Add 80μl hexane and mix thoroughly.
28. Spin samples a short time to allow the organic and aqueous phases to separate clearly.
29. Transfer ~60μl of the organic layer (upper layer) to a glass insert. Place the glass insert into a crimp vial, and cap the vial. This sample contains indole and can be analyzed by GC-MS/MS without derivatization.
NOTE: Step 27–29 are designed to extract indole. These steps can be skipped if indole is not a targeted analyte. The samples of indole can be stored in sealed vials at 4°C in the dark for one week, but because indole is volatile do not let the sample dry.
30. Wash the TopTips containing NH2resin
sequentially with 60μl of hexane, acetonitrile, ethyl acetate, 0.2 M imidazole, followed by three times with 100μl of distilled water.
31. Transfer the TopTips to new 2-ml tubes to collect the flow-through from NH2TopTips.
32. Spin the diluted samples at 12,000 g for 10 min. 33. Load the supernatant of each sample into individual
TopTip.
34. Spin TopTips at 2,000 g to allow samples to pass through slowly and completely.
35. Transfer the TopTips to new 2-ml tubes. Cap the tubes containing the flow-through from the NH2
tips and store in a refrigerator. The flow-through contains Trp.
NOTE: the flow-through is collected to extract Trp (See Step 53). It can be discarded if only IAA and IBA are of interest. The flow-through can be stored at 4°C for one month.
36. Wash the TopTips with 60μl each of hexane and methanol.
37. Transfer the TopTips to new 2-ml tubes, each of which contains 25μl of SA.
38. Elute IAA and IBA from the TopTips using 50μl, 100μl, and 50μl PA, separately.
39. Discard the NH2TopTips, and collect 2-ml tubes
containing the acidic eluate.
40. Prewash the TopTips containing PMME resin two times with 100μl methanol, followed by two times with 100μl PA:SA.
41. Load the acidic eluate into the PMME TopTips. 42. Spin TopTips at 2,000 g to allow liquid to pass
through slowly and completely.
43. Wash the TopTips three times with 60μl PA:SA. 44. Wash the TopTips with 10μl methanol. Spin the
TopTips at 10,000 g for 1–2 min.
CRITICAL STEP: Remove the water residue in the PMME resin to gain good methylation efficiency (similar to Step 15).
45. Remove the plastic spring from the bottom of the 250-μl glass inserts, and put the glass inserts into 2-ml screw capped micro tubes (Figure2C). 46. Transfer the PMME TopTips to the micro
tubes containing glass inserts. Make sure that the TopTips insert into the glass inserts (Figure2C).
47. Elute IAA and IBA two times with 50μl methanol. The eluate contains both IAA and IBA and is collected in the glass inserts in the micro tubes. 48. Discard the PMME TopTips.
49. Use the micro-dissecting forceps to take the glass inserts out of the micro tubes. Re-install the plastic spring at the bottom of the glass inserts, and put the glass inserts into crimp vials (Figure2D).
Derivatization of IAA and IBA
50. Add ethereal diazomethane into each glass insert until the insert is full, and incubate for ~5 minutes (Figure2D; Figure3Band3C).
51. Evaporate the solvents until complete dryness using a gentle N2gas stream in a sand bath heated to
55°C in a solvent hood.
►Caution: Diazomethane is toxic and potentially explosive (see Step 21).
52. Add 15μl of ethyl acetate into each glass insert to re-suspend the methylated IAA and IBA. Cap the vials.
PAUSE POINT: Methylated samples can be stored at−20°C for a few months or at−80°C for up to one year.
Extraction and derivatization of Trp
53. Wash the TopTips containing DOWEXW50X2-400 resins two times with 100μl methanol and two times with 100μl distilled water.
54. Load the TopTips with the flow-through from NH2
TopTips collected in Step 35.
55. Spin TopTips at 2,000 g to allow liquid to pass through slowly and completely.
56. Wash the TopTips with methanol : water (8:1, v:v). 57. Transfer the TopTips onto new 2-ml tubes. 58. Elute Trp two times with 100μl methanol : 8 M
NH4OH (1:1, v:v).
PAUSE POINT: Trp eluate can be stored at 4°C for a few days.
59. Transfer 100μl of the eluate containing Trp into a 2-ml clear glass vial.
60. In a fume hood, add 20μl pyridine to each glass vial, and gently shake the vial to make sure the solvents mix.
61. Continuing in the fume hood, add 20μl MCF into each vial. Wait for a minute to allow the reaction to complete (Figure3D).
62. Sequentially add 300μl each of 50 mM NaHCO3
and then dichloromethane into the vial. Cap the vial and mix thoroughly. Keep the vials still until two layers form clearly.
63. In a new 2-ml clear glass vial, add 10–20 mg anhydrous Na2SO4(add enough to cover the
bottom of the vial).
64. Transfer the dichloromethane layer (bottom layer) into the glass vial containing Na2SO4. Cap the vial.
The dichloromethane contains derivatized Trp. 65. Wait for 30–60 min to allow Na2SO4to absorb
water from the dichloromethane solution.
PAUSE POINT: Derivatized Trp is less stable than Trp, and it can be stored at−20°C for a few days. The actual time length for storage depends on the abundance of the compound in each sample. It is recommended to analyze the samples soon after derivatization.
66. Transfer 50μl of the dichloromethane sample solution into a glass insert. Place the glass insert into a crimp vial, and cap the vial.
GC-SRM-MS/MS analysis of derivatized IPyA
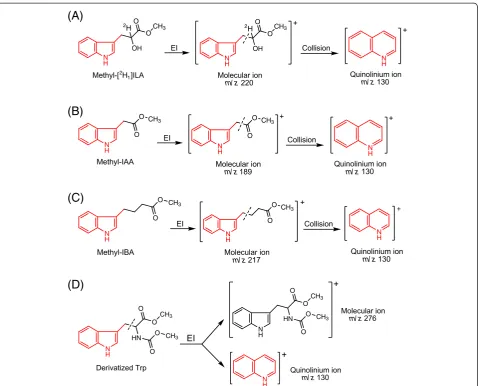
67. SRM is used as the acquisition mode, and the quinolinium ions produced from the molecular ions (Figure4A) are monitored. For unlabeled methyl-[2H1]ILA, the parent mass is 220 and the product
mass is 130; for the methyl-[13C11,15N,2H1]ILA
internal standard, the parent mass is 232 and the product mass is 140.
►CRITICAL: Because only the product
(quinolinium) ions are monitored in the SRM mode, it is important to know what atoms are included in the quinolinium ions (Figure4A) when stable-labeled IPyA is analyzed. Some stable-labeled atoms are missing from the quinolinium ions after
fragmentation.
GC-SIM-MS/MS analysis of indole
68. SIM is used as the acquisition mode and the molecular ions are monitored. The MS mode under “Scan Modes”is set to“Q1MS”. For the unlabeled indole, ion m/z 117 is monitored; for the [13C8,15N]
indole, ion m/z 126 is monitored; for other types of labeled indole, the m/z of the monitored ion equals the nominal molecular mass.
GC-SRM-MS/MS analysis of derivatized IAA and IBA
69. SRM is used as the acquisition mode and the quinolinium ions produced from the molecular ions (Figure4Band4C) are monitored. Under the“Run Settings”in the“Scan Editor”tab (of TSQ
For unlabeled methyl-IAA, the parent mass is 189 and the product mass is 130; for the methyl-[13C6]
IAA internal standard, the parent mass is 195 and the product mass is 136. In Segment 2, methyl-IBA is monitored. For unlabeled methyl-IBA, the parent mass is 217 and the product mass is 130; for the methyl-[13C8,15N]IBA internal standard, the parent
mass is 226 and the product mass is 139.
CRITICAL STEP: methyl-IAA and methyl-IBA are analyzed in one GC-MS/MS run, and the GC retention time of Me-IBA is about 1 min longer than Me-IAA under the conditions described in
the“Materials”section. Under these conditions, the retention time is about 10 min for Me-IAA and about 11 min for Me-IBA, so the division of the two segments in the run is set at 10.5 min. However, if different conditions are used (e.g., different GC column type or length, different oven temperatures), this setting needs to be adjusted based on the actual retention time of Me-IAA and Me-IBA.
►CRITICAL: Because only the product
(quinolinium) ions are monitored in the SRM mode, it is important to know what atoms are included in N
H
O
O CH3
N H
O
O O
OH OH
O
CH3
O O O
O O
CH3
CH3
CH3
O CH3
m/ z m/ z m/ z
N H N H N
H N
H N
H NH NH
+
m/ z m/ z
m/ z
N H
HN O O
CH3
O O CH3
N H
HN O O
CH3
O
O CH3 m/ z
N H
m/ z
(A)
(B)
(C)
(D)
2 2
2 1
the quinolinium ions (Figure4Band4C) when stable-labeled IAA and IBA are analyzed. Some stable-labeled atoms are missing from the quinolinium ions after the fragmentation.
GC-SIM-MS/MS analysis of derivatized Trp
70. SIM is used as the acquisition mode, and both the molecular ions and the quinolinium product ions are monitored. For unlabeled Trp, the molecular ion m/z 276 and quinolinium ion m/z 130
(Figure4D) are monitored; for the [13C11,15N2]Trp,
the molecular ion m/z 289 and quinolinium ion m/ z 140 are monitored. The quinolinium ions are much more abundant than the molecular ions, so the abundance of the quinolinium ions is used for quantification.
Comments
Development and principles of the protocol
The protocol for high-throughput SPE purification and GC-MS analysis has been validated as a good approach to quantify auxin levels and auxin biosynthesis [10,19,25]. Major procedures of the protocol are summarized in Figure 5. Briefly, indole, Trp, IAA, and IBA can be extracted from the same aliquot of plant homogenate and analyzed by GC-MS/MS separately, except that IAA and IBA are contained in the same sample and are ana-lyzed in one GC-MS/MS run; using another aliquot of plant homogenate, IPyA can be extracted, derivatized, and analyzed by GC-MS/MS. The protocol does not need to be carried out completely as a set if only a par-ticular analyte is of interest, and steps related to the individual analytes are outlined in Figure 5.
To quantify the level of endogenous compounds using isotope dilution, proper stable isotope labeled internal standards are required. An ideal internal standard should contain stable isotopes at non-exchangeable positions on compounds identical to the analytes, with mass increments of three or more [26]. When exchange of stable isotopes occurs during sample preparation and analysis, the amount of internal standard would de-crease, leading to overestimation of the endogenous compound. When an internal standard with a small mass increment is used, the interference by natural abundance would greatly complicate the calculation (for example, [13C1]indole-3-acetonitrile [27]). However, such stable-labeled internal standards are not always readily available, especially for IPyA which degrades rapidly in solution [25]. Therefore, we developed and describe herein protocols to rapidly synthesize [13C8,15N1]IBA from [13C8,15N1]indole (Additional file 1) and [13C11,15N1] IPyA from [13C11,15N2]Trp (Additional file 2). Considering the high cost of [13C11,15N2]Trp, [2,4,5,6,7-2H5-indole]
Trp can be a good alternative when GC-MS is used for the analysis [25]. However, when liquid chromatography-mass spectrometry (LC-MS) is used, the deuterium atoms on the indole ring may be lost during the ionization process [28]. Thus, deuterium-labeled indolic compounds are more complex to employ compared to 13
C and/or 15N labeled compounds when used as in-ternal standards with LC-MS as the stability of the deuterium-labeled internal standards needs to be care-fully determined and verified. After proper stable-labeled internal standards are available, they should be intro-duced into plant samples at the earliest possible step, and as we described in the protocol, they are added together with the homogenization buffer right before tissue homogenization.
The SPE purification of IAA and IBA is derived from a protocol previously published [20], and the most sig-nificant improvement is the use of TopTips (Figure 2), which can retain SPE resin while letting liquid pass through the 1–2 μl slit at the bottom (http://www.glysci. com/products/TopTip.html). In addition to commercial TopTips, SPE tips can also be made by inserting small pieces of glass wool into regular pipette tips [29]. The first SPE tip used for IAA and IBA extraction contains amino (NH2) resin, which retains the ionized organic acids at neutral pH but not Trp, so Trp can be collected in the flow-through and extracted separately (Figure 5). The second SPE tip contains polymethylmethacrylate epoxide (PMME) resin, which binds protonated IAA and IBA when the pH is around 3.0 and releases them when methanol is added for elution. Finally, IAA and IBA are methylated by diazomethane in the presence of methanol (Figure 3), and the methylated IAA and IBA are analyzed by monitoring the quinolinium ion pro-duced from the molecular ion (SRM; Figure 4) after GC separation. The sample recovery in the SPE steps varies from 80% to 90% [19]. It should be noted that although diazomethane is a hazardous compound, it has been proven to be very useful for chromatographic analysis (discussed previously [22]) with high yields and few byproducts. With proper handling, as described previ-ously and herein, the generation, storage, and utilization of diazomethane have not led to any problem in our laboratory over the past 30 years.
basic pH, based on a mechanism described previously [30] (Figure 3), and the derivatized Trp is analyzed by GC-MS using the SIM acquisition mode (Figure 4). The sample recovery in the SPE steps is around 90% [30].
The derivatization and extraction of IPyA is derived from methods previously described [25,31], with modifi-cations that confer more rapid sample preparation. Because IPyA has a short half-life in solution, the [13C11,15N1]IPyA internal standard should be made just prior to use (Additional file 2). After tissue homogenization, IPyA is quickly derivatized by sodium borodeuteride (NaB2H4) to produce [2H1]indole-3-lactic acid ([2H1]ILA, Figure 3), which degrades much more slowly and thus allows reliable quantification [25]. Be-cause low levels of ILA exist in plants [32,33], it is ne-cessary to use NaB2H4 (instead of NaBH4) to produce [2H1]ILA that can be distinguished from endogenous ILA by MS. It is important to understand that because about 11% of the plant endogenous ILA is13C1labeled from the natural occurrence of 13C, the existence of
endogenous ILA can potentially still interfere with the analysis of IPyA. However, because the unlabeled quino-linium ion (m/z 130) from 2H1 labeled IPyA (m/z 220) is monitored in the SRM method (Figure 4A), this reduces the potential to only 2-3% of the endogenous ILA that can interfere with the analysis of IPyA. Never-theless, if high levels of endogenous ILA are present in the plant tissues of interest, these levels should be deter-mined in a parallel extraction (discussed below) and their contribution to the measurement of IPyA should be subtracted. After converting IPyA to [2H1]ILA, the [2H1]ILA is protonated by acidifying the homogenate and extracted by OasisW HLB resin, a hydrophilic-lipophilic-balanced reversed-phase sorbent (http://www. waters.com/waters/nav.htm?cid=513209). The carboxyl group of [2H1]ILA is also methylated by diazomethane (Figure 3), and the methylated product is analyzed by GC-MS using SRM (Figure 4). The sample recovery in the SPE steps is around 85% (defined as previously described [30]).
Tissue Homogenization (pH 7) + Stable-labeled Internal Standards
Water Dilution
Partition (Hexane) Hexane Phase Indole
GC-SIM-MS
Elution: Phosphoric Acid
IAA & IBA
PMME Tip
Methylation
Methyl-IAA Methyl-IBA
GC-SRM-MS
Elution: Methanol
IAA & IBA
Flowthrough
DOWX50 Tip
Elution: NH4OH+
Methanol
Trp
MCF Derivatization
Derivatized Trp
GC-SIM-MS
Aqueous Phase
NH2Tip
[2H 1]ILA
HLB Tip
Elution: Methanol
[2H 1]ILA
Methylation
Methyl-[2H 1]ILA
GC-SRM-MS
pH 2.5 Water Dilution
pH: ~3.0
NaBD4 Derivatization
(A)
(B)
(C)
(D)
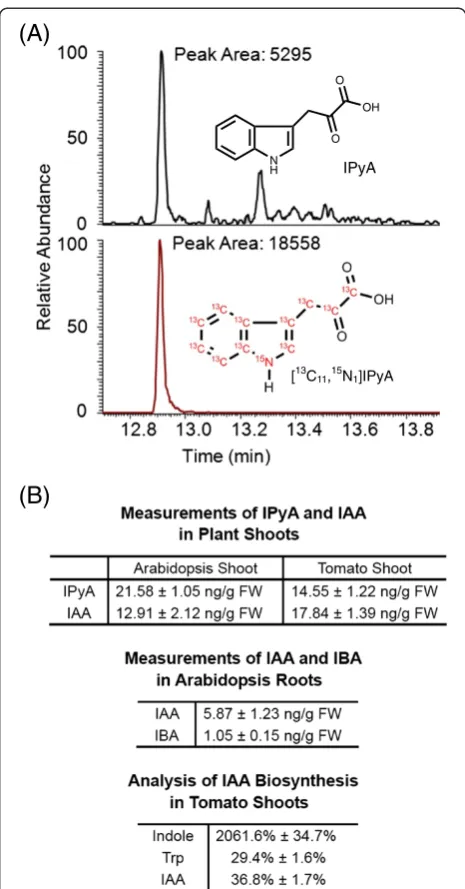
Anticipated results
A group of results generated from extractions of IAA and IAA precursors is shown in Figure 6. The chromatographic results (Figure 6A) were displayed by Qual Browser in XcaliburTM 2.1 software, and the chromatogram of each ion (SIM) or reaction product ion (SRM) selected to be monitored is shown in each panel. Peaks were detected automatically by the software, and peak areas were also determined by the software. When necessary, peaks can also be determined manually by defining the start and end points of the peak.
All the chromatograms should be evaluated before cal-culations are applied. Each peak should be completely separated from its surrounding peaks, if any, and should be well resolved from the background, with a signal-to-noise ratio of greater than three. In general, it is more likely to have a second peak overlapping with the peak of analyte when the SIM acquisition mode is used, but this may also occur in the SRM acquisition mode. If peak overlapping forms a problem, samples can be ana-lyzed again by GC-MS/MS using a different GC temperature gradient program (see Table 1).
For absolute quantification, the amount of plant en-dogenous compounds can be calculated from peak areas of the endogenous compound and the labeled internal stand-ard. For example, in Figure 6A, IPyA from 9.5 mg plant tissue was extracted with 0.5 ng [13C11,15N1]IPyA. Because the amount of [13C11,15N1]IPyA was determined based on unlabeled IPyA using reverse isotope dilution (Additional file 2), the R-value discussed previously [20] is not neces-sary for the calculation here, and the sample shown con-tains 0.143 ng of IPyA, which is then divided by the fresh weight (FW) of the plant sample in order to calculate the concentration of IPyA. Therefore, the sample shown in Figure 6A contains 15.05 ng g-1 FW of IPyA. Results of IPyA measurements from Arabidopsis and tomato seed-lings are also shown in Figure 6B, which are consistent with the previous reports [25,34]. Similarly, IAA and IBA from 2–10 mg plant tissues were extracted together with known amounts of [13C6]IAA and [13C8,15N1]IBA. Using the isotope dilution equation that was fully discussed previ-ously [20], the masses of endogenous IAA and IBA can be calculated (R-value: 1.13 for IAA; 1.33 for IBA, see Additional file 1), and they are then divided by the fresh weight of the plant sample to calculate concentrations of IAA and IBA. Results of IAA and IBA measurements from different plant tissues are shown in Figure 6B. In addition to Arabidopsis and tomatoes, using this method we have successfully analyzed IAA in different tissues from different plant species, including tobacco, corn, peas, Lemna, andAngraecum sesquipedale.
To study the activity of auxin biosynthesis, isotopic enrichment of stable-labeled auxin and auxin pre-cursors can be analyzed. Figure 6B shows the enrichment
of 13C in tomato shoots after incubation with 0.1 mM [13C1]indole for four hours. [13C1]indole is greatly enriched in the plant indole pool, suggesting that [13C1]indole was taken up into plants effectively. After subtraction of the natural abundance of [13C1]Trp (10%, a constant deter-mined from unlabeled Trp), the average enrichment of [13C1]Trp synthesized from [13C1]indole was determined to be 29.4% (labeled Trp divided by unlabeled Trp). Similarly,
(A)
N H
O OH O
IPyA
[13C11,15N1]IPyA
(B)
after subtraction of the natural abundance of [13C1]IAA (10%, a constant determined from unlabeled IAA), the average enrichment of [13C1]IAA synthesized from [13C1] indole was determined to be 36.8%. Because the enrich-ment of [13C1]IAA synthesized from [13C1]indole exceeded the enrichment of [13C1]Trp synthesized from [13C1]indole, it can be concluded that at least a portion of [13C1]IAA was synthesized in the tomato plants via the Trp-independent biosynthetic pathway.
Application of the method and experimental design
Firstly, this protocol can be used for absolute quantifica-tion of IAA and IAA precursors. Because the extracquantifica-tion and GC-MS analysis of IPyA is essentially extraction and analysis of its reduced product ILA, the method can also
be used to quantify endogenous ILA using [13C11,15N1] ILA as the internal standard, which can be made by re-ducing synthesized [13C11,15N1]IPyA using NaBH4 (simi-lar to Steps 17–22 in Additional file 2). Because isotope dilution is used in the quantification, the technical vari-ation after the addition of internal standard is minimal, and thus the major variations are introduced before and during the sample homogenization step. The IAA con-tent in plants can vary significantly depending on growth conditions and developmental stages [35-39], so plants should be grown under controlled environmental condi-tions and the tissues collected for analysis should be at similar developmental stages. Because the levels of IAA or its precursors are usually expressed as ng g-1 fresh weight of plant tissue, the tissue weight should be
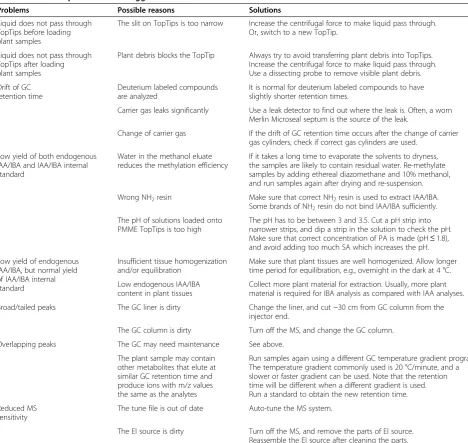
Table 1 Common problems and suggested solutions
Problems Possible reasons Solutions
Liquid does not pass through TopTips before loading plant samples
The slit on TopTips is too narrow Increase the centrifugal force to make liquid pass through. Or, switch to a new TopTip.
Liquid does not pass through TopTips after loading plant samples
Plant debris blocks the TopTip Always try to avoid transferring plant debris into TopTips. Increase the centrifugal force to make liquid pass through. Use a dissecting probe to remove visible plant debris.
Drift of GC retention time
Deuterium labeled compounds are analyzed
It is normal for deuterium labeled compounds to have slightly shorter retention times.
Carrier gas leaks significantly Use a leak detector to find out where the leak is. Often, a worn Merlin Microseal septum is the source of the leak.
Change of carrier gas If the drift of GC retention time occurs after the change of carrier gas cylinders, check if correct gas cylinders are used.
Low yield of both endogenous IAA/IBA and IAA/IBA internal standard
Water in the methanol eluate reduces the methylation efficiency
If it takes a long time to evaporate the solvents to dryness, the samples are likely to contain residual water. Re-methylate samples by adding ethereal diazomethane and 10% methanol, and run samples again after drying and re-suspension.
Wrong NH2resin Make sure that correct NH2resin is used to extract IAA/IBA.
Some brands of NH2resin do not bind IAA/IBA sufficiently.
The pH of solutions loaded onto PMME TopTips is too high
The pH has to be between 3 and 3.5. Cut a pH strip into narrower strips, and dip a strip in the solution to check the pH. Make sure that correct concentration of PA is made (pH≤1.8), and avoid adding too much SA which increases the pH.
Low yield of endogenous IAA/IBA, but normal yield of IAA/IBA internal standard
Insufficient tissue homogenization and/or equilibration
Make sure that plant tissues are well homogenized. Allow longer time period for equilibration, e.g., overnight in the dark at 4 °C.
Low endogenous IAA/IBA content in plant tissues
Collect more plant material for extraction. Usually, more plant material is required for IBA analysis as compared with IAA analyses.
Broad/tailed peaks The GC liner is dirty Change the liner, and cut ~30 cm from GC column from the injector end.
The GC column is dirty Turn off the MS, and change the GC column.
Overlapping peaks The GC may need maintenance See above.
The plant sample may contain other metabolites that elute at similar GC retention time and produce ions with m/z values the same as the analytes
Run samples again using a different GC temperature gradient program. The temperature gradient commonly used is 20 °C/minute, and a slower or faster gradient can be used. Note that the retention time will be different when a different gradient is used. Run a standard to obtain the new retention time.
Reduced MS sensitivity
The tune file is out of date Auto-tune the MS system.
precisely determined before freezing, and water or soil attached to the plant surface should be removed before tissue collection. To minimize the effects of wounding, samples should be frozen in liquid N2 quickly after weighing and stored continuously at −80°C to avoid changes in IAA content until tissue homogenization. When homogenizing plant tissues, isopropanol is an im-portant component in the homogenization buffer which denatures plant metabolic enzymes that can alter the content of IAA and other compounds in plant homoge-nates [40-42]. After homogenization, internal standards are added and plant metabolic enzymes are denatured by isopropanol, so the plant homogenate can then be manipulated or stored at a higher temperature with no alterations to the quantification results.
Additionally, the protocol can be used to quantify the enrichment of stable-labeled IAA synthesized from stable-labeled IAA precursors or putative precursors. For this type of analysis, plants should be incubated with stable-labeled compounds such as [13C1]indole or [13C8,15N1]IBA for a certain period of time before tissue collection, and the abundance of both endogenous IAA and putative stable-labeled IAA should be monitored by GC-MS/MS. Because the enrichment is determined by the abundance of labeled IAA divided by abundance of endogenous IAA (see“anticipated result”), it is often not necessary to record the fresh weight of plant tissue or add internal standards prior to homogenization, unless the yield of labeled IAA is to be quantified. To quantify the amount of labeled IAA, the internal standard should contain a mass significantly different from the mass of labeled tracer IAA. For example, to quantify the amount of [13C8,15N1]IAA synthesized from [13C8,15N1]IBA, [13C6]IAA was used as the internal standard [16]; and to quantify the amount of transported [13C6]IAA in Arabi-dopsis hypocotyls, [4,5,6,7-2H4-indole]IAA was added as the internal standard [43].
Using this protocol, the activity of IAA biosynthetic pathways can also be analyzed. By comparing the incorp-oration of13C from [13C1]indole into Trp and IAA pools (Figure 6, D and E), it is possible to identify biotic and abiotic factors that change the activity of Trp-independent and/or Trp-dependent IAA biosynthesis [9,10,38]. Similarly, by quantifying the enrichment of la-beled IAA and IPyA, the significance of IPyA-dependent IAA biosynthesis under various biological conditions can be analyzed [44].
Advantage of the method
A major advantage of this method is the improved detectability of analytes. The SRM acquisition mode confers an order of magnitude higher sensitivity com-pared with the SIM acquisition mode, so the amount of plant tissue required in this protocol is at least ten
times less than in the previous method [20]. Based on analyses of chemical standards, the GC-SRM-MS/MS detection limit (signal-to-noise≥3) is 0.01 pg/μl for IAA, 0.05 pg/μl for IBA, and 1 pg/μl for IPyA (weights of compounds were determined before derivatization). Considering the accuracy of weighing, a minimum amount of 2 mg tissue is recommended for quantifica-tion. This lower requirement for plant tissue allows fas-ter tissue collection and tissue-specific analysis, which enables detection of localized changes in IAA content and IAA biosynthesis [10,45,46] and thus provides a bet-ter potential for understanding IAA-regulated biological processes. In addition, with the more sensitive assay, plants can be incubated with IAA precursors for shorter periods of time and still yield sufficient amounts of la-beled IAA for detection while reducing artifacts gener-ated by exogenous compounds [10,47]. Therefore, this more sensitive method can also provide more accurate assessments of IAA regulatory mechanisms.
To better quantify the trace amount of plant endogen-ous compounds in a high-throughput manner, we modi-fied the inlet port of the GC (see “GC-MS/MS system setup”). We replaced the standard septum with a Merlin Microseal™ high pressure seal to reduce injection of the septum material into the GC column and permit less frequent change of the septum. We used a custom Teflon washer to provide a better seal between the Mer-lin seal adaptor and the GC inlet and to avoid inter-action between the seal material and injected analytes. We also replaced the inlet liner with a custom quartz liner to minimize the effect of residual analytes from earlier injections carried-over to later injections and thus increased the accuracy of the assay.
Another highlight of the protocol is the use of SPE tips. Compared with SPE columns, which usually require a manifold connected with a vacuum pump for liquid manipulation, SPE tips can be manipulated by a standard microcentrifuge, allowing simpler instrumental setup, less solvent consumption/waste, and preparation of more samples at one time. Because the SPE resin can be packed into tips simply by adding the resin suspension, SPE tips can be easily customized, which significantly reduces the cost and greatly facilitates development of new methods. Based on our experimental design, we decided to use 200-μl TopTips, but other tip sizes such as 10-μl or 1000-μl tips can also be used when different sample sizes are to be applied.
Conclusion
conventional SPE columns, and it also allows high-throughput extractions of trace amounts of small mole-cules. For an experienced researcher, roughly 48 samples can be prepared for analysis daily. The GC-MS/MS pro-vides direct and precise quantification of plant endogen-ous IAA and its biosynthetic precursors using isotope dilution, and the amount of plant tissue required for the assay is small (typically 2–10 mg fresh weight). Add-itionally, the protocol can be used to analyze IAA bio-synthesis and biosynthetic pathways using stable isotope labeling, and in the absence of complete knowledge of IAA biosynthetic mechanisms, stable isotope labeling enables comprehensive studies of IAA biosynthesis.
Additional files
Additional file 1:Protocol: Preparation of [13C
8,15N]indole-3-butyric
acid (IBA).
Additional file 2:Protocol: Preparation of [13C
11,15
N]Indole-3-pyruvic acid (IPyA).
Competing interests
The authors declare that they have no competing interests.
Authors’contributions
XL developed the protocol and wrote the paper. ADH and GG advised the research and edited the paper. JDC directed the research and edited the paper. All authors read and approved the final manuscript.
Acknowledgements
This work was supported by the National Science Foundation (grants MCB-0725149, IOS-PGRP-0923960, IOS-PGRP-1238812 and MCB-1203438), the Minnesota Agricultural Experiment Station, and the Gordon and Margaret Bailey Endowment for Environmental Horticulture. We are grateful to L. Barkawi, W. Chen, and A. Culler for providing generous advice and discussions. We also thank staff from the Glygen Corp. for helpful technical support on the use of TopTips. We thank the many visitors to our lab who tested our methods with various plant species and tissue types and helped us improve these protocols.
Received: 13 March 2012 Accepted: 16 July 2012 Published: 10 August 2012
References
1. Tan X, Calderon-Villalobos LIA, Sharon M, Zheng CX, Robinson CV, Estelle M, Zheng N:Mechanism of auxin perception by the TIR1 ubiquitin ligase.
Nature2007,446:640–645.
2. Petrásek J, Friml J:Auxin transport routes in plant development.
Development2009,136:2675–2688.
3. Woodward AW, Bartel B:Auxin: regulation, action, and interaction.
Ann Bot2005,95:707–735.
4. Zhao YD:Auxin biosynthesis and its role in plant development.Annu Rev Plant Biol2010,61:49–64.
5. Baldi BG, Maher BR, Slovin JP, Cohen JD:Stable isotope labelingin vivoof D- and L- tryptophan pools inLemna gibbaand the low incorporation of label into indole-3-acetic acid.Plant Physiol1991,95:1203–1208. 6. Wright AD, Sampson MB, Neuffer MG, Michalczuk L, Slovin JP, Cohen JD:
Indole-3-acetic acid biosynthesis in the mutant maizeorange pericarp, a tryptophan auxotroph.Science1991,
254:998–1000.
7. Normanly J, Cohen JD, Fink GR:Arabidopsis thalianaauxotrophs reveal a tryptophan-independent biosynthetic pathway for indole-3-acetic acid.
Proc Natl Acad Sci USA1993, 90:10355–10359.
8. Sztein AE, IlićN, Cohen JD, Cooke TJ:Indole-3-acetic acid biosynthesis in isolated axes from germinating bean seeds: The effect of wounding on the biosynthetic pathway.Plant Growth Regul2002,
36:201–207.
9. Epstein E, Cohen JD, Slovin JP:The biosynthetic pathway for indole-3-acetic acid changes during tomato fruit development.Plant Growth Regul
2002,38:16–21.
10. Liu X, Cohen JD, Gardner G:Low-fluence red light increases the transport and biosynthesis of auxin.Plant Physiol2011,
157:891–904.
11. Mashiguchi K, Tanaka K, Sakai T, Sugawara S, Kawaide H, Natsume M, Hanada A, Yaeno T, Shirasu K, Yao H,et al:The main auxin biosynthesis pathway in Arabidopsis.Proc Natl Acad Sci USA2011,108:18512–18517. 12. Phillips KA, Skirpan AL, Liu X, Christensen A, Slewinski TL, Hudson C,
Barazesh S, Cohen JD, Malcomber S, McSteen P:vanishing tassel2encodes a grass-specific tryptophan aminotransferase required for vegetative and reproductive development in maize.Plant Cell2011,23:550–566. 13. Won C, Shen X, Mashiguchi K, Zheng Z, Dai X, Cheng Y, Kasahara H, Kamiya
Y, Chory J, Zhao Y:Conversion of tryptophan to indole-3-acetic acid by TRYPTOPHAN AMINOTRANSFERASES OF ARABIDOPSIS and YUCCAs in Arabidopsis.Proc Natl Acad Sci USA2011,108:18518–18523.
14. Stepanova AN, Yun J, Robles LM, Novak O, He W, Guo H, Ljung K, Alonso JM:TheArabidopsisYUCCA1 flavin monooxygenase functions in the indole-3-pyruvic acid branch of auxin biosynthesis.Plant Cell2011, 23:3961–3973.
15. Ludwig-Müller J:Indole-3-butyric acid in plant growth and development.
Plant Growth Regul2000,32:219–230.
16. Strader LC, Culler AH, Cohen JD, Bartel B:Conversion of endogenous indole-3-butyric acid to indole-3-acetic acid drives cell expansion in Arabidopsis seedlings.Plant Physiol2010,153:1577–1586.
17. Strader LC, Wheeler DL, Christensen SE, Berens JC, Cohen JD, Rampey RA, Bartel B:Multiple facets of Arabidopsis seedling development require indole-3-butyric acid-derived auxin.Plant Cell2011,23:984–999. 18. Tognetti VB, Van Aken O, Morreel K, Vandenbroucke K, de Cotte BV, De
Clercq I, Chiwocha S, Fenske R, Prinsen E, Boerjan W,et al:Perturbation of indole-3-butyric acid homeostasis by the UDP-glucosyltransferase UGT74E2modulates Arabidopsis architecture and water stress tolerance.
Plant Cell2010,22:2660–2679.
19. Barkawi LS, Tam YY, Tillman JA, Pederson B, Calio J, Al-Amier H, Emerick M, Normanly J, Cohen JD:A high-throughput method for the quantitative analysis of indole-3-acetic acid and other auxins from plant tissue.Anal Biochem2008,372:177–188.
20. Barkawi LS, Tam YY, Tillman JA, Normanly J, Cohen JD:A high-throughput method for the quantitative analysis of auxins.Nat Protoc2010,5:1609–1618. 21. Cohen JD, Schulze A:Double-standard isotope-dilution assay .1.
Quantitative assay of indole-3-acetic-acid.Anal Biochem1981,112:249–257. 22. Barkawi LS, Cohen JD:A method for concurrent diazomethane synthesis
and substrate methylation in a 96-sample format.Nat Protoc2010, 5:1619–1626.
23. Cohen JD:Convenient apparatus for the generation of small amounts of diazomethane.J Chromatogr1984,303:193–196.
24. Andrieux J, Demirci UB, Hannauer J, Gervais C, Goutaudier C, Miele P: Spontaneous hydrolysis of sodium borohydride in harsh conditions.Int J Hydrogen Energ2011,36:224–233.
25. Tam YY, Normanly J:Determination of indole-3-pyruvic acid levels in Arabidopsis thalianaby gas chromatography selected ion monitoring mass spectrometry.J Chromatogr A1998,800:101–108.
26. Cohen JD, Baldi BG, Slovin JP:13C
6[Benzene ring]indole3acetic acid
-a new intern-al st-and-ard for qu-antit-ative m-ass-spectr-al -an-alysis of indole-3-acetic-acid in plants.Plant Physiol1986,80:14–19. 27. IlićN, Normanly J, Cohen JD:Quantification of free plus conjugated
indoleacetic acid in arabidopsis requires correction for the nonenzymatic conversion of indolic nitriles.Plant Physiol1996,111:781–788.
28. Davies NW, Smith JA, Molesworth PP, Ross JJ:Hydrogen/deuterium exchange on aromatic rings during atmospheric pressure chemical ionization mass spectrometry.Rapid Commun Mass Sp2010, 24:1105–1110.
29. Ribnicky DM, Cooke TJ, Cohen JD:A microtechnique for the analysis of free and conjugated indole-3-acetic acid in milligram amounts of plant tissue using a benchtop gas chromatograph mass spectrometer.Planta
30. Chen WP, Yang XY, Hegeman AD, Gray WM, Cohen JD:Microscale analysis of amino acids using gas chromatography–mass spectrometry after methyl chloroformate derivatization.J Chromatogr B2010,878:2199–2208. 31. McHan F, Horvat RJ:A gas–liquid chromatographic method for analysis
of pyruvic acid and lower molecular weight fatty acids in plant materials.J Agr Food Chem1987,35:241–243.
32. Gibson RA, Schneider EA, Wightman F:Biosynthesis and metabolism of Indol-3yl-acetic acid.J Exp Bot1972,23:381–399.
33. Hoenicke K, Simat TJ, Steinhart H, Kohler HJ, Schwab A:Determination of free and conjugated indole-3-acetic acid, tryptophan, and tryptophan metabolites in grape must and wine.J Agr Food Chem2001, 49:5494–5501.
34. Cooney TP, Nonhebel HM:The measurement and mass spectral identification of indole-3-pyruvate from tomato shoots.Biochem Biophys Res Commun1989,162:761–766.
35. Gray WM, Ostin A, Sandberg G, Romano CP, Estelle M:High temperature promotes auxin-mediated hypocotyl elongation in Arabidopsis.Proc Natl Acad Sci USA1998,95:7197–7202.
36. Michalczuk L, Cooke TJ, Cohen JD:Auxin levels at different stages of carrot somatic embryogenesis.Phytochemistry1992,31:1097–1103. 37. Miller AN, Walsh CS, Cohen JD:Measurement of indole-3-acetic acid in
peach fruits (Prunus PersicaL. Batsch cv Redhaven) during development.
Plant Physiol1987,84:491–494.
38. Rapparini F, Tam YY, Cohen JD, Slovin JP:Indole-3-acetic acid metabolism inLemna gibbaundergoes dynamic changes in response to growth temperature.Plant Physiol2002,128:1410–1416.
39. Tao Y, Ferrer JL, Ljung K, Pojer F, Hong FX, Long JA, Li L, Moreno JE, Bowman ME, Ivans LJ,et al:Rapid synthesis of auxin via a new tryptophan-dependent pathway is required for shade avoidance in plants.Cell2008,133:164–176.
40. Hamilton RH, Bandurski RS, Grigsby BH:Isolation of indole-3-acetic acid from corn kernels & etiolated corn seedlings.Plant Physiol1961,36:354–359. 41. Chen KH, Miller AN, Patterson GW, Cohen JD:A Rapid and Simple
Procedure for Purification of Indole-3-Acetic Acid Prior to GC-SIM-MS Analysis.Plant Physiol1988,86:822–825.
42. Loo JA, Loo RR, Udseth HR, Edmonds CG, Smith RD:Solvent-induced conformational changes of polypeptides probed by electrospray-ionization mass spectrometry.Rapid Commun Mass Spectrom1991,5:101–105. 43. Liu X, Barkawi L, Gardner G, Cohen JD:Transport of indole-3-butyric acid
and indole-3-acetic acid in Arabidopsis hypocotyls using stable isotope labeling.Plant Physiol2012,158:1988–2000.
44. Cooney TP, Nonhebel HM:Biosynthesis of indole-3-acetic-acid in tomato shoots: Measurement, mass-spectral identification and incorporation of2H from2H2O into indole-3-acetic acid, D- and L-tryptophan,
indole-3-pyruvate and tryptamine.Planta1991,184:368–376. 45. Ikeda Y, Men SZ, Fischer U, Stepanova AN, Alonso JM, Ljung K, Grebe M:
Local auxin biosynthesis modulates gradient-directed planar polarity in Arabidopsis.Nat Cell Biol2009,11:731–738.
46. Ljung K, Hull AK, Celenza J, Yamada M, Estelle M, Nonmanly J, Sandberg G: Sites and regulation of auxin biosynthesis in Arabidopsis roots.Plant Cell
2005,17:1090–1104.
47. Ribnicky DM, IlićN, Cohen JD, Cooke TJ:The effects of exogenous auxins on endogenous indole-3-acetic acid metabolism (the implications for carrot somatic embryogenesis).Plant Physiol1996,112:549–558.
doi:10.1186/1746-4811-8-31
Cite this article as:Liuet al.:Protocol: High-throughput and quantitative assays of auxin and auxin precursors from minute tissue samples.Plant
Methods20128:31. Submit your next manuscript to BioMed Central
and take full advantage of:
• Convenient online submission • Thorough peer review
• No space constraints or color figure charges • Immediate publication on acceptance
• Inclusion in PubMed, CAS, Scopus and Google Scholar
• Research which is freely available for redistribution