R E S E A R C H
Open Access
Gyrification, cortical and subcortical morphometry
in neurofibromatosis type 1: an uneven profile of
developmental abnormalities
Inês R Violante
1, Maria J Ribeiro
1, Eduardo D Silva
2and Miguel Castelo-Branco
1*Abstract
Background:Neurofibromatosis type 1 (NF1) is a monogenic disorder associated with cognitive impairments. In order to understand how mutations in theNF1gene impact brain structure it is essential to characterize in detail the brain structural abnormalities in patients with NF1. Previous studies have reported contradictory findings and have focused only on volumetric measurements. Here, we investigated the volumes of subcortical structures and the composite dimensions of the cortex through analysis of cortical volume, cortical thickness, cortical surface area and gyrification.
Methods:We studied 14 children with NF1 and 14 typically developing children matched for age, gender, IQ and right/left-handedness. Regional subcortical volumes and cortical gyral measurements were obtained using the FreeSurfer software. Between-group differences were evaluated while controlling for the increase in total intracranial volume observed in NF1.
Results:Subcortical analysis revealed disproportionately larger thalami, right caudate and middle corpus callosum in patients with NF1. Cortical analyses on volume, thickness and surface area were however not indicative of significant alterations in patients. Interestingly, patients with NF1 had significantly lower gyrification indices than typically developing children primarily in the frontal and temporal lobes, but also affecting the insula, cingulate cortex, parietal and occipital regions.
Conclusions:The neuroanatomic abnormalities observed were localized to specific brain regions, indicating that particular areas might constitute selective targets forNF1gene mutations. Furthermore, the lower gyrification indices were accompanied by a disproportionate increase in brain size without the corresponding increase in folding in patients with NF1. Taken together these findings suggest that specific neurodevelopmental processes, such as gyrification, are more vulnerable toNF1dysfunction than others. The identified changes in brain organization are consistent with the patterns of cognitive dysfunction in the NF1 phenotype.
Keywords:Brain structure, Gyrification, Morphometry, MRI, Neurodevelopmental disorders, Neurofibromatosis type 1
* Correspondence:[email protected]
1Institute for Biomedical Imaging and Life Sciences, Faculty of Medicine,
University of Coimbra, Azinhaga de Santa Comba, Coimbra 3000-548, Portugal
Full list of author information is available at the end of the article
Background
Brain development is dependent on a series of complex events including cellular proliferation, growth, differenti-ation and migrdifferenti-ation, programmed cell death and synaptic elimination. These events largely determine brain morph-ology [1]. Since brain structure is under significant gen-etic influence [2] it is important to use gengen-etic models to understand its ontogeny.
Neurofibromatosis type 1 (NF1) is a good model in this respect, because it is a monogenic disorder caused by mutations in theNF1gene. The disorder has a preva-lence of 1 in 3,500 [3] and is characterized by alterations in skin pigmentation (café-au-lait spots and skinfold freckling), increased tumor predisposition and learning deficits [4,5]. In the brain, neurofibromin, the protein product of the NF1 gene, is expressed in both neurons and glial cells [6,7] and is required for neural develop-ment [8,9]. Loss of neurofibromin results in increased cellular growth [10], while it is also involved in learning and memory [11]. Thus, this disease provides a unique window into gene-brain-behavior relationships. The role of neurofibromin in cellular growth and its ubiquitous expression in the brain suggest that brain structure might be affected in patients. In fact, there is a high incidence of macrocephaly, optic gliomas and T2-weighted hyper-intensities, commonly referred to as unidentified bright objects (UBOs) [12]. Nevertheless, the gross brain anat-omy appears normal and it has been difficult to determine if brain structure is altered independent of focal lesions.
Recent advances in neuroimaging allow for an increas-ingly detailed delineation of developmental anomalies. Previous studies focusing on NF1 brain structure have examined the relative contributions of gray matter (GM) and white matter (WM) to increased brain size, with contradictory results [12]. The majority of studies point to macrocephaly being caused by increased WM [13,14] or a combination of WM and GM [15,16]. Only one study pointed to an increase in GM [17]. However, few reports attempted to identify regional abnormalities. Cutting et al. [15] focused on frontal and parietal lobe subdivisions and found they presented increased WM volume. Greenwoodet al. [16] divided the brain into 16 parcellations and, besides a total increase in GM and WM volumes in patients with NF1, they reported increased GM in occipital and parietal regions and increased WM in anterior regions. Other brain structure anomalies observed included increased brainstem growth rate, suggestive of abnormal cell proliferation [18], smaller surface area and GM volume of the left planum temporale of NF1 boys compared with controls [19] and abnormal thalamic meta-bolic patterns observed with positron emission tomography [20] and magnetic resonance spectroscopy [21]. Further-more, in a previous study from our laboratory, support vector machines were able to reveal the existence of brain
structural differences in GM and WM tissue that could accurately discriminate individuals with NF1 from controls [22].
However, no previous study performed morphometric measurements of subcortical and cortical structures across the whole brain. Moreover, we extended our investigation beyond the volumetric dimension as alterations in neurofi-bromin expression might be differently reflected across the brain and manifest in distinct structures and morpho-logical traits.
In this study, our aim was to provide a multidimensional morphometric analysis to clarify how brain structure is affected by NF1; to do this, we measured subcortical and cortical volumes, cortical thickness, cortical surface area and gyrification across the entire brain. The importance of assessing multiple morphometric traits is explained by the fact that they underlie distinctive evolutionary [23], developmental [24,25] and possible genetic [26] processes. A crucial point in our study was a careful matching of the control group, as several factors are known to influence brain morphology, including age [25], gender [27], intelligence [28,29] and handedness [30]. A number of previous studies focusing on structural alterations in NF1 were biased by gender [15] or included patients with brain tumors [16,17]. Moreover, the majority of studies lacked matching for intelligence quotient (IQ). In contrast, in the present study, patient and control groups did not show significant differences in age, gender, handedness or IQ.
The present multidimensional whole brain study is of an exploratory nature. However, given the previous reported imaging findings, the range of neuropsycho-logical deficits observed in patients and the wide expres-sion of neurofibromin in the brain we hypothesized that the pattern of alterations would not be limited to one brain region. Moreover, based on previous neuroima-ging studies [15,16], we expected that the alterations observed will include frontal and parietal neocortical regions and at the subcortical level the corpus callosum [14,22,31-34].
Methods
Ethics statement
The study was conducted in accordance with the Declar-ation of Helsinki and all procedures were reviewed and approved by the Ethics Commissions of the Faculty of Medi-cine of the University of Coimbra and of the Children’s Hos-pital of Coimbra. Written informed consent was obtained from the parents/guardians of all participants. Children and adolescents gave written or oral informed consent.
Subjects
that the groups were matched for age, gender, IQ and handedness. We studied 14 patients with NF1 (mean age: 11.34 ± 2.51 SD; age range: 7.83 to 16.08 years; 6 males, 8 females) and 14 matched typically developing (TD) subjects (mean age: 11.89 ± 2.06 SD; age range: 7.83 to 15.33 years; 5 males, 9 females). All participants were right-handed.
Patients were recruited and diagnosed in collaboration with the Clinical Genetics Department of the Pediatric Hospital of Coimbra according to the NIH defined diag-nostic criteria [36]. The TD group was recruited from a local school. Exclusion criteria for all participants were as follows: psychiatric disorder, neurological illness affecting brain function other than NF1, epilepsy, tumors or other clinically significant intracranial abnormality detected on magnetic resonance imaging (MRI). UBOs, areas of increased T2-weighted signal intensity on MRI with
un-known etiology, commonly found in patients with NF1, were not considered exclusion criteria when present in patients. Additionally, we only included patients with intelligence quotient≥90 in order to be able to match to typically developing children. On average, IQs reported in children with NF1 tend to be lower, with mean values around 90 (as reviewed by Ozonoffet al. [37]). Children prescribed with stimulant medication (methylphenidate) were not medicated on the day of MRI acquisition and neuropsychological assessment (3 NF1).
Neuropsychological assessment was performed using the Portuguese adapted version of the Wechsler Intelligence Scale for Children III (WISC-III) [38]. The demographic and neuropsychological characterization of both groups is shown in Table 1.
MRI acquisition
Scanning was performed on a 3T Siemens TimTrio scan-ner, using a 12-channel birdcage head coil. In this study we analyzed acquired data with the following parameters: (i) two T1-weighted (T1w) magnetization-prepared rapid
acquisition with gradient echo (MPRAGE) sequences, 1 × 1 × 1 mm voxel size, repetition time (TR) 2.3 s, echo time (TE) 2.98 ms, flip angle (FA) 9°, field of view (FOV) 256 ×
256, 160 slices; (ii) a T2-weighted (T2w) fluid attenuated
inversion recovery (FLAIR) sequence, 1 × 1 × 1 mm voxel size, TR 5 s, TE 2.98 ms, Inversion Time (TI) 1.8 s, FOV 250 × 250, 160 slices. FLAIR images were used to identify T2hyperintensities. A neuroradiologist blinded to the
par-ticipants’clinical history observed the magnetic resonance structural scans and reported on the distribution and number of UBOs.
MRI data analyses
Cortical reconstruction and volumetric segmentation were performed with the FreeSurfer image analysis suite (FreeSurfer v5.1.0, http://surfer.nmr.mgh.harvard.edu), as described in previous publications [39-41]. Briefly the processing included, motion correction, averaging of the two T1w images, registration to Talairach space,
segmentation of the subcortical WM and deep GM volumetric structures [41,42], intensity normalization, tessellation of the GM/WM boundary, automated top-ology correction [43,44], and surface deformation follow-ing intensity gradients to optimally place the GM/WM and GM/cerebrospinal fluid (CSF) borders [39]. Image outputs were visually inspected and inaccuracies corrected when required. FreeSurfer provided correct segmentation and classification of subcortical structures in spite of the presence of UBOs in patients with NF1. UBOs were included as belonging to the structure they appeared on, as demonstrated in Additional file 1: Figure S1. Registra-tion was performed to a spherical atlas [45]. Cortical thickness was calculated by computing the average short-est distance between the GM/WM and the GM/CSF sur-face [40]. Sursur-face area maps of the GM/WM boundary were computed for each subject by calculating the area of every triangle in a cortical surface tessellation, as implemented in FreeSurfer. In anatomical regions of inter-est, surface area values were calculated by summing the triangular area tessellations included in the region. Local gyrification indices (LGIs) were computed using local measurements of gyrification over the whole cortical sur-face using the method developed by Schaeret al. [46]. The LGI reflects at each vertex the amount of cortical surface area than can be packed under a sphere with a fixed size.
Table 1 Demographic and neuropsychological characterization
NF1 (n = 14) TD (n = 14)
Age 11.34 (2.51), range: 7.83 to 16.08 11.89 (2.06), range: 7.83 to 15.33
Gender (M:F) 6 M:8 F 5 M:9 F
Handedness (right:left) 14:0 14:0
FSIQ 104.36 (13.41), range: 90 to 126 110.00 (10.97), range: 90 to 124
VIQ 107.28 (11.38), range: 94 to 126 109.86 (11.90), range: 93 to 129
PIQ 99.43 (12.43), range: 80 to 119 109.07 (12.86), range: 87 to 136
Data are mean (SD).
Cortical volume, surface area, cortical thickness and the LGIs were estimated for 34 gyral regions per hemisphere by determining the mean values of each of these variables belonging to a gyral region of interest, as defined by the atlas developed by Desikanet al. [47], recently modified to include the insula as a region of interest. GM volume was estimated for subcortical structures. WM and GM brain volumes, WM and GM cerebellar volumes, WM and GM lobar volumes and total intracranial volumes (TIV) were also estimated for each participant. TIV was calculated using a validated method shown to be proportional to manually measured total intracranial volume [48]. Briefly, an atlas scaling factor is determined based on the trans-formation matrix of the atlas normalization for each indi-vidual subject. The atlas scaling factor is then used to scale the intracranial volume of the atlas to compute each subject TIV. Lobar metrics were extracted using FreeSurfer’s built-in lobe surface maps. The GM parcella-tion is based on the regions defined by the Desikan atlas [47] and the WM parcellation is performed as described in Salatet al. [49].
Statistical analyses
Statistical analyses were performed with PAWS Statistics 18 (SPSS Inc., Chicago, IL, USA). First, we verified the normality assumption for the different parameters using the Shapiro-Wilk test. All data were normally distributed. Group differences in demographic and neuropsychological data were evaluated with independent samples t test, while a χ2 test was used for gender. Whole-brain volumetric analysis including overall GM and WM volumes, were assessed using independent samples t tests and also using analysis of covariance (ANCOVA) to control for TIV. Lobar and cerebellar WM and GM group differences were investigated using repeated measures ANCOVA with group (NF1 vs TD) as the between-subjects factor and hemi-spheres (left vs right) and brain regions (lobes/cerebellar WM/cerebellar GM) as the within-subjects factors and total intracranial volume (TIV) as covariate. Analyses of subcortical volumetric differences were assessed using multivariate ANCOVA with TIV as covariate. Cortical dif-ferences between groups were investigated using repeated measures ANCOVA with group (NF1 vs TD) as the between-subjects factor and hemispheres (left vs right) and brain regions (34 gyral regions) as the within-subjects factors and TIV as covariate. Follow-up tests were per-formed using multivariate ANCOVAs with TIV as covari-ate. Relationships between brain measurements and age were studied using Pearson’s correlations.
To control for type I errors we used the Benjamini and Hochberg [50] false discovery rate (FDR) method, which was applied per analysis. We set q = 0.05 or 0.1 (that is, 5% or 10% false positives). Multiple ROI-based analyses survived FDR control at q = 0.1 and several
survived FDR control atq= 0.05. Although FDR atq= 0.1 can be considered a liberal correction for multiple com-parisons, the exploratory nature of the present study should be taken into account.
Results
Demographic and neuropsychological
Demographic and neuropsychological data are described in Table 1. Children with NF1 and typically developing (TD) children did not differ significantly in age (t(26) = −0.632,P= 0.533), IQ (t(26)=−1.219,P= 0.234), verbal
IQ (t(26)=−0.584,P = 0.564), or gender (χ2= 0.150,P=
0.699). Performance IQ was marginally significant (t(26)= −2.016, P = 0.054), with larger scores observed in TD children.
One or more UBOs were present in 85.7% (12 out of 14) of the children with NF1 distributed as follows: 85.7% (n = 12) of the patients had UBOs in the globus pallidus, 21.4% (n = 3) in the thalami, 14.3% (n = 2) in the corpus callosum, 7.1% (n = 1) in the putamen, 14.3% (n = 2) in the cerebellum and 28.6% (n = 4) had UBOs in the WM. The frequency and distribution of UBOs is in accordance with published data [12]. None of the TD participants had UBOs. The number of UBOs was not correlated with total intracranial volume (r = 0.056,P= 0.850).
Whole-brain analyses
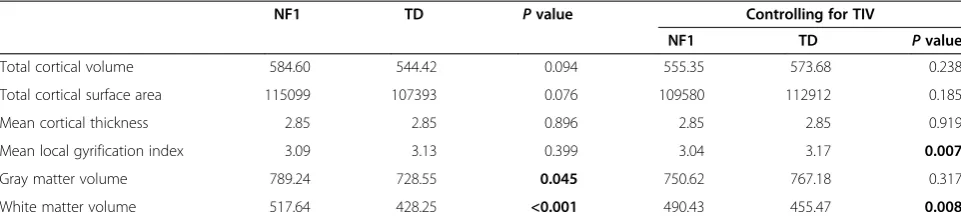
Children with NF1 showed a 10% increase in total intra-cranial volume (TIV) as compared with the TD group (NF1: 1658 ± 127 cm3; TD: 1505 ± 138 cm3; t(26)= 3.041,
P= 0.005). This overall increase was more attributable to an increase in WM (20%) (NF1: 517 ± 61 cm3; TD: 428 ± 46 cm3; t(26)= 4.340,P <0.001) than GM (8%), including
cortical and subcortical GM (NF1: 789 ± 78 cm3; TD: 728 ± 74 cm3; t(26)= 2.104,P= 0.045). After controlling
for TIV, only WM remained different between groups (WM: F(1,25)= 8.344,P= 0.008; GM: F(1,25)= 1.044,P=
0.317), Table 2. Age was not significantly correlated with TIV for our subjects (r = 0.067,P= 0.736).
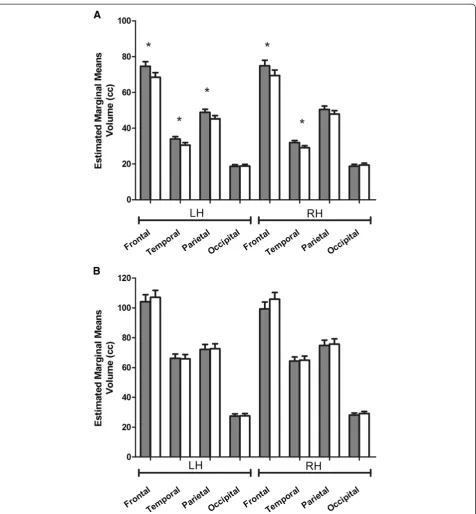
We next examined overall volumetric differences at the lobar level. Results for WM are displayed in Figure 1A. Group differences in WM were reflected by a main effect of group (F(1,25) = 8.028,P = 0.009), two-way interactions
between hemisphere and group (F(1,25)= 5.287,P= 0.030)
and lobe and group (F(3,75)= 6.758, P<0.001). Follow-up
multivariate ANCOVA controlling for TIV, revealed that the left and right frontal lobes were significantly larger in patients (left frontal lobe: F(1,25)= 10.456,P= 0.003; right
frontal lobe: F(1,25)= 5.786,P= 0.026), as well as left and
right temporal lobes (left temporal lobe: F(1,25)= 10.930,P
= 0.003; right temporal lobe: F(1,25)= 12.125,P = 0.002).
However only the left hemisphere parietal lobe was signifi-cantly larger (left parietal lobe: F(1,25) = 7.980, P = 0.009;
differences were observed for the occipital lobe (left oc-cipital lobe: F(1,25) = 0.078, P = 0.782; right occipital
lobe: F(1,25) = 0.713, P = 0.406). Results for GM are
displayed in Figure 1B. The lobar GM volumes included only cortical volumes and resulted in no significant effect of group and no interaction between group and lobe. Nonetheless, we found a significant two-way interaction between hemisphere and group (F(1,25)= 8.468,P= 0.007).
At the cerebellar level, neither the cerebellar WM (left hemisphere: F(1,25)= 0.042, P= 0.840; right hemisphere:
F(1,25) = 1.908, P = 0.179), nor the GM volumes (left
hemisphere: F(1,25)= 0.331, P= 0.570; right hemisphere:
F(1,25) = 0.612, P = 0.441) were statistically different
between patients and TD children.
Total cortical measurements of volume, thickness and surface area were not different between patients with NF1 and TD children. However, mean LGI is signifi-cantly reduced in patients with NF1 when the increased intracranial volume in the patient group is taken into ac-count (see Table 2).
Subcortical regional brain volumes
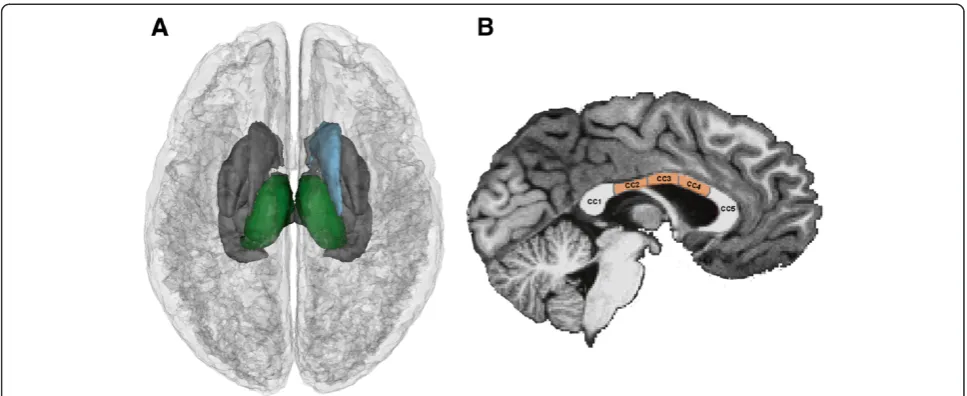
Children with NF1 showed increased volumes of the thalami, the right caudate and the mid regions of the corpus callosum (mid-posterior, central, mid-anterior), Figure 2. These regions remained significant after cor-recting for multiple comparisons (FDR,q= 0.1), Table 3. Adding age or IQ as a covariates to the ANCOVA did not change the results.
Cortical volume, cortical thickness and cortical surface area regional analyses
Cortical volume group differences, investigated using repeated measures ANCOVA with TIV as covariate, resulted in no main effect of group (F(1,25)= 0.690,P = 0.414), but
statistically significant two-way interactions between region and group (F(33,825)= 1.651, P= 0.013) and hemisphere
and group (F(1,25) = 8.058,P= 0.009). Repeated measures
ANCOVA of cortical thickness measurements resulted in no statistically significant effect of group (F(1,25)= 1.084,
P= 0.308), but a significant effect of brain region (F(33,825)=
5.870,P<0.001), a two-way interaction between region and group (F(33,825) = 1.522, P= 0.031) and a three-way
inter-action between hemisphere, region and group (F(33,825) =
1.455, P = 0.049). The results for cortical surface area resemble those found for cortical volume and cortical thickness, with no significant effect of group (F(1,25) =
0.378, P = 0.544). Nevertheless, we observed a signifi-cant two-way interaction between hemisphere and group (F(1,25)= 6.061,P= 0.021). Significant interactions observed
for the regional cortical analyses were explored in multi-variate ANCOVAs. However, none of these differences sur-vived correction for multiple comparisons (FDR,q = 0.1), Additional file 1: Table S1.
Gyrification index
The gyrification index showed a significant effect of group (F(1,25)= 10.400,P= 0.003), an effect of region (F(33,825)=
3.263,P<0.001) and a two-way interaction between region and group (F(33,825) = 2.591,P <0.001). Follow-up
multi-variate ANCOVA showed that patients with NF1 have reduced gyrification mainly in frontal and temporal lobar regions, but also in the insula, parietal, occipital and cingulate gyri, Table 4 and Figure 3. After correction for multiple comparisons several gyral regions remained statistically significant: left and right superior frontal, left and right superior temporal, right middle temporal and right transverse temporal (FDR, q = 0.05). The majority of gyral regions remained significant at FDR, q = 0.1 (Table 4). Adding age or IQ as covariates to the repeated measures ANCOVA and follow-up ANCOVAs did not change the results.
Brain size and folding relationships
In humans, the volume of the brain and the area of its cortical surface are strongly correlated [51]. This rela-tion is such that larger brains are normally accompanied by a higher increase in surface area than would be expected by mere scaling of the brain. Furthermore, increased fold-ing is necessary for compactness of connections [52,53].
Table 2 Results of whole-brain analyses
NF1 TD Pvalue Controlling for TIV
NF1 TD Pvalue
Total cortical volume 584.60 544.42 0.094 555.35 573.68 0.238
Total cortical surface area 115099 107393 0.076 109580 112912 0.185
Mean cortical thickness 2.85 2.85 0.896 2.85 2.85 0.919
Mean local gyrification index 3.09 3.13 0.399 3.04 3.17 0.007
Gray matter volume 789.24 728.55 0.045 750.62 767.18 0.317
White matter volume 517.64 428.25 <0.001 490.43 455.47 0.008
Mean values after controlling for total intracranial volume represent estimate marginal means. Bold represents significant results (P<0.05). Volumes are expressed in cm3
, surface in mm2
, and thickness in mm.
Indeed, when brain volume and surface area are plotted in a logarithmic scale the slope of the regression line obtained indicates a disproportionate expansion of the cerebral cor-tex in relation to brain volume, a result that is related to increased gyrification. Therefore we investigated whether this relationship was preserved in NF1.
Figure 4A shows the relationship between cortical sur-face area and intracranial volume for patients with NF1 and TD children after controlling for age and gender, plotted in a log-log graph. TIV is correlated with surface area in both groups (NF1: r = 0.765, P= 0.004; TD: r = 0.882, P <0.001). The slope of the regression line is Figure 1Lobar volumes in patients with neurofibromatosis type 1 (NF1) (gray bars) and typically developing children (white bars).
0.928 for NF1 and 1.095 for TD children, higher than the value expected for an isometric scaling (2/3) as observed in the human brain [51].
To investigate whether the degree of cortical folding is related with measurements of TIV, surface area and cor-tical thickness, we performed partial correlations between these variables, controlling for age and gender. LGI was only positively correlated with TIV for TD subjects (NF1: r = 0.418, P = 0.176; TD: r = 0.765, P = 0.004), Figure 4B. The cortical surface area was correlated with LGI for both groups (NF1: r = 0.696,P= 0.012; TD: r = 0.877, P <0.001), Figure 4C; while LGI and cortical thickness were not correlated for any of the groups (not shown), consistent with prior studies [54-56].
Discussion
In this study, we used computational methods to exam-ine the impact of NF1, a single gene disorder, on multi-dimensional morphological brain traits. This is the first study to examine measurements of cortical thickness, cor-tical surface area and gyrification in this common neurode-velopmental genetic condition. We confirmed that children with NF1 have larger intracranial volumes than typically developing children (approximately 10%) and our find-ings indicate that this enlargement is mainly a result of increased WM volume. At the lobar level, our results indicate that patients with NF1 have larger WM volumes in the frontal lobe (consistent with prior studies [15,16,22]), temporal lobe (in agreement with voxel-based morph-ometry findings in a partly overlapping cohort [22]), and left parietal lobe. We did not find alterations in
the occipital lobe. Our lobar data is in agreement with the notion that WM alterations are predominant in anterior brain regions. We also observed a parallel in-crease in GM volume in patients with NF1, a result attributable to larger subcortical rather than cortical volumes.
Measurements of subcortical regional volumes indi-cated that the thalami, the right caudate nucleus and the mid portions of the corpus callosum are significantly lar-ger in patients with NF1 than TD children.
This study is the first, to the best of our knowledge, to report a volumetric alteration of the thalami in children with NF1. Moreover, we have previously identified this structure as belonging to a spatial pattern that signifi-cantly contributes to discriminate between brains from patients with NF1 and brains from controls [22]. Other studies have reported thalamic hypometabolism [20], T1
reduction [14] and abnormal choline content [21], pos-sibly reflecting altered myelination.
The thalamus is a highly interactive structure with wide-spread connections to multiple cortical regions, and it provides selection and transformation of different sensory inputs to the cortex. The various nuclei of the thalamus are involved in the integration of sensory and motor infor-mation, memory and executive functions [57], compe-tences in which NF1 patients show disabilities [4,58,59].
while there is also evidence accumulating indicative of an involvement in goal-directed behavior [60]. It is widely connected with the frontal lobe and particularly with the dorsolateral prefrontal cortex [61,62], which is involved in working memory and executive function. A recent func-tional MRI (fMRI) study showed abnormal right caudate activation in NF1 in a spatial working memory task [63]. Moreover, Schrimsher et al. [64] observed that children with a greater degree of right to left caudate volume asym-metry show subclinical inattentive behaviors that define attention-deficit hyperactivity disorder (ADHD). Interest-ingly, there is a high incidence of ADHD in NF1 [4].
Finally, the enlargement observed in the midline por-tion of the corpus callosum corroborates previous reports from our group, in a partly overlapping cohort, using an independent method [22] and others [14,31-34]. Be-sides morphometric abnormalities, there is evidence of altered microstructure of the corpus callous in NF1 [65,66]. Behaviorally, higher volumes of corpus callosum
Table 3 Results of analysis of covariance (ANCOVA) in subcortical regions
Region Hemisphere Volume
F Pvalue DoD
Thalamus L 6.106 0.021a +
R 9.415 0.005a +
Caudate L 3.468 0.074
R 6.861 0.015a +
Putamen L 0.610 0.442
R 0.335 0.568
Pallidum L 0.344 0.563
R 0.023 0.880
Hippocampus L 3.942 0.058
R 0.108 0.746
Amygdala L 0.235 0.632
R 1.358 0.255
Accumbens area L 1.525 0.228
R 3.140 0.089
Ventral diencephalon L 4.242 0.050
R 2.748 0.110
CC posterior 3.676 0.067
CC mid-posterior 5.587 0.026a +
CC central 6.004 0.022a +
CC mid-anterior 8.919 0.006a +
CC anterior 2.902 0.101
Brainstem 2.563 0.122
Bold represents significant results (P <0.05).
a
Represents significant results after correction for multiple comparisons with FDR (q= 0.1). A plus sign indicate the direction (upwards) of the group difference, + = NF1 > typically developing subjects.
DoD = direction of difference; CC = corpus callosum; L = left; R = right; TIV = total intracranial volume.
Table 4 Results of analysis of covariance (ANCOVA) for local gyrification index in gyral regions
Gyral region Hemisphere Local gyrification index
F Pvalue DoD
Frontal lobe
Superior frontal L 12.315 0.002b
-R 11.938 0.002b
-Caudal middle frontal L 1.074 0.310
R 5.046 0.034a
-Rostral middle frontal L 4.036 0.055
R 1.870 0.184
Pars opercularis L 7.575 0.011a
-R 4.071 0.054
Pars triangularis L 3.860 0.061
R 2.009 0.169
Pars orbitalis L 8.324 0.008a
-R 4.869 0.037a
-Lateral orbitofrontal L 7.702 0.010a
-R 1.797 0.192
Medial orbitofrontal L 6.298 0.019a
-R 4.472 0.045
-Precentral L 5.693 0.025a
-R 6.354 0.018a
-Paracentral L 5.165 0.032a
-R 2.847 0.104
Frontal pole L 6.768 0.015a
-R 1.366 0.253
Temporal lobe
Superior temporal L 11.052 0.003b
-R 24.242 <0.001b
-Middle temporal L 5.876 0.023a
-R 18.742 <0.001b
-Inferior temporal L 0.312 0.582
R 4.855 0.037a
-Entorhinal L 2.504 0.126
R 6.935 0.014a
-Fusiform L 0.044 0.836
R 1.095 0.305
Parahippocampal L 0.013 0.911
R 0.529 0.474
Temporal pole L 3.399 0.077
R 5.442 0.028a
-Transverse temporal L 3.517 0.072
R 14.003 0.001b
-Banks superior temporal sulcus L 0.190 0.667
-were previously related to low IQ, impaired visuospatial and motor skills and learning problems in children with NF1 [17,34]. Interestingly, we observed that the volume of the corpus callosum remains abnormal even for nor-mal IQs.
Unlike the specific observations concerning subcortical structures, examination of cortical measurements indi-cated that alterations in cortical volume, cortical surface area and cortical thickness are not significant. Gyrifica-tion index was the only changed measure in cortex.
One of the most evident features of human evolution is the increase in brain size [67]. In response to evolu-tionary demands, a high level of gyrification occurred in parallel with an increase in cortical GM in order to maximize the cortical surface while maintaining a smal-ler intracranial size [68]. The increase in folding in big-ger brains seems to be necessary for the formation of efficient corticocortical connections in larger volumes [52,53]. This evolutionary trait appears disrupted in NF1, with an increase in brain size without a corresponding adaptive increase in folding. Accordingly, the correlation observed in TD children between LGI and intracranial volume is absent in NF1, indicating that patients with NF1 present lower gyrification indices than would be expected for their brain volume. The phylogenetic development of gyral and sulcal folds likely optimizes compaction of neur-onal fibers while keeping neurneur-onal signaling at an efficient transit time [52,53]. Given that abnormal cortical folding may reflect deficits in structural and, consequently, func-tional cortical connectivity, we will speculate on potential links between cortical folding abnormalities and the pat-terns of cognitive dysfunction that characterize the NF1 phenotype.
Concerning the cognitive phenotype related to cortical functions, executive functions have been reported to be impaired in children with NF1 [59,69], even when control-ling for IQ [59]. Here, we observed lower LGI in several frontal lobe regions that could underlie executive impair-ments, namely the superior frontal gyri [70], right frontal pole [71]and orbitofrontal regions [72,73]. Moreover, the anterior cingulate cortex was also found to have lower LGI values in NF1 and it plays a role in attention and error detection [74]. Interestingly, we have previously found an abnormal activity pattern in this region using an overlapping cohort of subjects [35], possibly related with a deficit in default-mode network function.
Patients with NF1 have deficits in expressive and re-ceptive language, vocabulary and phonologic awareness [58]. Previously, a correlation has been reported between verbal skills in NF1 and the inferior frontal gyrus morphology, such that individuals with‘typical’gyral pat-terns in the right hemisphere performed worse across language measures than those showing ‘atypical’ gyrus [75]. Here, we observed a deficit in gyrification in regions involved with language functions, namely in regions belonging to the Broca’s complex (pars opercu-laris, pars orbitalis, pars triangularis) [76,77], superior temporal gyrus and middle temporal gyrus [78,79] and supramarginal gyrus [80,81]. Moreover, right transverse temporal gyrus, known as the Heschl’s gyrus, also pre-sented lower LGIs in patients. Abnormalities in the in-ferior frontal gyrus and Heschl’s gyrus were associated with performance across language and neuropsycho-logical measures in individuals with NF1 [75].
Table 4 Results of analysis of covariance (ANCOVA) for local gyrification index in gyral regions(Continued)
Parietal lobe
Superior parietal L 1.640 0.212
R 0.125 0.727
Inferior parietal L 0.220 0.643
R 1.463 0.238
Supramarginal L 2.117 0.158
R 5.233 0.031a
-Postcentral L 6.597 0.017a
-R 9.344 0.005a
-Precuneus L 3.117 0.090
R 3.762 0.064
Occipital lobe
Lateral occipital L 0.719 0.405
R 0.498 0.487
Lingual L 0.253 0.620
R 2.862 0.103
Cuneus L 3.589 0.070
R 4.317 0.048
-Pericalcarine L 1.915 0.179
R 5.044 0.034a
-Rostral anterior cingulate L 4.848 0.037a
-R 5.487 0.027a
-Caudal anterior cingulate L 6.789 0.015a
-R 3.213 0.085
Posterior cingulate L 2.052 0.164
R 3.165 0.087
Isthmus cingulate L 0.213 0.648
R 2.808 0.106
Insula L 7.013 0.014a
-R 5.616 0.026a
-Bold represents significant results (P <0.05).
a
andb
Represent significant results after correction for multiple comparisons with false discovery rate (FDR),a
(q= 0.1) andb
(q= 0.05 or 0.1). Minus indicates the direction of the group difference, - = NF1 < typically developing subjects.
Motor deficits for both simple and complex motor tasks have been reported in NF1 [58,82,83] consistent with the observed bilateral deficits in LGI in both precentral and paracentral gyri, underlying motor functions [84].
In spite of our identification of altered patterns of gyri-fication in regions underlying cognitive deficits typically observed in children with NF1, this was not the case for
the posterior parietal lobe. This is rather surprising given that visuospatial deficits are considered a hallmark of the NF1 cognitive phenotype. This might be explained by the suggestion that other brain regions such as frontoexecu-tive regions contribute to the pattern of impairment observed in specific visuospatial tests (that is, judgment of line orientation test).
Figure 4Brain size and folding relationships in neurofibromatosis type 1 (NF1) (gray) and typically developing children (TD) (black), taking into account age and gender. (A)Cortical surface area versus intracranial volume (log-log graph).(B)Local gyrification index (LGI) versus intracranial volume.(C)LGI versus surface area.
In agreement with the notion of impaired low-level visual processing in NF1 [35,85], we observed lower LGI in the right cuneus and pericalcarine regions.
It is estimated that around 30% of phenotypic variance in gyrification is attributed to genetic variation [86]. There-fore, the observed reductions in LGI point towards early abnormalities in control over neuronal migration or proliferation. Deeper fissures develop earlier and are more strongly influenced by genetic processes and thus might be less susceptible to environmental perturba-tions. Insular sulci and the central sulcus are among the first macroscopical structures identified on the human fetal brain [87,88], and both the insula and the gyri sur-rounding the central sulcus presented less gyrification in NF1 than TD individuals.
The mechanisms that drive cortical folding remain poorly understood and there are different possible expla-nations for the observed abnormalities of cortical gyrifi-cation in NF1. The two most widely accepted hypothesis to explain gyrification are: (1) folding is caused by differ-ential growth of the cortex and (2) folding is caused by mechanical tension generated in axons. The first model proposes that differential growth rates of cortical layers directly affect the degree of cortical convolutions [89]. An alternate theory to this hypothesis suggests that changes in subcortical connections can lead to altered cortical folding patterns without changing the area of the cortical surface [90]. The second model, based on tension-based cortical morphogenesis, proposes that the mechan-ical tension along axons is the driving force for cortmechan-ical folding [91]. In line with this theory, we observed a signifi-cant increase in WM in the anterior NF1 brain accompan-ied by an enlargement of the corpus callosum. Moreover, diffusion tensor imaging studies showed altered micro-structure in several white matter regions [66]. Both mod-els are not necessarily contradictory and could jointly explain the gyral abnormalities in NF1.
The main limitation of the present study is that we investigated a large age range and we were limited to a relatively small number of participants. In that sense, longitudinal studies are clearly warranted to disentangle the complex genetic and non-genetic influences that contribute to the neuroanatomic and cognitive abnor-malities in NF1.
Conclusions
We found that the overall increase in intracranial volume in patients with NF1 can be explained by an enlarged WM volume in anterior brain regions and subcortical GM volumes, with a disproportionate increase in the volumes of the thalami, right caudate nucleus and corpus callosum. At the cortical level we observed abnormalities of gyrifica-tion, which could reflect developmental abnormalities in both cortical architecture and corticocortical connectivity.
This newly identified pattern of gyral malformation required quantitative tools such as LGI to be detected. Given the emphasis on a careful matching between patients and TD children we believe that the brain alterations observed in here are shaped primarily by genetically programmed anomalous neurodevelopment. The fact that neuroana-tomic abnormalities in patients with NF1 are localized to particular brain regions adds to the growing body of evi-dence that specific genes independently control the morph-ometry of specific cytoarchitectonic areas.
Additional file
Additional file 1:Supplementary material.
Competing interests
The authors have no financial or non-financial competing interests to declare.
Authors’contributions
IRV, MJR, ES and MCB conceptualized and designed the study. IRV collected and analyzed the data. All authors contributed to interpreting results and writing the manuscript. All authors read and approved the final manuscript.
Acknowledgements
We thank all the participants and their families for their involvement in this study. The authors wish to acknowledge the contributions of Carlos Ferreira and João Marques in technical assistance with scanning. This work was supported by the University of Coimbra (grant number III/14/2008) and the Portuguese Foundation for Science and Technology (grant numbers PIC/IC/ 83155/2007, PIC/IC/82986/2007, PTDC/SAU-ORG/118380, individual fellowships SFRH/BD/41348/2007 to IRV, SFRH/BPD/34392/2006 to MJR).
Author details
1Institute for Biomedical Imaging and Life Sciences, Faculty of Medicine,
University of Coimbra, Azinhaga de Santa Comba, Coimbra 3000-548, Portugal.2Department of Ophthalmology, Centro Hospitalar e Universitário de Coimbra, EPE, Av. Bissaya Barreto, Coimbra 3000-075, Portugal.
Received: 1 August 2012 Accepted: 22 January 2013 Published: 13 February 2013
References
1. Rakic P, Kornack DR:The Development and Evolutionary Expansion of the Cerebral Cortex in Primates. InEvolution of Nervous Systems. Edited by Kaas JH. Oxford: Academic Press; 2007:243–259.
2. Thompson PM, Cannon TD, Narr KL, van Erp T, Poutanen VP, Huttunen M, Lonnqvist J, Standertskjold-Nordenstam CG, Kaprio J, Khaledy M, Dail R, Zoumalan CI, Toga AW:Genetic influences on brain structure.Nat Neurosci2001,4:1253–1258.
3. Kayl AE, Moore BD 3rd:Behavioral phenotype of neurofibromatosis, type 1.Ment Retard Dev Disabil Res Rev2000,6:117–124.
4. Hyman SL, Shores A, North KN:The nature and frequency of cognitive deficits in children with neurofibromatosis type 1.Neurology2005, 65:1037–1044.
5. Ferner RE:Neurofibromatosis 1 and neurofibromatosis 2: a twenty first century perspective.Lancet Neurol2007,6:340–351.
6. Daston MM, Ratner N:Neurofibromin, a predominantly neuronal GTPase activating protein in the adult, is ubiquitously expressed during development.Dev Dyn1992,195:216–226.
7. Zhu Y, Guignard F, Zhao D, Liu L, Burns DK, Mason RP, Messing A, Parada LF:Early inactivation of p53 tumor suppressor gene cooperating with NF1 loss induces malignant astrocytoma.Cancer Cell2005,8:119–130. 8. Lush ME, Li Y, Kwon CH, Chen J, Parada LF:Neurofibromin is required for
9. Hegedus B, Dasgupta B, Shin JE, Emnett RJ, Hart-Mahon EK, Elghazi L, Bernal-Mizrachi E, Gutmann DH:Neurofibromatosis-1 regulates neuronal and glial cell differentiation from neuroglial progenitors in vivo by both cAMP- and Ras-dependent mechanisms.Cell Stem Cell2007,1:443–457. 10. Yunoue S, Tokuo H, Fukunaga K, Feng L, Ozawa T, Nishi T, Kikuchi A, Hattori S,
Kuratsu J, Saya H, Araki N:Neurofibromatosis type I tumor suppressor neurofibromin regulates neuronal differentiation via its GTPase-activating protein function toward Ras.J Biol Chem2003,278:26958–26969.
11. Fernandez-Medarde A, Santos E:The RasGrf family of mammalian guanine nucleotide exchange factors.Biochim Biophys Acta2011,1815:170–188. 12. Payne JM, Moharir MD, Webster R, North KN:Brain structure and function
in neurofibromatosis type 1: current concepts and future directions.J Neurol Neurosurg Psychiatry2010,81:304–309.
13. Said SM, Yeh TL, Greenwood RS, Whitt JK, Tupler LA, Krishnan KR:MRI morphometric analysis and neuropsychological function in patients with neurofibromatosis.Neuroreport1996,7:1941–1944.
14. Steen RG, Taylor JS, Langston JW, Glass JO, Brewer VR, Reddick WE, Mages R, Pivnick EK:Prospective evaluation of the brain in asymptomatic children with neurofibromatosis type 1: relationship of macrocephaly to T1 relaxation changes and structural brain abnormalities.AJNR Am J Neuroradiol2001,22:810–817.
15. Cutting LE, Huang GH, Zeger S, Koth CW, Thompson RE, Denckl MB: Growth curve analyses of neuropsychological profiles in children with neurofibromatosis type 1: specific cognitive tests remain "spared" and "impaired" over time.J Int Neuropsychol Soc2002,8:838–846. 16. Greenwood RS, Tupler LA, Whitt JK, Buu A, Dombeck CB, Harp AG, Payne
ME, Eastwood JD, Krishnan KR, MacFall JR:Brain morphometry, T2-weighted hyperintensities, and IQ in children with neurofibromatosis type 1.Arch Neurol2005,62:1904–1908.
17. Moore BD 3rd, Slopis JM, Jackson EF, De Winter AE, Leeds NE:Brain volume in children with neurofibromatosis type 1: relation to
neuropsychological status.Neurology2000,54:914–920.
18. DiMario FJ Jr, Ramsby GR, Burleson JA:Brain morphometric analysis in neurofibromatosis 1.Arch Neurol1999,56:1343–1346.
19. Billingsley RL, Schrimsher GW, Jackson EF, Slopis JM, Moore BD 3rd: Significance of planum temporale and planum parietale morphologic features in neurofibromatosis type 1.Arch Neurol2002,59:616–622. 20. Kaplan AM, Chen K, Lawson MA, Wodrich DL, Bonstelle CT, Reiman EM:
Positron emission tomography in children with neurofibromatosis-1.
J Child Neurol1997,12:499–506.
21. Wang PY, Kaufmann WE, Koth CW, Denckla MB, Barker PB:Thalamic involvement in neurofibromatosis type 1: evaluation with proton magnetic resonance spectroscopic imaging.Ann Neurol2000,47:477–484. 22. Duarte JV, Ribeiro MJ, Violante IR, Cunha G, Silva E, Castelo-Branco M:
Multivariate pattern analysis reveals subtle brain anomalies relevant to the cognitive phenotype in neurofibromatosis type 1.Hum Brain Mapp
2012, doi:10.1002/hbm.22161. Epub ahead of print.
23. Rakic P:A small step for the cell, a giant leap for mankind: a hypothesis of neocortical expansion during evolution.Trends Neurosci1995,18:383–388. 24. Armstrong E, Curtis M, Buxhoeveden DP, Fregoe C, Zilles K, Casanova MF, McCarthy WF:Cortical gyrification in the rhesus monkey: a test of the mechanical folding hypothesis.Cereb Cortex1991,1:426–432. 25. Raznahan A, Shaw P, Lalonde F, Stockman M, Wallace GL, Greenstein D,
Clasen L, Gogtay N, Giedd JN:How does your cortex grow?J Neurosci
2011,31:7174–7177.
26. Panizzon MS, Fennema-Notestine C, Eyler LT, Jernigan TL, Prom-Wormley E, Neale M, Jacobson K, Lyons MJ, Grant MD, Franz CE, Xian H, Tsuang M, Fischl B, Seidman L, Dale A, Kremen WS:Distinct genetic influences on cortical surface area and cortical thickness.Cereb Cortex2009,19:2728–2735. 27. Luders E, Narr KL, Thompson PM, Rex DE, Woods RP, Deluca H, Jancke L,
Toga AW:Gender effects on cortical thickness and the influence of scaling.Hum Brain Mapp2006,27:314–324.
28. Luders E, Narr KL, Bilder RM, Szeszko PR, Gurbani MN, Hamilton L, Toga AW, Gaser C:Mapping the relationship between cortical convolution and intelligence: effects of gender.Cereb Cortex2008,18:2019–2026. 29. Shaw P, Greenstein D, Lerch J, Clasen L, Lenroot R, Gogtay N, Evans A,
Rapoport J, Giedd J:Intellectual ability and cortical development in children and adolescents.Nature2006,440:676–679.
30. Narr KL, Bilder RM, Luders E, Thompson PM, Woods RP, Robinson D, Szeszko PR, Dimtcheva T, Gurbani M, Toga AW:Asymmetries of cortical shape: effects of handedness, sex and schizophrenia.Neuroimage2007,34:939–948.
31. Cutting LE, Cooper KL, Koth CW, Mostofsky SH, Kates WR, Denckla MB, Kaufmann WE:Megalencephaly in NF1: predominantly white matter contribution and mitigation by ADHD.Neurology2002,59:1388–1394. 32. Dubovsky EC, Booth TN, Vezina G, Samango-Sprouse CA, Palmer KM,
Brasseux CO:MR imaging of the corpus callosum in pediatric patients with neurofibromatosis type 1.AJNR Am J Neuroradiol2001,22:190–195. 33. Kayl AE, Moore BD 3rd, Slopis JM, Jackson EF, Leeds NE:Quantitative
morphology of the corpus callosum in children with neurofibromatosis and attention-deficit hyperactivity disorder.J Child Neurol2000,15:90–96. 34. Pride N, Payne JM, Webster R, Shores EA, Rae C, North KN:Corpus callosum
morphology and its relationship to cognitive function in neurofibromatosis type 1.J Child Neurol2010,25:834–841.
35. Violante IR, Ribeiro MJ, Cunha G, Bernardino I, Duarte JV, Ramos F, Saraiva J, Silva E, Castelo-Branco M:Abnormal Brain Activation in Neurofibromatosis Type 1: A Link between Visual Processing and the Default Mode Network.PLoS One2012,7:e38785.
36. National Institutes of Health Consensus Development Conference: Neurofibromatosis. Conference statement. National Institutes of Health Consensus Development Conference.Arch Neurol1988,45:575–578. 37. Ozonoff S:Cognitive impairment in neurofibromatosis type 1.Am J Med
Genet1999,89:45–52.
38. Wechsler D:Escala de Inteligência para Crianças - Terceira Edição (WISC-III): Manual. Lisboa, Portugal: Cegoc-Tea; 2003.
39. Dale AM, Fischl B, Sereno MI:Cortical surface-based analysis. I. Segmentation and surface reconstruction.Neuroimage1999,9:179–194. 40. Fischl B, Dale AM:Measuring the thickness of the human cerebral cortex
from magnetic resonance images.Proc Natl Acad Sci U S A2000, 97:11050–11055.
41. Fischl B, Salat DH, Busa E, Albert M, Dieterich M, Haselgrove C, van der Kouwe A, Killiany R, Kennedy D, Klaveness S, Montillo A, Makris N, Rosen B, Dale AM:Whole brain segmentation: automated labeling of
neuroanatomical structures in the human brain.Neuron2002,33:341–355. 42. Fischl B, Salat DH, van der Kouwe AJ, Makris N, Segonne F, Quinn BT, Dale
AM:Sequence-independent segmentation of magnetic resonance images.Neuroimage2004,23(Suppl 1):S69–84.
43. Fischl B, Liu A, Dale AM:Automated manifold surgery: constructing geometrically accurate and topologically correct models of the human cerebral cortex.IEEE Trans Med Imaging2001,20:70–80.
44. Segonne F, Pacheco J, Fischl B:Geometrically accurate topology-correction of cortical surfaces using nonseparating loops.IEEE Trans Med Imaging2007,26:518–529.
45. Fischl B, Sereno MI, Tootell RB, Dale AM:High-resolution intersubject averaging and a coordinate system for the cortical surface.Hum Brain Mapp1999,8:272–284.
46. Schaer M, Cuadra MB, Tamarit L, Lazeyras F, Eliez S, Thiran JP:A surface-based approach to quantify local cortical gyrification.IEEE Trans Med Imaging2008,27:161–170.
47. Desikan RS, Segonne F, Fischl B, Quinn BT, Dickerson BC, Blacker D, Buckner RL, Dale AM, Maguire RP, Hyman BT, Albert MS, Killiany RJ:An automated labeling system for subdividing the human cerebral cortex on MRI scans into gyral based regions of interest.Neuroimage2006,31:968–980. 48. Buckner RL, Head D, Parker J, Fotenos AF, Marcus D, Morris JC, Snyder AZ:A
unified approach for morphometric and functional data analysis in young, old, and demented adults using automated atlas-based head size normalization: reliability and validation against manual
measurement of total intracranial volume.Neuroimage2004,23:724–738. 49. Salat DH, Greve DN, Pacheco JL, Quinn BT, Helmer KG, Buckner RL, Fischl B: Regional white matter volume differences in nondemented aging and Alzheimer's disease.Neuroimage2009,44:1247–1258.
50. Benjamini Y, Hochberg Y:Controlling the False Discovery Rate - a Practical and Powerful Approach to Multiple Testing.Journal of the Royal Statistical Society Series B-Methodological1995,57:289–300.
51. Toro R, Perron M, Pike B, Richer L, Veillette S, Pausova Z, Paus T:Brain size and folding of the human cerebral cortex.Cereb Cortex2008,18:2352–2357. 52. Murre JM, Sturdy DP:The connectivity of the brain: multi-level
quantitative analysis.Biol Cybern1995,73:529–545.
53. Ruppin E, Schwartz EL, Yeshurun Y:Examining the volume efficiency of the cortical architecture in a multi-processor network model.Biol Cybern
1993,70:89–94.
cortical thickness and gyrification patterns mapped in children with 22q11.2 deletions.Cereb Cortex2009,19:115–126.
55. Lin JJ, Salamon N, Lee AD, Dutton RA, Geaga JA, Hayashi KM, Luders E, Toga AW, Engel J Jr, Thompson PM:Reduced neocortical thickness and complexity mapped in mesial temporal lobe epilepsy with hippocampal sclerosis.Cereb Cortex2007,17:2007–2018.
56. Thompson PM, Lee AD, Dutton RA, Geaga JA, Hayashi KM, Eckert MA, Bellugi U, Galaburda AM, Korenberg JR, Mills DL, Toga AW, Reiss AL: Abnormal cortical complexity and thickness profiles mapped in Williams syndrome.J Neurosci2005,25:4146–4158.
57. Schmahmann JD, Pandya DN:Disconnection syndromes of basal ganglia, thalamus, and cerebrocerebellar systems.Cortex2008,44:1037–1066. 58. Levine TM, Materek A, Abel J, O'Donnell M, Cutting LE:Cognitive profile of
neurofibromatosis type 1.Semin Pediatr Neurol2006,13:8–20. 59. Roy A, Roulin JL, Charbonnier V, Allain P, Fasotti L, Barbarot S, Stalder JF,
Terrien A, Le Gall D:Executive dysfunction in children with
neurofibromatosis type 1: a study of action planning.J Int Neuropsychol Soc2010,16:1056–1063.
60. Grahn JA, Parkinson JA, Owen AM:The cognitive functions of the caudate nucleus.Prog Neurobiol2008,86:141–155.
61. Kemp JM, Powell TP:The cortico-striate projection in the monkey.Brain
1970,93:525–546.
62. Yeterian EH, Van Hoesen GW:Cortico-striate projections in the rhesus monkey: the organization of certain cortico-caudate connections.Brain Res1978,139:43–63.
63. Shilyansky C, Karlsgodt KH, Cummings DM, Sidiropoulou K, Hardt M, James AS, Ehninger D, Bearden CE, Poirazi P, Jentsch JD, Cannon TD, Levine MS, Silva AJ:Neurofibromin regulates corticostriatal inhibitory networks during working memory performance.Proc Natl Acad Sci U S A2010, 107:13141–13146.
64. Schrimsher GW, Billingsley RL, Jackson EF, Moore BD 3rd:Caudate nucleus volume asymmetry predicts attention-deficit hyperactivity disorder (ADHD) symptomatology in children.J Child Neurol2002,17:877–884. 65. Wignall EL, Griffiths PD, Papadakis NG, Wilkinson ID, Wallis LI, Bandmann O,
Cowell PE, Hoggard N:Corpus callosum morphology and microstructure assessed using structural MR imaging and diffusion tensor imaging: initial findings in adults with neurofibromatosis type 1.AJNR Am J Neuroradiol2010,31:856–861.
66. Zamboni SL, Loenneker T, Boltshauser E, Martin E, Il'yasov KA:Contribution of diffusion tensor MR imaging in detecting cerebral microstructural changes in adults with neurofibromatosis type 1.AJNR Am J Neuroradiol
2007,28:773–776.
67. Passingham RE:Anatomical differences between the neocortex of man and other primates.Brain Behav Evol1973,7:337–359.
68. Zilles K, Armstrong E, Schleicher A, Kretschmann HJ:The human pattern of gyrification in the cerebral cortex.Anat Embryol (Berl)1988,179:173–179. 69. Payne JM, Hyman SL, Shores EA, North KN:Assessment of executive
function and attention in children with neurofibromatosis type 1: relationships between cognitive measures and real-world behavior.Child Neuropsychol2011,17:313–329.
70. du Boisgueheneuc F, Levy R, Volle E, Seassau M, Duffau H, Kinkingnehun S, Samson Y, Zhang S, Dubois B:Functions of the left superior frontal gyrus in humans: a lesion study.Brain2006,129:3315–3328.
71. Tsujimoto S, Genovesio A, Wise SP:Frontal pole cortex: encoding ends at the end of the endbrain.Trends Cogn Sci2011,15:169–176.
72. Elliott R, Dolan RJ, Frith CD:Dissociable functions in the medial and lateral orbitofrontal cortex: evidence from human neuroimaging studies.Cereb Cortex2000,10:308–317.
73. Zald DH, Andreotti C:Neuropsychological assessment of the orbital and ventromedial prefrontal cortex.Neuropsychologia2010,48:3377–3391. 74. Bush G, Luu P, Posner MI:Cognitive and emotional influences in anterior
cingulate cortex.Trends Cogn Sci2000,4:215–222.
75. Billingsley RL, Slopis JM, Swank PR, Jackson EF, Moore BD 3rd:Cortical morphology associated with language function in neurofibromatosis, type I.Brain Lang2003,85:125–139.
76. Hagoort P:On Broca, brain, and binding: a new framework.Trends Cogn Sci2005,9:416–423.
77. Xiang HD, Fonteijn HM, Norris DG, Hagoort P:Topographical functional connectivity pattern in the perisylvian language networks.Cereb Cortex
2010,20:549–560.
78. Cabeza R, Nyberg L:Imaging cognition II: An empirical review of 275 PET and fMRI studies.J Cogn Neurosci2000,12:1–47.
79. Chao LL, Haxby JV, Martin A:Attribute-based neural substrates in temporal cortex for perceiving and knowing about objects.Nat Neurosci
1999,2:913–919.
80. Gough PM, Nobre AC, Devlin JT:Dissociating linguistic processes in the left inferior frontal cortex with transcranial magnetic stimulation.J Neurosci2005,25:8010–8016.
81. Hartwigsen G, Baumgaertner A, Price CJ, Koehnke M, Ulmer S, Siebner HR: Phonological decisions require both the left and right supramarginal gyri.Proc Natl Acad Sci U S A2010,107:16494–16499.
82. Feldmann R, Denecke J, Grenzebach M, Schuierer G, Weglage J: Neurofibromatosis type 1: motor and cognitive function and T2-weighted MRI hyperintensities.Neurology2003,61:1725–1728. 83. Rowbotham I, Pit-ten Cate IM, Sonuga-Barke EJ, Huijbregts SC:Cognitive
control in adolescents with neurofibromatosis type 1.Neuropsychology
2009,23:50–60.
84. Purves D, Williams SM:Neuroscience. 2nd edition. Sunderland, MA: Sinauer Associates; 2001.
85. Clements-Stephens AM, Rimrodt SL, Gaur P, Cutting LE:Visuospatial processing in children with neurofibromatosis type 1.Neuropsychologia
2008,46:690–697.
86. Rogers J, Kochunov P, Zilles K, Shelledy W, Lancaster J, Thompson P, Duggirala R, Blangero J, Fox PT, Glahn DC:On the genetic architecture of cortical folding and brain volume in primates.Neuroimage2010,53:1103–1108. 87. Rajagopalan V, Scott J, Habas PA, Kim K, Corbett-Detig J, Rousseau F,
Barkovich AJ, Glenn OA, Studholme C:Local tissue growth patterns underlying normal fetal human brain gyrification quantified in utero.
J Neurosci2011,31:2878–2887.
88. Afif A, Bouvier R, Buenerd A, Trouillas J, Mertens P:Development of the human fetal insular cortex: study of the gyration from 13 to 28 gestational weeks.Brain Struct Funct2007,212:335–346.
89. Caviness VS Jr:Mechanical model of brain convolutional development.
Science1975,189:18–21.
90. Kostovic I, Rakic P:Developmental history of the transient subplate zone in the visual and somatosensory cortex of the macaque monkey and human brain.J Comp Neurol1990,297:441–470.
91. Van Essen DC:A tension-based theory of morphogenesis and compact wiring in the central nervous system.Nature1997,385:313–318.
doi:10.1186/1866-1955-5-3
Cite this article as:Violanteet al.:Gyrification, cortical and subcortical morphometry in neurofibromatosis type 1: an uneven profile of developmental abnormalities.Journal of Neurodevelopmental Disorders 2013,5:3.
Submit your next manuscript to BioMed Central and take full advantage of:
• Convenient online submission
• Thorough peer review
• No space constraints or color figure charges
• Immediate publication on acceptance
• Inclusion in PubMed, CAS, Scopus and Google Scholar
• Research which is freely available for redistribution