M E T H O D O L O G Y
Open Access
Dissecting organ-specific transcriptomes through
RNA-sequencing
Shan Guan and Yingqing Lu
*Abstract
Background:Organ-specific gene expression contains rich information aboutin vivobiological processes. This kind of information, previously gathered through microarray profiling, has been proven fruitful to the understanding of specific mutants, regulatory events, signaling, and development. With the advent of the next-generation
sequencing (NGS) of RNAs, more quantitative and detailed information of gene expressions than previously available can now be collected for each organ or organ developmental stages. The combination of an object-oriented experimental design and an efficient treatment of the high volume information generated through a NGS platform may offer a powerful tool for inferring previously intractable developmental processes.
Results:We collected transcriptomic data over a Solexa/Illumina platform on samples ofIpomoealeaf, sepal, and petals (at three developmental stages), and presented a method for analyzing transcriptomic variations within and between organs. We demonstrated thatin vivosignals of transcriptomes can be retrievedde novothrough the NGS techniques, proper data handling, bioinformatic tools, and the current understanding of molecular networks. We found that numbers of transcribed genes from both nuclear and chloroplast genomes decreased by the same order of leaf→sepal→petal. Petal resembled leaf in cell division patterns and abundance level of commonly expressed organelle genes. Its chloroplast transcripts constituted a subset of those in leaf. Moreover, reconstructions of multiple metabolic networks for each organ enabled inferences of substance flow, providing transcript evidence for the path of sucrose in leaf to anthocyanin synthesis in petal.
Conclusion:Our results attest that developmental transcriptomes are highly informative for exploring connections between morphological traits and the associated molecular networks. Significant hypotheses have been developed, including that the petal is a derived organ of leaf and that its color can be modified by fluctuations of substance flow within the associated metabolic networks among organs.
Keywords:Paired-end reads, Transcriptome assembly, Organ development, Molecular network, Within-genet genomic variation
Background
Organ differentiation in multi-cellular organisms depends on highly organized molecular events and brings en-hanced functionalities to the organisms for their adapta-tions to natural environments. This differentiation appears to be closely linked to genomic gene expression, as organs contribute most significantly to gene expression variation when compared to all other experimental variables [1]. Organs are connected by substance flow to maintain their overall functions, but the details of which have yet to be
made clear at cellular and molecular levels. Knowing these details has significant bearings on understanding how mo-lecular systems control cellular activities and associated phenotypes. Although a significant spot light has been given to gene regulation in interpreting developmental and phenotypic variation [2-4], much is yet to be known on how such gene regulation is realized on the genomic scale and what information is conveyed between cells and organs to keep the integrity of a genet. Here, we focus on the logic and ways of extracting information from sequence-based transcriptomes to shed light on relevant issues.
Key issues on organ functionality include how sub-stance flow connects organs and how the flow is
* Correspondence:[email protected]
State Key Laboratory of Systematic and Evolutionary Botany, Institute of Botany, Chinese Academy of Sciences, 20 Nan Xin Cun, Xiangshan, Beijing 100093, China
regulated at the whole plant level. These issues concern numerous biological processes at cellular and organ levels, requesting solutions of genomic scope. A genome-based transcriptome has been known to be sensitive to both developmental and environmental signals [5,6], thus is a natural starting point for explorations of organ-specific expressions. The collective gene expressions may provide information at two levels. One is anin vivoprofile of tran-script abundances of the living cells, and the other is a snapshot of genomic regulation. These kinds of informa-tion are highly useful in the light of recent findings that significant correlations exist between transcriptomic and protein profiles in roots of Arabidopsis [7] and human stem cells [8]. At least in these cases, it is possible to trace back dynamics of cellular and molecular activities to changes in transcriptomes. In a large picture, the correla-tions are expected to be held broadly in living cells, be-cause they allow genomic regulations to be effective without involving other mechanisms for many molecular systems. Even in cases of transcriptional or post-translational modifications, knowing transcript dynamics is still a prerequisite for analysis of the modifications. Sys-tematic analysis of transcriptomes may therefore yield use-ful inferences on both venues and mechanisms of various molecular systems in cells.
Technically, new biotechnologies such as the next gen-eration sequencing (NGS) have dramatically increased the likelihood of obtaining in vivo information embed-ded in cells. The most cost-effective platforms in NGS are ones capable of producing short-read sequences in high throughputs and at an affordable price [9,10]. The reliability of the NGS data has been confirmed in several cases [11], but analysis of genomic expression patterns awaits further improvements. Obviously, an effective analysis of transcriptomes critically replies on both the sampling scheme and the quality of transcriptome re-constructions. We show that it is attainable now to carry out quantitative analysis of transcriptomes collected at cell and organ levels with NGS short-read assembly methods [12-14]. More significantly, the transcriptomic reconstruction can be performed in a species without genome reference. The de novo approach is highly at-tractive for genetically less studied or refractory species, potentially accelerating scientific discoveries.
Examples are given here to illustrate how to use thede novoapproach to address issues on cellular activities and substance flow within a developing organ and between organs. Three organs - leaf, sepal, and petal - in the common morning glory (Ipomoea purpurea) are consid-ered here, and an experiment is designed to focus on petal developmental stages, particularly the onset and pro-gressive anthocyanin synthesis in the corolla. The tran-scriptomes of the sepal and the leaf on the same genet serve as comparison bases for analysis of the petal
transcriptomes. By reconstructing developmental and organ-specific transcriptomes and connecting well-built transcriptomes to the current knowledge on cellular/ molecular activities, we are able to reveal unprecedented details on cellular dynamics during the petal development, providing concrete evidence for inferring substance flow between organs and within petal developmental stages. The inferences shed much light on the origin of petals, while providing a rich context in which different molecu-lar systems are interconnected and regulated to render specific functions.
Results and discussion
Transcriptomic reconstruction, classification, evaluation, and quantification
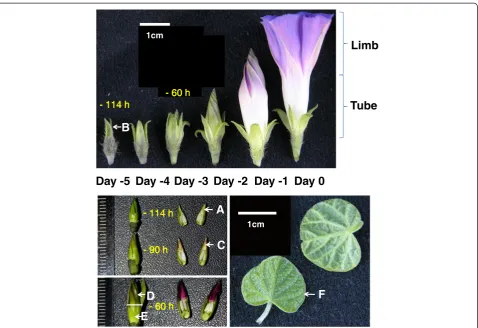
Petals and leaves are excellent model systems for onto-genetic investigations of various biological processes [15,16]. Petal's developmental stage can be easily deter-mined through morphological characteristics, and leaves may be classified by size to ensure a repeatable sampling. To characterize organ-specific gene expressions and sub-stance flow between organs on a genet of the common morning glory, we focused on three developmental stages of petals collected in four samples, taking one stage of sepal and another of leaf as reference samples (Figure 1). Thede novoassemblies via Trinity [14] incor-porated 83% - 89% of the raw data in the scaffold building (Table 1). The depths of the assembled transcriptomes were estimated between 25 to 38 for samples A→F (A:25.3, B:26.2, C:28.1, D:33.1, E:33.0, F:37.9). To aid sam-ple comparisons, we lumped all contigs across the samsam-ples to generate a final assembly using TGICL [17], which yielded 90451 scaffold sequences in total (accession GALY01000000). About 70% of the scaffolds were anno-tated by the reference of uniref50 (ftp.ebi.ac.uk/pub/data-bases/uniprot/, up to April of 2012), and about half of the reads could be associated with known functions. Each sample was then mapped to the final assembly via Bowtie (Version 0.12.9) to obtain the reads distribution among the entries. Since these reconstructions contain compre-hensive sequence information, they provided more details on petal development than those collected previously from microarrays [18,19].
WDR1(EU032621) in the flavonoid network. In all cases, the sequences amplified via RT-PCRs matched nearly per-fectly to the final assembly.
The precision of the transcriptomic reconstructions was assessed by transcript distributions of known
organ-identity genes. As floral organ organ-identity genes such as MADs box types are relatively well-known inArabidopsis [20], expressions of their homologs inIpomoeawere taken as the criteria for this evaluation. These homologs largely followed the predictions of the ABC model [21] and the
Day 0
Day -5
Day -4
Day -3
Day -2
Day -1
F
A
--
114 h- 90 h
- 60 h
E
D
C
1cm
Limb
Tube
B
- 114 h
1cm
- 60 h
Figure 1Sampling scheme for organ-specific transcriptomic reconstructions inIpomoea purpurea.Three developmental stages (114, 90, and 60 hrs before floral opening (−114, -90, -60)) of petals(A, C, D, E), one stage of sepal(B)and that of leaf(F)were collected in late September on a genet growing in the field. Flowers of the plant typically opened around 4 am daily, and the time was set as hour (h) 0 Day 0 for a given petal development series as shown. Leaves were sampled at 10 am along with petals(A and C)and sepals(B), whereas petal samples(D and E)were taken on the same day at 4 pm from the same floral buds.
Table 1 Results of Solexa/Illumina paired-end reads (75nt in length) assembled by Trinity Sample Number of
raw reads
Number of contig entries
N50 Reads
assembled
% Reads usage
Annotated (full+partial)*
(1e-5)
A 19874108 50284 1454 17483903 88% 15707+22815
B 20599558 55164 1288 17812061 87% 14954+27058
C 19710038 52538 1221 17177667 87% 12816+26672
D 20406514 46799 1214 17847745 88% 11134+24364
E 23228336 48568 1336 20655630 89% 14143+22263
F 38954816 63811 1426 32331937 83% 18431+27754
Total 90451 1209 23474+39539
Each sample was handled with the default parameters in Trinity from cleaned raw data. The sample "Total" was obtained by combining all contigs of the six samples above and assembling them further via TGICL. The number for reads integrated into assemblies was calculated from the number of reads that are alignable to contigs at levels of more than 93% (>=70/75).
derived ABCE model [22]. For instance, homolog expres-sion of the class E gene - SEPALLATA 3 (SEP3) - was essentially absent in leaf, but present in floral samples in various quantities (Figure 2). The best example was found with the homolog of the class-B gene- AP3, which was absent in both sepal and leaf, but present in all petal samples, as previously seen with Aquilegia AP3-3 [23]. Similarly, homologs of class-C genes,
in-cluding AGAMOUS (AG) and FLORAL BINDING
PROTEIN6 (FBP6), were found expressed in all tube-containing samples (A, C, and E), due to a partial fusion ofIpomoeafilaments to the floral tube. The restricted dis-tributions ofSEP3andAP3indicate a high precision asso-ciated with our transcriptomic reconstructions (Figure 2).
To quantitatively compare the assemblies, we adapted a normalized procedure of Robinson and Oshlack [24]. In comparison to previous data handlings such as reads per kilobase per million mapped (RPKM) and quantile normalization [25], the normalization considers not only the relationship between read number and gene length but also sample characters. It does so by taking the common set of genes across samples as the base for the normalization, effectively excluding transcripts se-lectively expressed in each organ and the associated bias (Additional file 1). To make sure that the normal-ized gene expressions still reflected sampled tissues, we took independent samples of petals at the same stage (sample D) on the same genet, and collected data on transcript estimates of ten genes on the anthocyanin
pathway through the conventional real-time quantitative PCRs. We observed a significant correlation (Pearson cor-relation coefficient = 0.77, P < 0.05,t-test, n = 10) between the two sets of data (Additional file 2), and conclude that the normalization procedure did not cause significant shifts of patterns among samples.
We started the data analysis by classifying each assem-bly into three groups - transcripts from nuclear, mito-chondrial, and chloroplast genomes to reveal features of subcellular genome usages. Since mitochondrial and chloroplast genomes are relatively small and have been known for many species, this treatment helps to make a better use of the resources available in general. By taking the known chloroplastic genome of the common morn-ing glory [26] and the mitochondrial genome from a closely related species Nicotiana tobacum [27] as refer-ences, we mapped each assembly to these genomes to obtain lists of chloroplastic and mitochondrial genes that were longer than 200-bp (the sequencing library length). The set of nuclear genes was obtained by excluding the organelle genomes from each assembly (Table 2). This classification permitted explicit comparisons of the six samples, leading to an effective analysis of organ-specific gene usage in each subcellular genome.
Gene usages of chloroplastic, mitochondrial, and nuclear genomes
The organs were compared in the sequence, scaffold number, and transcript abundance of the subcellular
AP3; PI
AG; FBP6
AP1
SEP3(AGL9) ABCDEF_17071 700 181 847 817 757 0 75%
APETALA1 (AP1) ABCDEF_8306 120 1240 65 31 588 0 67%
AP3 ABCDEF_31457 2213 0 2091 1770 2045 0 60%
PISTILLATA (PI) ABCDEF_18921 8481 9 8654 10104 10435 5 70%
AGAMOUS (AG) ABCDEF_18689 25 48 10 2 151 4 67%
FBP6 ABCDEF_43401 2 0 11 0 313 0 81%
A
B
C
D
E
F
z
SEP3
Samples
Figure 2Homolog expressions of MADs box genes across six samples.The upper left corner shows the ABCE model. The first column lists MADs gene products inArabidopsis thalianaand petunia FBP6, followed by the corresponding scaffold numbers in the final assembly. The original read level for each scaffold is shown for each of the samples (A→F). The last column displays amino acid identity between a homolog ofIpomoeaand that of
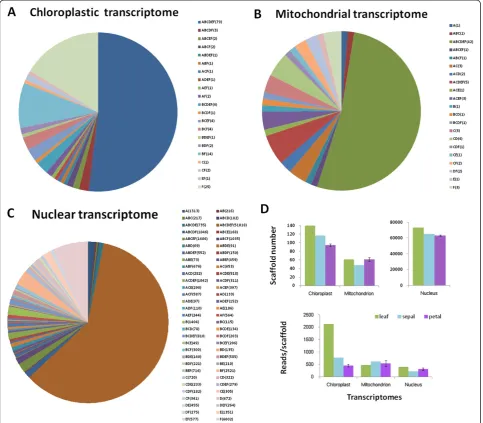
genomes. A scaffold was referred to as a transcript here after being examined to contain such a sequence. We first examined the common features shared by the or-gans. For the 113 annotated units of the knownIpomoea chloroplast genome, 94 were detected bearing transcript expressions in our samples, and 52% of the expressions were shared among petal, sepal, and leaf (Figure 3A; Additional file 3). Some scaffolds still maintained prokary-otic characters. A chloroplast scaffold (ABCDEF_16731), for instance, has multiple units including ribosomal RNAs and two tRNAs for isoleucine and alanine, a configuration previously observed in cyanobacteria [28]. This scaffold reached the highest expression level (51617 raw reads) in the leaf sample. Similarly, for the 169 annotated units of the Nicotiana mitochondrial genome, 42 homologs were detected having expressions in our samples (Additional file 4), of which 53% were commonly found among the or-gans (Figure 3B). While the total homolog number might vary with inter-specific mitochondrial mapping, the per-centage of shared transcripts could still effectively expose the genome usage pattern among organs since all organs shared the same mitochondrial genome, being on the same genet. A highly expressed scaffold (ABCDEF_41509) of mitochondrial genome also exhibited a cistron-like structure, including ribosomal RNAs and tRNA of phenyl-alanine. Little can be found in the literatures about this gene arrangement. Meanwhile, the highest similarity of gene expressions among organs (60%) was found within the nuclear genome (Figure 3C), suggesting the import-ance of nuclear genome in basic cellular functions. These commonly expressed genes were further inspected in tran-script abundance. For both chloroplasts and mitochon-dria, the highest correlation in transcript abundance level was found between colored limb and green leaf (Pearson correlation coefficient r = 0.95, P < 0.001,t-test, n = 70 for chloroplasts; r = 0.99, P < 0.001,t-test, n = 35 for mito-chondria). Many of these transcripts participate in basic biological processes such as protein synthesis. For nucleus, however, the highest correlation in transcript abundance
was observed between sepal and leaf (r =0.86, P < 0.001, z-test, n = 51018), suggesting their similarity in nuclear expression.
We found that organ-specific gene expressions made up less than 50% of the total transcripts for each of the subcellular genomes. Relatively speaking, leaf expressed 59% more chloroplastic genes and 16% more nuclear genes than the average of petals, presumably to support cellular activities of the whole plant; petal at a later de-velopmental stage consumed a high volume of mito-chondrial transcripts to assist its function; sepal engaged the least mitochondrial genes, but shared features with both petals and leaves in other expression categories (Table 2). Significantly, the nuclear transcriptome gener-ated 518 petal-specific scaffolds, implying a major role of nuclear genes in petal diversification (Figure 3C). The chloroplast genome showed the most striking diversifica-tion in both transcribed gene number and expression level (Figure 3D).
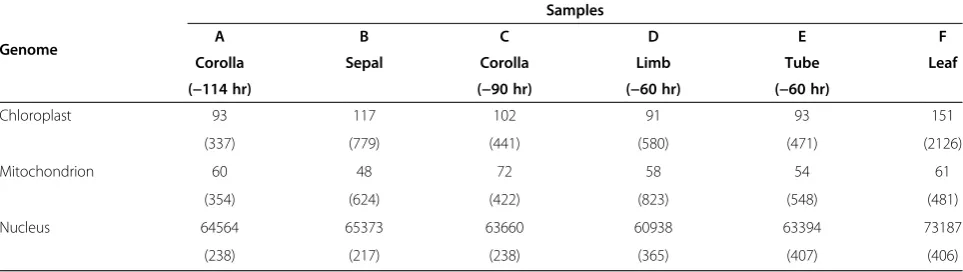
When regarding petal and sepal as representative parts of flower, we observed a significantly different nuclear gene usage between leaf and flower (Wilcoxon rank test, P = 0.03). The same significant differences were also seen for chloroplastic gene usage and the average tran-script abundance between leaf and flower. Furthermore, a sequential reduction of transcribed gene number was found in the order of leaf →sepal→ petal for both nu-clear and chloroplastic genomes. This pattern is note-worthy since it appears to connect to one inArabidopsis, where pollen exhibited a reduction of about 1/3 of com-monly transcribed genes relative to vegetative organs [29]. Also during senescence, the transcriptomic profile of Arabidopsis silique is more similar to that of its petal than that of the leaf [30]. Whether or not this trend of a reduced genomic usage toward the center of a flower is ubiquitous requires additional data. The kind of informa-tion has significant bearings. One is on deciphering evolu-tionary histories of the organs. Floral developmental program has been considered to share a deep homology in Table 2 Comparisons of subcellular classifications in scaffold number and expression level (normalized in parentheses) among leaf, sepal, and corolla (=limb + tube) transcriptomes ofIpomoea purpurea
Genome
Samples
A B C D E F
Corolla Sepal Corolla Limb Tube Leaf
(−114 hr) (−90 hr) (−60 hr) (−60 hr)
Chloroplast 93 117 102 91 93 151
(337) (779) (441) (580) (471) (2126)
Mitochondrion 60 48 72 58 54 61
(354) (624) (422) (823) (548) (481)
Nucleus 64564 65373 63660 60938 63394 73187
angiosperms [31], however, the emergence of petals in land plants is still an enigma [32] despite of examinations from multiple angles [33,34]. The similarities found here between petal and leaf in chloroplast gene usage and ex-pression patterns of common transcripts suggests a deep connection between petal and leaf.
Our data further shows that petals are partially auto-trophic and costly to maintain. During petal development, two photosystem I genes (ABCDEF_39040 encodingpsaI and ABCDEF_49598 encodingpsaA) expressed only tem-porarily after the petal's exposure to light, coinciding with the temporary greening of petals prior to bloom-ing (Figure 1). Durbloom-ing the petal pigmentation period as seen in samples A, C, and D, ribosomal genes (e.g.,
ABCDEF_17426, ABCDEF_41509) of the mitochondrial genome enhanced their expressions, and ATP synthase transcripts (ABCDEF_38143) increased nearly three folds. These patterns indicate that gene usages are dy-namic in subcellular genomes, which may vary by gen-ome type, organ type, the developmental stage of an organ, and the environment.
Cellular dynamics depicted by transcript abundance levels
entries of the final assembly to KEGG (Additional file 5). We made two assumptions while making our inferences. One is a positive correlation between transcript abun-dance and protein expression level; the other is one be-tween protein abundance and enzyme activity. The first correlation has gained support from tissue or cell-specific studies [7,8,35]. The second one can be derived from Michaelis-Menten kinetics, which suggests that richness of an enzyme (E) is positively correlated with the enzyme's activity until the substrate (S) is exhausted in forming ES. Both types of correlation may hold broadly.
Gene expression patterns of petal cell division
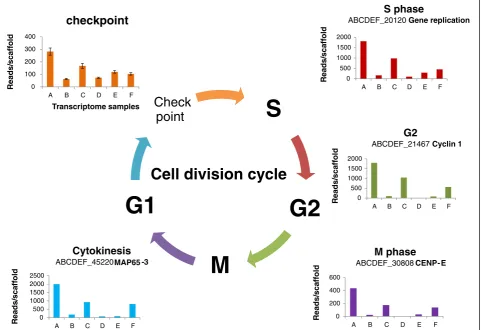
We depicted patterns of cell division using the homolog expressions of genes known to participate in cell cycle (Figure 4A). Specifically, high expression of cyclin-A2 is known to signal cell transition from G2 to M phase [36] and the transcripts get rapidly destroyed after cells enter the M phase [37]. Its homolog (ABCDEF_21549) here displayed a declining pattern along the developing petal series, suggesting reduced cells at metaphase with petal’s enlargement; consistently, B-type cyclin transcripts
(ABCDEF_21467) also decreased, complementing the same G2-M phase transition [38]. The same pattern held for a homolog (ABCDEF_45220) of a gene encoding microtubule-associated protein (MAP65-3) with a known role in cell plate formation [39]. Along with the cell div-ision features, we further examined the relative ratios of the transcripts participating in M and those in cytokinesis, and found that these ratios decreased from sample A to sample C and again from sample C to sample D, implying leaf-kind endoreplication in young petals. In addition, comparisons between samples D (limb) and E [18] of these cell cycle transcripts indicate enhanced transcription activities in tube (Figure 4), suggesting a basiplastic pat-tern of cell cycling, as seen in leaf [40]. These data imply that the petals are similar to developing leaves in cell for-mation, and young petals of sample C are closer to young leaves of sample F than to other samples taken here. Such a deep homology can be hardly diagnosed by previous comparisons [41], but complements with the lack of evi-dence for stamen origin of petal [23]. In contrast, sepal has the least number of dividing cells, agreeing with its mature size at the time of sampling. The cell division
S
G2
M
G1
Check
point
Cell division cycle
0100 200 300 400
A B C D E F
R eads/ sc a ff o ld Transcriptome samples
checkpoint
0 500 1000 1500 2000A B C D E F
R eads/ sc a ff o ld S phase
ABCDEF_20120Gene replication
0 500 1000 1500 2000 2500
A B C D E F
Re a d s /s c af fo ld Cytokinesis
ABCDEF_45220 MAP65 -3
0 500 1000 1500 2000
A B C D E F
Re a d s /s c af fo ld G2
ABCDEF_21467 Cyclin 1
0 200 400 600
A B C D E F
R eads/ sc a ff o ld M phase
ABCDEF_30808CENP- E
patterns, in additional to the common features of subcel-lular genome usages shared between leaf and petal, strongly favor a leaf origin of petal. This hypothesis is pro-posed here as it deserves close examinations in future.
Active RNA synthesis and translation in petals
Since petals appear to have distinctive patterns in genomic usages, we wanted to know whether their basic transcrip-tion and translatranscrip-tion processes would differ from those in other organs. Homolog expressions of the components known to be part of the basal apparatus for transcription were examined to compare RNA synthesis in samples. They included topoisomerase I (ABCDEF_4627), TATA-box-binding proteins, and various components involved in the synthesis of RNAs (Figure 5A). Petals showed slightly more expressed homologs for transcription initiation fac-tors (TFIIB and TFIIF) toward a later development. The translation process followed a pattern similar to those of TFIIB and TFIIF genes, with petal samples (with the ex-ception of the sample D) showing higher transcripts for all the ribosome subunits and the translation initiation factor than leaf and sepal samples (Figure 5B). This phenomenon could be associated with the high-volume synthesis of petal-specific metabolites [42], although the likelihood cannot be ruled out that different quantities of the compo-nents for the basal apparatus might be needed for organ-specific transcription and translation.
Epigenetic events differ between organs
The current understanding of epigenetic processes per-mits preliminary comparisons of some components across organs. These components diverged at both DNA and protein levels, suggesting that epigenetic processes are likely to be among the key events for organ differentiation (Additional file 6). In petal, we observed a highly expressed homolog (ABCDEF_38770) ofARGONAUTE 1 (AGO1), along with a Dicer homolog (ABCDEF_40338). AGO1 participates in single-stranded RNA cleavage via microRNA [43], while Dicer is known to cut double-stranded RNAs to influence DNA methylation status [44]. Their expression patterns suggest different dynamics of small RNA processes between organs. In a similar pattern, genes for histone deacetylases (e.g., ABCDEF_42471) were more actively transcribed in petals while protein phospho-tase 2C gene (ABCDEF_3211) was expressed more in leaves and sepals. For the colored limb (Figure 1), tran-scripts (ABCDEF_4131) highly resembling a maize AC transposase gene [45] were about 4–8 folds higher than those in leaves and sepals. It appears that different epigen-etic strategies have been taken between organs.
Connecting metabolic pathways to infer substance flow As metabolic processes are the basis for the substance flow among organs, they are compared among organs
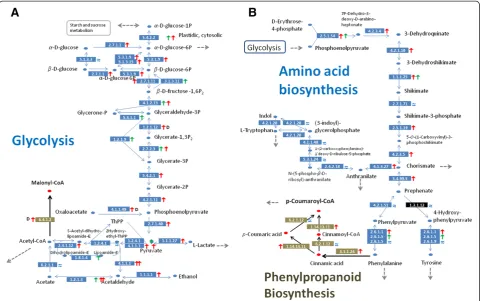
and organ developmental stages to extract information. We organized the annotated final transcriptome by the classification of KEGG (Additional file 5) and compared the file against known network topologies to establish data-supported networks. As indicated above, over 50% of transcriptomic components are shared among organs, and many of the known metabolic networks can be compared at a transcript level across samples. To make inferences on substance flow, we mapped the in vivo transcript accumulation patterns across the six samples along metabolic networks using sign and color. Exam-ples are given here focusing on glycolysis, amino acid pathways, and synthetic pathways to flavonoids and terpe-noids, since our experimental design particularly targets petal pigmentation process (Figure 1). Anthocyanins are known to be the major pigments in the petal ofIpomoea [46]. Our initial concern was to know how the anthocya-nin pathway had been related to other metabolic processes in vivo.
Reconstruction of metabolic networks via organ transcriptomes
We reconstructed glycolysis (KEGG #00010) for all sam-ples, and compared the transcript abundance levels at each catalytic step among the samples along the recon-struction. The transcript distributions indicate an active substance flow from D-glucose to acetyl-CoA in petals (Figure 6A). Along the portions of the network indicated by red arrows, the transcript level of every enzyme showed an increasing pattern along the petal develop-ment when compared to its counterpart in leaf. Follow-ing the synthesis of glyceraldehyde 3-phosphate, the network took a slightly different path in leaves, where different forms of enzymes were involved. To know the details on these enzymes, we examined all entries under a GO process (0006006) for glucose metabolism, and found that petals engaged more cytoplasmic glyceraldehyde-3-phosphate dehydrogenase (G3PDH, EC 1.2.1.12, ABC-DEF_27515) while leaves and sepals were dependent more on chloroplastic G3PDH (EC 1.2.1.9, ABCDEF_28550). In addition to glucose, the network in color limb cells also actively catalyzed oxaloacetate (a product largely from cit-ric acid cycle) into phosphoenolpyruvate to supplement the substance flow.
via this linking enzyme between glycolysis and flavonoid synthesis (Figure 6A). This also answered to some extent why much energy was consumed in petals.
further explored the in vivo source of 4-coumaroyl-CoA in petal. The mapping of amino acid biosynthesis (Figure 6B) suggested that it came directly from phenyl-alanine metabolism (KEGG #00360) via highly expressed transcripts for phenylalanine ammonia-lyase (4.3.1.24). The enzyme had two types of isoforms in samples. Both increased along with petal development. In compari-sons to their counterparts in leaf and sepal, the shorter one increased about ten folds in tube, and the longer ones boosted their levels by 2–4 folds in colored limbs. Since the floral tube of Ipomoea fuses with the anther filaments, it is difficult to make a judgment on the sig-nificance of these alternative transcripts. For our pur-pose of inferring substance flow, these expression patterns suggested a continuous substance flow from the branch of phenylalanine synthesis to the in vivo production of 4-coumaroyl-CoA during development of limb pigmentation, and the substance flow could be stronger in the floral tube.
The flavonoid metabolic network (KEGG #00941) was subsequently mapped and modified from data (Figure 7A). The reconstruction suggests that all en-zymes on the network were up-regulated relative to their counterparts in leaf and sepal, which is consistent with the microarray results of petunia petals [42]. To re-veal organ-specific expression patterns on the anthocyanin pathway, we performed a clustering analysis by Cluto (ver-sion 2.1.1) on the transcript abundance levels among the six samples. The data indicates that the lack of anthocya-nin synthesis inIpomoea leaf and sepal is due to lack of the expression of regulatory gene MYB1 at organ level, which led to reduced expressions of key enzyme genes on the pathway includingCHS-D,DFR-B,ANS, and3GGTin these organs (Figure 7B). Naturally, these expressed genes constitute part of petal-specific transcripts that define the function of petal. In contrast, two collaborating regulators, bHLH2 [48] and WDR1 [49], were found present more or less in all three organs compared here.
Inferring substance flow between organs
The identification of the connections between glycolysis and the anthocyanin pathway was significant as it allowed deciphering of extended substance flow involving the
supply of glucose in petal. By reconstructing the network involving starch and sucrose (KEGG #00500), we noticed that relative to leaf, petal had a 4-fold higher transcript level for alpha-glucosidase (EC3.2.1.20, ABCDEF_11272) Figure 7Patterns of gene expressions on the flavonoid network. (A)Sample comparisons on the flavonoid network. All enzymes are expressed as EC numbers in blue rectangles. Green and red arrows refer to enhanced transcript abundances (>2 fold) in leaf and flower, respectively, with each other as reference. The letter in bold following an arrow indicates the sample with the highest expression level. The pigment products are also shown in bold. (B)A close-up of expression patterns of known genes on the anthocyanin pathway with normalized expression levels shown in the parentheses. The horizontal cladogram indicates gene expression similarities across samples and the vertical cladogram suggests similarities of samples across genes, as generated by Cluto (version 2.0) using the matrix of Pearson correlation coefficient in a scale of 0.5 to 1.0. Alleles enlisted includeCHS-D_mex9
(AF358655),CHI_fl1(AF028238),F3H_1(U74081),F3'H_blue(EU032626),DFR-B_fl1(U90432),ANS_c(EU032612),3GT_b(EU032615),3GGT_a(KC794956),
in samples D&E and 18-fold higher transcripts for beta-glucosidase (EC3.2.1.21, ABCDEF_52515) in sample E alone. These enzymes could take different forms of gluco-side to generate glucose to meet the high demand in petals. The final anthocyanin molecule inIpomoeacan be added with five glucoses to maintain its stability in vacuole [46,50]. Moreover, sucrose from leaf could replenish glu-cose in petal when the demand of gluglu-cose in petal out-paced the local supply. The evidence for this scenario came from the increasing patterns (2- to 4-fold) of homo-log transcripts (ABCDEF_25171, ABCDEF_41696) of two sucrose transporter genes (SUC1and SUC2) in the petal developmental series. The homolog expression of beta-fructofuranosidase (EC3.2.1.26, ABCDEF_35900) was most informative, as it increased over three magnitudes in sam-ples D&E versus the leaf sample. This enzyme holds a 64% identity to the vacuolar form of acid invertase in bean (Vicia faba), which is known to convert sucrose into glu-cose and fructofuranose. It is possible that leaf-produced sucrose can be transported via the vascular systems in floral tube to satisfy the need of glucose during petal pig-mentation process. Although the concrete molecular path connecting different tissues still requires characterizations, externally supplied sucrose have been known to enhance anthocyanin accumulation inEustoma[51] and Arabidop-sis[52,53]. Thein vivosubstance flow detected in the petal series indicates how floral color can be altered by fluctu-ation of upstream metabolites.
Reconstructing signaling networks
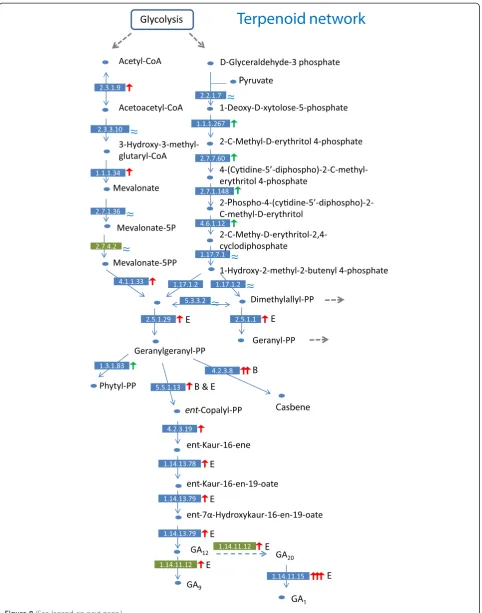
Because plant hormones may play significant roles in floral development, we inspected how gibberellins (GAs) were manufactured in different organs. Based on the known metabolic pathway of terpenoid backbone syn-thesis (KEGG#00900), we mapped the patterns of tran-script levels at each step to reconstruct the network among organs. The precursors (acetyl-CoA and D-glyceraldehyde-3-phosphate) of terpenoid backbone syn-thesis could be traced back to glycolysis (Figure 8). We followed the branch from geranylgeranyl-diphosphate (geranylgeranyl-PP) to different GAs. Floral tube was found to be the hot spot for the synthesis of cytosol gib-berellin (GA9& GA20), since the gibberellin 3β
-hydroxy-lase (ABCDEF_75035) transcripts of sample E were over 100-fold higher than other samples (Figure 8), suggest-ing that geranylgeranyl-PP was likely enriched in the floral tube. This GA-production hotspot is confined to filament rather than petal tissue per sesince the enzyme leading to GA1 production is virtually absent in both
limb and sepal, but highly expressed in tube with devel-oping filaments. This expression pattern is also consist-ent with GA effect on Arabidopsisfilament growth [54] and on development of androecium in general [55]. GA9
and GA20 may be further metabolized into GA3 and
GA1in cytosol, respectively, to influence relevant
devel-opmental processes [56].
GA synthesis in sepals, however, appeared to follow a different path of substance flow---the transcript level of 5-epi-aristolochene synthase (EC 4.2.3.8, ABCDEF_11886, 59% identity to NaEAS37) increased a 24-fold relative to petals and about three folds relative to leaves (Figure 8). This may cause a high accumulation of a capsidiol-like phytoalexin in sepal. As casbene can reduce fungal infec-tion [57], a likely high accumulainfec-tion in sepal may provide a general mechanism for the protective role of sepal dur-ing developments of floral buds and young fruits. The phenomenon certainly deserves more close examinations.
Conclusion
Since transcriptomic reconstruction may provide rich in-formation on cellular activities and substance flow in or-gans (or cells in cases of microscopic samples), it should be an integral part of biological investigations in future. We provide here the logic and ways of extracting tran-scriptome information. Cellular activities may be largely reconstructed from patterns of genomic usages and tran-script abundance among samples under an object-oriented experimental design. Inferences may be drawn from known topology of networks and their validated components. Our analysis shows that while leaf and sepal are both photosynthetic, leaf is an essential organ for energy capturing and primary metabolism, as more genes were transcribed in higher quantities than those in sepal. Though photosynthetic and possibly autotropic to some degree, sepal has been specialized in other func-tions such as protection by accumulating organ-specific secondary compounds such as phytoalexins. Petal pig-mentation process can be visualized step-by-step from glycolysis to anthocyanin pathway by linking relevant KEGG metabolic topologies via known biochemical reac-tions. The continuity in substance flow is therefore clearly visible between the primary and secondary meta-bolic networks. A less continuous image, however, also emerged in our analysis, showing that sucrose could be transported from leaf to petal to replenish glucose dur-ing petal pigmentation process. While the missdur-ing links between molecular systems still depend on future la-boratory discoveries, the integration of NGS technique, bioinformatic analysis, and an appropriate experimental design may certainly help to orient the search directions to more likely domains.
Methods
Sampling scheme and data collection
sepals, and petals (Figure 1) were frozen immediately in liquid nitrogen and the whole RNAs were subsequently extracted using Trizol reagent (Life Technologies). The quality of the extracted RNAs was examined with Agilent 2100 Bioanalyzer (Agilent Technologies) and the samples were processed following the sample prepar-ation guide for mRNA sequencing (Illumina 2009). The preparation involved purification of mRNAs by poly-T oligos attached to magnetic beads, and cDNA synthesis in two strands. The cDNAs were added with A bases at 3' ends and ligated with adapters for further PCR ampli-fications. The amplified cDNAs were sheared into 200 bp in length to make the sequencing library. The proc-essed samples each in 10 ng were run in parallel at the platform Hiseq2000 of Beijing Genomics Institute (BGI). Paired-end reads of 75-nt were collected up to 1.2 giga bases (Gb) for each sample. Low quality reads were ex-cluded from the raw data, and clean data sets (>1 Gb) were subject to the assembly pipeline described below.
Transcriptome reconstruction and annotation
The cleaned data of each sample was assembled using Trinity of the latest version (trinityrnaseq_r2012-06-08.tgz). The command line followed: Trinity.pl --seqType fa --JM 40G --left A.Left --right A.Right --CPU 8. Details on the parameters may be found in the associated manual (http://trinityrnaseq.sourceforge.net/#sample_data). The resulting assemblies were subsequently labeled as A, B, C, D, E, and F (Table 1), corresponding to the samples of Figure 1. The six samples were further combined to produce a final assembly using TGICL (TGICL-2.0.tar.gz) under the parameters: -p 95 -l 50 -v 6 -O '-h 3 -k 0 -o 50 -p 95'.
We annotated the final scaffolds of the combined data to a reference database containing a total of 2961141 uniref50 sequences (ftp.ebi.ac.uk/pub/databases/uniprot/, January 2012) by blastx under the parameters of -e 1e-5– b 10. The resulted annotations were then re-organized by our local Perl scripts (Additional file 7) to extract informa-tion according to their GO (http://www.geneontology.org) and KEGG classifications (http://www.genome.jp/kegg/). The assembly of each sample was mapped back to the final assembly via Bowtie [58] to obtain the reads distribu-tion among the entries. When the read number for an entry was less than two, we considered the result fortuit-ous, and took the expression as zero.
Normalization of multiple samples
Following the original notations of the TMM (trimmed mean of log (base 2) expression ratio (M value)) method [24], we applied the formula below to compute the normalization factor R:
R¼TMMrk ð1Þ
log TMM rk¼ X
g∈G
wrgkMrgk 0
@
1 A=X
g∈G
wrgk
Mrgk¼ log Ygk
Nk
=log Ygr
Nr
wrgk¼Nk−Ygk NkYgk þ
Nr−Ygr
NrYgr ≈
1 Ygkþ
1 Ygr
Here, G* is a trimmed set (defined below) of genes with log-transformed abundance levels, and g is any gene in the set. The abundance levels of gene g in sam-ples r and k, is represented by Ygkand Ygr respectively.
The total abundance levels of all genes in samples r and k are Nk and Nr, respectively. The abundance level for
each scaffold g in sample k (Ygk) was estimated by
divid-ing the number of paired-end reads for the scaffold by the length of the scaffold and the total paired-end read number for the sample (Additional file 1). For compari-son of n-samples, G* was obtained in the following steps. Genes expressed in all n samples were chosen to constitute G, and Ygwas computed as:
Yg¼
Xn
k¼1
Ygk
!
=n;where g∈G;Ygk≠0
N¼ ∑
g∈GYg
Yg(g∈G) was regarded as the reference sample. For each
scaffold (g) in the reference sample, we calculated its Mg
and Agfor the corresponding gene in sample k:
Mg¼log
Ygk=Nk
Yg=N
Ag¼
1
2log Ygk=Nk
Yg=N
We listed the maximum Mg (M max), the minimum
Mg (M min), the maximum Ag (A max), and the
(See figure on previous page.)
minimum Ag (A min). If , Mlower<MMmaxg−−MMminmin<Mupper,
and Alower<AAmaxg−−AAminmin<Aupper; then g was kept. These
chosen genes formed G* (in our calculations: Mlower= 0.3,
Mupper= 1−0.3; Alower= 0.2, Aupper= 1−0.2). From G* and
the abundance levels of gene g in each sample (including the reference sample), we obtained the normalization fac-tor R of each sample relative to the reference sample using the equation (1) above.
Chloroplast & mitochondrial mapping
The mapping of scaffolds of each sample to the chloroplast genome was performed by querying the known genome of the common morning glory using blastn under 1e-5 and parameters of identity ≥95%, and length ≥ 80%. For the mitochondrial genome, a similar query was made under 1e-5 and identity≥80%, and length ≥50% against Nicotiana mitochondrial genome. The mapping results were then examined to exclude misplacements based on the blast results. We developed a series of scripts to partition and organize data files to classify subcellular genomic expres-sions, and to sort out the transcript distribution among samples (Additional file 8), which allowed later charting of data via Excel.
Verifications by sequencing and real-time qPCR
Petal cDNAs were obtained as previously mentioned. Primers were designed for the coding regions of target genes (Additional file 9; Additional file 3 of [59]) based on the final NGS data assembly, and applied to RT-PCR reactions using a standard protocol (Life Technologies). The amplified fragments were cloned and taken as the templates in sequencing reactions with big dye (Life Technologies). Samples for real-time qPCRs were simi-larly prepared and followed a previous protocol [59]. The results were expressed as numbers of transcript copies per pg cDNA (Additional file 9).
Mapping sample patterns on molecular networks
All scaffolds were screened for connections to the known pathways in the KEGG database (Additional file 6). For each KEGG pathway, expressions of its components were first labeled to indicate the presences in the final assembly. When a specific pathway was in focus, the known top-ology was scrutinized at each component for its expres-sion pattern among samples. Besides annotation from uniprot, the identity of a scaffold involved in the pathway was further verified via blast searches to NCBI data-bases (http://www.ncbi.nih.gov/) and its function cited by the enzyme nomenclature (http://www.chem.qmul.ac.uk/) and literatures. The close examinations allowed estab-lishments of species-specific pathways with all of the compo-nents supported by the transcriptomic data. Organ-specific expressions were based on normalized scaffold levels
and presented by labeling each component with a sign(s) representative of different expression patterns among or-gans. When a scaffold abundance level varied more than 2-fold between samples, we tentatively marked it as chan-ging significantly. Assuming that a transcript level was re-flective of the protein level to a significant degree, we were able to detect the direction of metabolic flux using criteria of the catalytic features of the enzymes and the expression patterns between the target transcriptomes (A, C, D, E) and reference ones (B, F) marked on the pathways.
Statistical analysis
Pearson correlation coefficients were computed for gene expression data, and a standard t-test was applied to the correlation coefficients. A non-parametric Wilcoxon rank test was conducted for comparing the mean of a sample in a small size to a specific value. Pearson correlation coef-ficients were also calculated between expression levels of scaffolds across samples, or between samples across scaf-folds, which allowed clustering analysis via the agglomera-tive method implemented in Cluto (http://glaros.dtc.umn. edu/gkhome/fetch/sw/cluto/cluto-2.1.1.tar.gz) using maxtf scaling as our row model.
Availability of supporting data
All cleaned short reads have been submitted to GenBank (http://www.ncbi.nih.gov/) under the SRA accession num-ber SRP015900. The final assembly of the sequences has also been submitted under the TSA accession number GALY01000000. Other supporting data are available in the additional files online.
Additional files
Additional file 1:Perl scripts for normalization.
Additional file 2:qPCR primers and expression estimation sets.
Additional file 3:Chloroplast scaffolds and annotations.
Additional file 4:Mitochondrial scaffolds and annotations.
Additional file 5:KEGG mapping and expression results.
Additional file 6:Epigenetic events during petal pigmentation.
Additional file 7:Perl scripts for extracting and organizing KEGG information.
Additional file 8:Perl scripts for organelle genome mapping.
Additional file 9:Additional primers for sequence verifications.
Competing interests
The authors declare that they have no competing interests.
Authors’contributions
Acknowledgements
We thank the reviewers for their thoughtful comments, H.-L. Zhou and L.-L. Xie for their assistances at various phases of this project and the group members of the ecological and evolutionary genomics (EEG) at the Institute of Botany, Chinese Academy of Sciences, for maintaining field plants and providing comments on this study. This work was supported by the Chinese Academy of Sciences (KSCX2-YW-N-043), the National Science Foundation of China (31070263, 30121003), and the Ministry of Science and Technology.
Received: 2 September 2013 Accepted: 21 October 2013 Published: 25 October 2013
References
1. Aceituno FF, Moseyko N, Rhee SY, Gutierrez RA:The rules of gene expression in plants: organ identity and gene body methylation are key factors for regulation of gene expression inArabidopsis thaliana. BMC Genomics2008,9:438.
2. Wray GA, Hahn MW, Abouheif E, Balhoff JP, Pizer M, Rockman MV, Romano LA:The evolution of transcriptional regulation in eukaryotes.Mol Biol Evol
2003,20:1377–1419.
3. Carroll SB:Evo-devo and an expanding evolutionary synthesis: a genetic theory of morphological evolution.Cell2008,134:25–36.
4. Emerson JJ, Li WH:The genetic basis of evolutionary change in gene expression levels.Philos Trans R Soc B-Biol Sci2010,365:2581–2590. 5. Vinuela A, Snoek LB, Riksen JAG, Kammenga JE:Genome-wide gene
expression regulation as a function of genotype and age inC. elegans. Genome Research2010,20:929–937.
6. Levine MT, Eckert ML, Begun DJ:Whole-genome expression plasticity across tropical and temperateDrosophila melanogasterpopulations from eastern Australia.Mol Biol Evol2011,28:249–256.
7. Petricka JJ, Schauer MA, Megraw M, Breakfield NW, Thompson JW, Georgiev S, Soderblom EJ, Ohler U, Moseley MA, Grossniklaus U,et al:The protein expression landscape of theArabidopsisroot.Proc Natl Acad Sci U S A
2012,109:6811–6818.
8. Miranda HC, Herai RH, Thome CH, Gomes GG, Panepucci RA, Orellana MD, Covas DT, Muotri AR, Greene LJ, Faca VM:A quantitative proteomic and transcriptomic comparison of human mesenchymal stem cells from bone marrow and umbilical cord vein.Proteomics2012,12:2607–2617. 9. Metzker ML:Sequencing technologies - the next generation.Nat Rev
Genet2010,11:31–46.
10. Garber M, Grabherr MG, Guttman M, Trapnell C:Computational methods for transcriptome annotation and quantification using RNA-seq.
Nat Methods2011,8:469–477.
11. Gibbons JG, Janson EM, Hittinger CT, Johnston M, Abbot P, Rokas A: Benchmarking next-generation transcriptome sequencing for functional and evolutionary genomics.Mol Biol Evol2009,26:2731–2744.
12. Zerbino DR, Birney E, Velvet:Algorithms for de novo short read assembly using de Bruijn graphs.Genome Res2008,18:821–829.
13. Robertson G, Schein J, Chiu R, Corbett R, Field M, Jackman SD, Mungall K, Lee S, Okada HM, Qian JQ,et al:De novo assembly and analysis of RNA-seq data.Nat Methods2010,7:909–U962.
14. Grabherr MG, Haas BJ, Yassour M, Levin JZ, Thompson DA, Amit I, Adiconis X, Fan L, Raychowdhury R, Zeng QD,et al:Full-length transcriptome assembly from RNA-Seq data without a reference genome.
Nature Biotech2011,29:644–652.
15. Irish VF:TheArabidopsispetal: a model for plant organogenesis.Trends Plant Sci2008,13:430–436.
16. Townsley BT, Sinha NR:A new development: evolving concepts in leaf ontogeny.Annu Rev Plant Biol2012,63:535–562.
17. Pertea G, Huang XQ, Liang F, Antonescu V, Sultana R, Karamycheva S, Lee Y, White J, Cheung F, Parvizi B,et al:TIGR Gene Indices clustering tools (TGICL): a software system for fast clustering of large EST datasets.
Bioinformatics2003,19:651–652.
18. Bey M, Stuber K, Fellenberg K, Schwarz-Sommera Z, Sommer H, Saedler H, Zachgo S:Characterization ofAntirrhinumpetal development and identification of target genes of the class B MADS box geneDEFICIENS. Plant Cell2004,16:3197–3215.
19. Voelckel C, Borevitz JO, Kramer EM, Hodges SA:Within and between whorls: comparative transcriptional profiling ofAquilegiaand
Arabidopsis.PLoS One2010,5:e9735.
20. Smaczniak C, Immink RGH, Muino JM, Blanvillain R, Busscher M, Busscher-Lange J, Dinh QD, Liu SJ, Westphal AH, Boeren S,et al:Characterization of MADS-domain transcription factor complexes inArabidopsisflower development.Proc Natl Acad Sci U S A2012,109:1560–1565. 21. Coen ES, Meyerowitz EM:The war of the whorls - genetic interactions
controlling flower development.Nature1991,353:31–37.
22. Krizek BA, Fletcher JC:Molecular mechanisms of flower development: an armchair guide.Nat Rev Genet2005,6:688–698.
23. Sharma B, Guo CC, Kong HZ, Kramer EM:Petal-specific
subfunctionalization of an APETALA3 paralog in the Ranunculales and its implications for petal evolution.New Phytol2011,191:870–883.
24. Robinson MD, Oshlack A:A scaling normalization method for differential expression analysis of RNA-seq data.Genome Biol2010,11:R25. 25. Irizarry RA, Hobbs B, Collin F, Beazer-Barclay YD, Antonellis KJ, Scherf U,
Speed TP:Exploration, normalization, and summaries of high density oligonucleotide array probe level data.Biostatistics2003,4:249–264. 26. McNeal JR, Kuehl JV, Boore JL, de Pamphilis CW:Complete plastid genome
sequences suggest strong selection for retention of photosynthetic genes in the parasitic plant genusCuscuta.BMC Plant Biol2007,7:57. 27. Sugiyama Y, Watase Y, Nagase M, Makita N, Yagura S, Hirai A, Sugiura M:
The complete nucleotide sequence and multipartite organization of the tobacco mitochondrial genome: comparative analysis of mitochondrial genomes in higher plants.Mol Genet Genomics2005,272:603–615. 28. Boyer SL, Flechtner VR, Johansen JR:Is the 16S-23S rRNA internal
transcribed spacer region a good tool for use in molecular systematics and population genetics? A case study in cyanobacteria.Mol Biol Evol
2001,18:1057–1069.
29. Becker JD, Boavida LC, Carneiro J, Haury M, Feijo JA:Transcriptional profiling ofArabidopsistissues reveals the unique characteristics of the pollen transcriptome.Plant Physiol2003,133:713–725.
30. Wagstaff C, Yang TJW, Stead AD, Buchanan-Wollaston V, Roberts JA:A molecular and structural characterization of senescingArabidopsis
siliques and comparison of transcriptional profiles with senescing petals and leaves.Plant J2009,57:690–705.
31. Irish VF:Evolution of petal identity.J Exp Bot2009,60:2517–2527. 32. De Craene LPR, Brockington SF:Origin and evolution of petals in
angiosperms.Plant Ecol Evol2013,146:5–25.
33. De Craene LPR:Homology and evolution of petals in the core eudicots.
Syst Bot2008,33:301–325.
34. Zahn LM, Ma XA, Altman NS, Zhang Q, Wall PK, Tian DL, Gibas CJ, Gharaibeh R, Leebens-Mack JH, dePamphilis CW,et al:Comparative transcriptomics among floral organs of the basal eudicotEschscholzia californicaas reference for floral evolutionary developmental studies.
Genome Biol2010,11:R101.
35. Zgoda VG, Kopylov AT, Tikhonova OV, Moisa AA, Pyndyk NV, Farafonova TE, Novikova SE, Lisitsa AV, Ponomarenko EA, Poverennaya EV,et al: Chromosome 18 transcriptome profiling and targeted proteome mapping in depleted plasma, liver tissue and HepG2 cells.J Proteome Res
2013,12:123–134.
36. Boudolf V, Lammens T, Boruc J, Van Leene J, Van Den Daele H, Maes S, Van Isterdael G, Russinova E, Kondorosi E, Witters E,et al:CDKB1;1 forms a functional complex with CYCA2;3 to suppress endocycle onset.Plant Physiol2009,150:1482–1493.
37. Pines J, Hunter T:p34cdc2: the S and M kinase?The New biologist1990, 2:389–401.
38. Komaki S, Sugimoto K:Control of the plant cell cycle by developmental and environmental cues.Plant & cell physiol2012,53:953–964.
39. Ho CMK, Hotta T, Guo FL, Roberson R, Lee YRJ, Liu B:Interaction of antiparallel microtubules in the phragmoplast is mediated by the microtubule-associated protein MAP65-3 inArabidopsis.Plant Cell2011,23:2909–2923. 40. Donnelly PM, Bonetta D, Tsukaya H, Dengler RE, Dengler NG:Cell cycling
and cell enlargement in developing leaves ofArabidopsis.Dev Biol1999, 215:407–419.
41. Endress PK:Evolutionary diversification of the flowers in angiosperms.
Am J Bot2011,98:370–396.
42. Muhlemann JK, Maeda H, Chang CY, Miguel PS, Baxter I, Cooper B, Perera MA, Nikolau BJ, Vitek O, Morgan JA,et al:Developmental changes in the metabolic network of snapdragon flowers.PLoS One2012,7:e40381. 43. Baumberger N, Baulcombe DC:ArabidopsisARGONAUTE1 is an RNA Slicer
44. Khraiwesh B, Arif MA, Seumel GI, Ossowski S, Weigel D, Reski R, Frank W: Transcriptional control of gene expression by microRNAs.Cell2010, 140:111–122.
45. Kunze R, Stochaj U, Laufs J, Starlinger P:Transcription of transposable element activator (ac) ofZea-mays-L.Embo J1987,6:1555–1563. 46. Saito N, Tatsuzawa F, Yoda K, Yokoi M, Kasahara K, Iida S, Shigihara A,
Honda T:Acylated cyanidin glycosides in the violet-blue flowers of
Ipomoea purpurea.Phytochem1995,40:1283–1289.
47. Heller W, Hahlbrock K:Highly purified flavanone synthase from parsley catalyzes the formation of naringenin chalcone.Arch Biochem Biophys
1980,200:617–619.
48. Park K-I, Ishikawa N, Morita Y, Choi J-D, Hoshino A, Iida S:A bHLH regulatory gene in the common morning glory,Ipomoea purpurea, controls anthocyanin biosynthesis in flowers, proanthocyanidin and phytomelanin pigmentation in seeds, and seed trichome formation.
Plant J2007,49:641–654.
49. Morita Y, Saitoh M, Hoshino A, Nitasaka E, Iida S:Isolation of cDNAs for R2R3-MYB, bHLH and WDR transcriptional regulators and identification ofcandcamutations conferring white flowers in the Japanese morning glory.Plant Cell Physiol2006,47:457–470.
50. Lu YQ, Du J, Tang JY, Wang F, Zhang J, Huang JX, Liang WF, Wang LS: Environmental regulation of floral anthocyanin synthesis inIpomoea purpurea.Mol Ecol2009,18:3857–3871.
51. Kawabata S, Kusuhara Y, Li YH, Sakiyama R:The regulation of anthocyanin biosynthesis inEustoma grandiflorumunder low light conditions.
J Jpn Soc Hortic Sci1999,68:519–526.
52. Solfanelli C, Poggi A, Loreti E, Alpi A, Perata P:Sucrose-specific induction of the anthocyanin biosynthetic pathway inArabidopsis.Plant Physiol2006, 140:637–646.
53. Das PK, Geul B, Choi S-B, Yoo S-D, Park Y-I:Photosynthesis-dependent anthocyanin pigmentation inArabidopsis.Plant signaling & behavior2011, 6:23–25.
54. Cheng H, Song SS, Xiao LT, Soo HM, Cheng ZW, Xie DX, Peng JR: Gibberellin acts through jasmonate to control the expression of MYB21, MYB24, and MYB57 to promote stamen filament growth inArabidopsis.
PLoS Genet2009,5:e1000440.
55. Plackett ARG, Thomas SG, Wilson ZA, Hedden P:Gibberellin control of stamen development: a fertile field.Trends Plant Sci2011,16:568–578. 56. Hedden P, Thomas SG:Gibberellin biosynthesis and its regulation.
Biochem J2012,444:11–25.
57. Sitton D, West CA:Casbene - anti-fungal diterpene produced in cell-free-extracts of ricinus-communis seedlings.Phytochem1975,14:1921–1925. 58. Langmead B, Trapnell C, Pop M, Salzberg SL:Ultrafast and
memory-efficient alignment of short DNA sequences to the human genome.
Genome Biol2009,10:R25.
59. Lu YQ, Xie LL, Chen JN:A novel procedure for absolute real-time quantification of gene expression patterns.Plant Methods2012,8:9.
doi:10.1186/1746-4811-9-42
Cite this article as:Guan and Lu:Dissecting organ-specific transcriptomes through RNA-sequencing.Plant Methods20139:42.
Submit your next manuscript to BioMed Central and take full advantage of:
• Convenient online submission
• Thorough peer review
• No space constraints or color figure charges
• Immediate publication on acceptance
• Inclusion in PubMed, CAS, Scopus and Google Scholar
• Research which is freely available for redistribution