Open Access
Research article
Reduction in magnetic resonance imaging T2 burden of disease in
patients with relapsing-remitting multiple sclerosis: analysis of
48-week data from the EVIDENCE (EVidence of Interferon
Dose-response: European North American Comparative Efficacy)
study
A Traboulsee*
1, A AL-Sabbagh
2, R Bennett
2, P Chang
2, DKB Li
3for the
EVIDENCE Study Group and the UBC MS/MRI Research Group
Address: 1Division of Neurology, Medicine, University of British Columbia, Vancouver, BC, Canada, 2EMD Serono, Inc., Rockland, MA, USA and 3Radiology, University of British Columbia, Vancouver, BC, Canada
Email: A Traboulsee* - [email protected]; A AL-Sabbagh - [email protected]; R Bennett - [email protected]; P Chang - [email protected]; DKB Li - [email protected] * Corresponding author
Abstract
Background: The EVIDENCE (EVidence of Interferon Dose-response: European North American Comparative Efficacy) study was an international, randomized, open-label, assessor-blinded, parallel-group study assessing the efficacy and tolerability of interferon (IFN) beta-1a, 44 mcg subcutaneously (sc) three times weekly (tiw), and IFN beta-1a, 30 mcg intramuscularly (im) once weekly (qw), in patients with relapsing-remitting multiple sclerosis (RRMS). The aim of this analysis was to assess whether reductions in T2 burden of disease (BOD) were greater for patients receiving IFN beta-1a, 44 mcg sc tiw, than for those treated with IFN beta-1a, 30 mcg im qw, and to assess the impact of neutralizing antibodies (NAbs).
Methods: A post-hoc analysis was performed on magnetic resonance imaging (MRI) data collected prospectively from the EVIDENCE study. The analysis included all patients with evaluable T2 MRI scans at the start of dosing and at week 48, and those who received at least one drug dose (n = 553). Lesions were identified by a radiologist blinded to treatment codes and the total volume of T2 lesions (BOD) was reported in mm3.
Results: Both median percentage decreases and absolute reduction in BOD were greater in the IFN beta-1a, 44 mcg sc tiw, treatment group. The adjusted mean treatment difference in percentage change in BOD from baseline to week 48 showed a significant treatment benefit for patients treated with IFN beta-1a, 44 mcg sc tiw, over those treated with IFN beta-1a, 30 mcg im qw (-4.6%; standard error: 2.6%; p = 0.002). The presence of NAbs reduced the effect of IFN 1a 44, mcg sc tiw, on BOD, but BOD changes were still similar to those seen with IFN beta-1a, 30 mcg im qw.
Conclusion: Patients with RRMS treated with IFN beta-1a, 44 mcg sc tiw, had greater reduction in T2 BOD after 48 weeks than those treated with IFN beta-1a, 30 mcg im qw, which is consistent with other clinical and MRI outcome measures in the EVIDENCE study. In patients testing positive for NAbs (NAb+) to IFN beta-1a 44 mcg sc tiw, changes in BOD were smaller than in NAb negative (NAb-) patients, but similar to those receiving IFN beta-1a, 30 mcg im qw.
Published: 21 April 2008
BMC Neurology 2008, 8:11 doi:10.1186/1471-2377-8-11
Received: 10 August 2007 Accepted: 21 April 2008
This article is available from: http://www.biomedcentral.com/1471-2377/8/11 © 2008 Traboulsee et al; licensee BioMed Central Ltd.
Background
Interferon (IFN) beta-1a, 44 mcg subcutaneously (sc) three times weekly (tiw), and IFN beta-1a, 30 mcg intra-muscularly (im) once weekly (qw), are both licensed for the treatment of patients with relapsing forms of multiple sclerosis (MS). These two IFN beta-1a formulations were compared in the EVIDENCE (EVidence of Interferon Dose-response: European North American Comparative Efficacy) study, which was an international, randomized, open-label, assessor-blinded, parallel-group study to determine if IFN beta-1a, 44 mcg sc tiw, has greater effi-cacy on clinical and magnetic resonance imaging (MRI) outcomes to that of IFN beta-1a, 30 mcg im qw, in patients with relapsing-remitting MS (RRMS). Patients treated with IFN beta-1a, 44 mcg sc tiw, had a significantly higher odds ratio for remaining relapse free at 24 weeks (p = 0.0005), at 48 weeks (p = 0.009) and over an average of 64 weeks (p = 0.023), compared with patients treated with IFN beta-1a, 30 mcg im qw [1-3]. In addition, at the same time points, new activity on MRI was significantly lower in patients receiving IFN beta-1a, 44 mcg sc tiw, than in those receiving IFN beta-1a, 30 mcg im qw: reductions were seen in gadolinium (Gd)-enhancing lesions, T2 active lesions and the proportion of T2 active scans; increases were seen in the proportion of patients with no T2 active lesions [1].
Neutralizing antibodies (NAbs) can occur with any IFN therapy for MS and may impact on efficacy, although there is debate on the degree of this effect [4]. In the EVI-DENCE study, 25% of patients receiving IFN beta-1a, 44 mcg sc tiw, and 2% of patients receiving IFN beta-1a, 30 mcg im tiw, had NAb titres greater than 20 neutralizing units/mL at week 48. There was no apparent effect on clin-ical efficacy for relapse outcomes, but fewer T2 active lesions were seen in the IFN beta-1a, 44 mcg sc tiw, NAb-group compared with the NAb+ NAb-group (0.6 versus 1.6 lesions, p = 0.0004).
The aim of this post-hoc analysis of the EVIDENCE data was to establish whether reductions in T2 burden of dis-ease (BOD) were also greater for patients treated with IFN beta-1a, 44 mcg sc tiw, than for those treated with IFN beta-1a, 30 mcg im qw. Whether NAb status affected treat-ment outcomes was also assessed.
Methods
Design and objectives
A post-hoc analysis was performed on MRI data that were collected prospectively from the EVIDENCE study (proto-col 21125) [3]. This included all randomized patients who had received at least one dose of the study drug and had evaluable T2-weighted MRI scans from both before the start of dosing (week 0) and at week 48. The central MRI analysis laboratory (USC MS/MRI Research Group)
performed the original activity analysis and remained blinded for the current analysis throughout. An experi-enced MRI radiologist evaluated all MRI scans and remained blinded to treatment. For the T2 BOD analysis, digital data for the proton density/T2 scans for weeks 0 and 48 were used and the radiologist electronically tagged all T2 lesions for segmentation. Trained technicians blinded to study treatment grew each tagged T2 lesion semi-automatically using proprietary software. The radiol-ogist performed a final quality-control step before
sum-marizing the results as a total volume (mm3). Combined
unique lesion activity (CUA) analysis was performed pre-viously up to week 24 and defined as a Gd-enhancing lesion, new T2 lesion and/or enlarging T2 lesion; this takes into account that a newly active lesion may appear on both the MRI following Gd enhancement and on the T2-weighted MRI, and ensures that it is counted only once. The primary measure of interest was percentage
change in BOD (mm3) from baseline to week 48.
Second-ary measures of interest were absolute change in BOD from baseline (week 0) to week 48; percentage and abso-lute change in BOD from baseline to week 48 when
strat-ified by NAb status (patients with NAb titres ≥ 20
neutralizing units/mL were considered to be NAb+); and the correlation between changes in BOD from baseline to week 48 and changes in CUA from baseline to week 24. NAbs were measured using a cytopathic effect assay [5].
Statistical analyses
Change in BOD from baseline was compared between treatment groups using an analysis of covariance (ANCOVA) model with effect of treatment and baseline BOD as a single covariate. The treatment difference in means, adjusted for any baseline parameters that were sig-nificantly different between the groups, and the associated standard error (SE), were estimated on the raw data from the ANCOVA model. Treatment comparison p values were calculated using a similar ANCOVA model on ranked data. Histograms were constructed by treatment group to show and evaluate the distribution of percentage and absolute change in BOD from baseline to week 48.
For each treatment group, the relationship between changes in CUA from baseline to week 24 and changes in BOD from baseline to week 48 was assessed using a Spear-man's rank correlation analysis.
Results
A total of 677 patients were randomized to treatment in the EVIDENCE study. Of these, 553 patients met the inclusion criteria for this analysis (IFN beta-1a, 44 mcg sc tiw group: n = 279; IFN beta-1a, 30 mcg im qw group: n = 274). Three of 56 centres that participated in the EVI-DENCE study were only able to provide film (not digital) MRI data that was suitable for the activity analysis reported previously [3], but was not suitable for BOD. This affected both treatment groups equally. The two treatment groups did not differ significantly in demo-graphics or baseline lesion characteristics (Table 1).
Median percentage decreases in BOD were greater in the IFN beta-1a, 44 mcg sc tiw, treatment group (-6.7%; range: -65 to 431%) compared with the IFN beta-1a, 30 mcg im qw, treatment group (-0.6%; range: -61 to 197%). The adjusted mean treatment difference (AMTD) in percent-age change in BOD from baseline to week 48 showed a significant treatment benefit for patients treated with IFN 1a, 44 mcg sc tiw, over those treated with IFN beta-1a, 30 mcg im qw (-4.6%; SE: 2.6%; p = 0.002). Corre-spondingly, patients in the IFN beta-1a, 44 mcg sc tiw, treatment group had a greater median absolute change in
BOD (-189.55 mm3; range: -23454 to 56869 mm3)
com-pared with those in the IFN beta-1a, 30 mcg im qw,
treat-ment group (-19.0 mm3; range: -13337 to 10161 mm3;
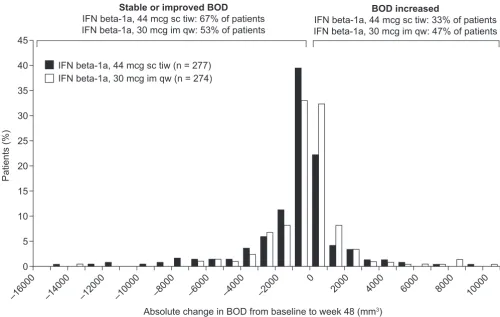
Figure 1). The distribution of absolute and percentage changes in BOD from baseline to week 48 are presented in Figures 2 and 3 and indicate that more patients in the
IFN beta-1a, 44 mcg sc tiw, treatment group had greater reductions in BOD compared with the IFN beta-1a, 30 mcg im qw, treatment group. In total, 67% of patients receiving IFN beta-1a, 44 mcg sc tiw, had a stable or improved BOD compared with 53% of patients receiving IFN beta-1a, 30 mcg im qw, and 47% of patients in the IFN beta-1a, 30 mcg im qw, treatment group had increased BOD between weeks 0 and 48 compared with 33% of patients in the IFN beta-1a, 44 mcg sc tiw, treat-ment group.
Table 1: Baseline patient demographics and burden of disease.
Interferon beta-1a treatment group
44 mcg sc tiw (n = 279) 30 mcg im qw (n = 274) p value*
Age in years, mean (SD) 38.6 (8.8) 37.7 (8.6) 0.188
Sex, n (%) 0.269
Men 64 (22.9) 74 (27.0)
Women 215 (77.1) 200 (73.0)
Race, n (%) 0.935
White 258 (92.5) 250 (91.2)
Black 12 (4.3) 15 (5.5)
Asian 0 1 (0.4)
Hispanic 5 (1.8) 4 (1.5)
Other 4 (1.4) 4 (1.5)
BOD in mm3, median (range) 5438 (85–135276) 6010 (391–103495) 0.541
*Treatment comparisons with respect to sex and race distributions were performed using a Chi-squared test or a Fisher's Exact test, where appropriate. With respect to age and baseline BOD, an analysis of covariance model using ranked data was performed with effects for treatment. Numbers do not add to 100% due to rounding.
BOD, burden of disease; im, intramuscular; qw, once weekly; sc, subcutaneous; SD, standard deviation; tiw, three times weekly.
Median absolute change in burden of disease (BOD) in each treatment group
Figure 1
Median absolute change in burden of disease (BOD) in each treatment group. IFN, interferon; im, intramuscu-lar; qw, once weekly; sc, subcutaneous; tiw, three times weekly.
0
IFN beta-1a, 44 mcg sc tiw
(n = 279)
IFN beta-1a, 30 mcg im qw
(n = 274)
–20 –40 –60 –80 –100 –120 –140 –160 –180 –200
Median absolute change in BOD (mm
3)
–189.5
Meaningful between-group comparisons by NAb status were not possible, as only seven (2.5%) patients devel-oped NAbs in the IFN beta-1a, 30 mcg im qw, treatment group. Patients receiving IFN beta-1a, 30 mcg im qw, were, therefore, treated as a single group. Median percent-age changes in BOD in the IFN beta-1a, 44 mcg sc tiw, NAb+ patients, IFN beta-1a, 44 mcg sc tiw, NAb- patients and IFN beta-1a, 30 mcg im qw, patients were -0.8, -8.0 and -0.6, respectively. Absolute BOD changes were -46.2, -254.6 and -19.0, respectively. There was no evidence of a significant difference in percentage change in BOD from baseline to week 48 between NAb+ patients receiving IFN beta-1a, 44 mcg sc tiw, and those receiving IFN beta-1a, 30 mcg im qw (AMTD: 0.5%; SE: 3.9%; p = 0.583; Figure 4). The AMTD in percentage change in BOD from baseline to week 48 significantly favoured NAb- patients in the IFN beta-1a, 44 mcg sc tiw, group over the IFN beta-1a, 30 mcg im qw, group (-6.6%; SE: 2.8%; p < 0.0001).
A correlation was seen between the change in BOD from baseline to week 48 and change in CUA from baseline to
week 24 within the IFN beta-1a, 44 mcg sc tiw, treatment
group (r = 0.385; p < 0.0001 for absolute and percentage
changes) and the IFN beta-1a, 30 mcg im qw, treatment
group (r = 0.179; p < 0.01 for absolute and percentage
changes), respectively.
Discussion and conclusion
In the current post-hoc analysis, patients with RRMS who were treated with IFN beta-1a, 44 mcg sc tiw, had a greater reduction in T2 BOD after 48 weeks than those given IFN beta-1a, 30 mcg im qw. This finding is consistent with other clinical and MRI outcome measures in the prospec-tive EVIDENCE study. Previous prospecprospec-tively defined analyses showed that patients receiving IFN beta-1a, 44 mcg sc tiw, also had a reduced likelihood of relapse and had significant reductions in CUA and T2 active lesions compared with those randomized to IFN beta-1a, 30 mcg im qw [1-3].
In general, the impact of both IFNs on suppressing Gd-enhancing lesions on MRI is seen quite early, within the
Distribution of absolute change in burden of disease (BOD) from baseline to week 48 in the two treatment groups
Figure 2
Distribution of absolute change in burden of disease (BOD) from baseline to week 48 in the two treatment groups. For presentation purposes, two patients receiving interferon (IFN) beta-1a, 44 mcg subcutaneously (sc) three times weekly (tiw), were removed from this plot; one patient had an extreme increase from baseline value of 56868.5 mm3 and another had an extreme reduction from baseline of 23453.6 mm3 percent changes in BOD. im, intramuscular; qw, once weekly.
45
40
35
30
25
IFN beta-1a, 44 mcg sc tiw (n = 277) IFN beta-1a, 30 mcg im qw (n = 274)
20
15
10
5
0
–16000 –14000 –12000 –10000 –8000 –6000 –4000 –2000
Absolute change in BOD from baseline to week 48 (mm3)
0
2000 4000 6000 8000 10000
Stable or improved BOD
IFN beta-1a, 44 mcg sc tiw: 67% of patients IFN beta-1a, 30 mcg im qw: 53% of patients
BOD increased
IFN beta-1a, 44 mcg sc tiw: 33% of patients IFN beta-1a, 30 mcg im qw: 47% of patients
first 1–2 months of initiating therapy [6]. Thus, it was con-sidered reasonable to compare the overall change in T2 BOD for a relatively short duration of observation. Fur-thermore, from previous experience, looking at BOD dif-ferences over 12 months maximizes the group change over the 'noise' created by individual variability. For com-pleteness, the data are presented as a histogram to show the spread of the response for both therapies. In this way it can be seen that both therapies can be associated with a stable MRI outcome or a worsening MRI outcome.
The distribution of absolute and percentage changes in BOD (Figures 2 and 3) in the current analysis indicates that patients in both treatment groups benefited from treatment with IFN beta-1a, but 14% more patients in the IFN beta-1a, 44 mcg sc tiw, treatment group had a stable or improved BOD compared with those treated with IFN beta-1a, 30 mcg im qw. In this 48-week analysis, there was an insufficient number of patients who had a clinical pro-gression in EDSS to explore this relationship further.
A new formulation of IFN beta-1a, 44 mcg sc tiw, has been developed and is currently being studied in a large-scale, Phase III, clinical trial (protocol 25632). Initial data indi-cate that this new formulation has a reduced
immuno-genic potential, which should reduce the likelihood of NAb development [7].
It is unclear how much NAbs affect clinical efficacy. NAbs take time to develop and patients with NAbs at 48 weeks may not have had NAbs during most of the preceding time. Likewise, some patients who had developed NAbs earlier may have lost them by week 48. Although some studies suggest that treatment success rates may be cur-tailed by the development of high titres of persistent NAbs in a minority of patients following long-term treatment with IFN beta [8-10], other studies have shown that the clinical efficacy of IFN beta is the same in patients who are NAb+ as in those who are NAb- [1,2,11]. However, the studies that did not show an effect of NAbs were less than 2 years in duration, and thus may not have been of suffi-cient duration to show an effect of NAbs on clinical out-comes. In the current analysis, sample sizes were not large enough to allow a direct comparison between NAb+ patients in each treatment group. Still, a comparison of patients receiving IFN beta-1a, 44 mcg sc tiw, who devel-oped NAbs, with all patients receiving IFN beta-1a, 30 mcg im qw (irrespective of NAb status), suggested that NAb+ patients in the IFN beta-1a, 44 mcg sc tiw, treatment group had a similar reduction in T2 BOD to the overall
Distribution of percentage change in burden of disease (BOD) from baseline to week 48 in the two treatment groups
Figure 3
Distribution of percentage change in burden of disease (BOD) from baseline to week 48 in the two treatment groups. For presentation purposes, two patients were removed from this plot because they had extreme percentage changes in BOD from baseline to week 48; one patient receiving interferon (IFN) beta-1a, 44 mcg subcutaneously (sc) three times weekly (tiw), had an increase of 431% from baseline and the other patient receiving IFN beta-1a, 30 mcg intramuscularly (im) once weekly (qw), had an increase of 197%.
35
30
25
IFN beta-1a, 44 mcg sc tiw (n = 277) IFN beta-1a, 30 mcg im qw (n = 274)
20
15
10
5
0
–70 –60 –50 –40 –30 –20 –10 0 10 20 30 40 50 60 70 80 90 100 110 120 130
Change in BOD from baseline (%)
IFN beta-1a, 30 mcg im qw, treatment group. In other words, patients with NAbs who receive dose, high-frequency IFN beta still gain similar treatment benefits as those, regardless of NAb status, who receive low-dose, low-frequency IFN beta. This means that, although effi-cacy may be attenuated with NAbs, therapeutic effect is still provided by IFN beta-1a, 44 mcg sc tiw, on BOD sup-pression. At week 48, a similar number of T2 active lesions was seen in NAb+ patients in the IFN beta-1a, 44 mcg sc tiw, treatment group (mean 1.6 lesions/patient/scan) as overall (NAb+ and NAb-) in the IFN beta-1a, 30 mcg im qw, treatment group (mean 1.4 lesions/patient/scan). However, the reduction in BOD was smaller in the IFN 1a, 44 mcg sc tiw, NAb+ group than in the IFN beta-1a, 44 mcg sc tiw, NAb- group at 48 weeks. This may sug-gest that MRI is more sensitive than clinical outcomes in showing an early effect of NAbs on efficacy.
This study is probably too short to address adequately a delayed impact of NAbs on MRI outcomes. To some degree, this has been assessed in the PRISMS (Prevention of Relapses and disability by Interferon beta-1a Subcuta-neously in Multiple Sclerosis) study, in which results at 48 months showed an increase in BOD in the NAb+ group of 17.6% and a decrease of 8.5% in the NAb- group (p < 0.001) [12].
Interestingly, in the present study there was no apparent impact of NAbs on relapse outcomes at week 48. Thus, these MRI data indicate only a partial impact of NAbs on efficacy outcomes at this time.
Competing interests
Drs A AL-Sabbagh, R Bennett and P Chang are employed by EMD Serono, Inc. The study was supported by Merck Serono International S.A., Geneva, Switzerland.
Mean treatment difference for percentage change in T2 burden of disease (BOD) between interferon (IFN) beta-1a, 44 mcg subcutaneously (sc) three times weekly (tiw), neutralizing antibody negative (NAb-), or IFN beta-1a, 44 mcg sc tiw, NAb+, ver-sus IFN beta-1a, 30 mcg intramuscularly (im) once weekly (qw)
Figure 4
Mean treatment difference for percentage change in T2 burden of disease (BOD) between interferon (IFN) beta-1a, 44 mcg subcutaneously (sc) three times weekly (tiw), neutralizing antibody negative (NAb-), or IFN beta-1a, 44 mcg sc tiw, NAb+, versus IFN beta-1a, 30 mcg intramuscularly (im) once weekly (qw).
7
–6.6%
p < 0.001 in favour
of IFN beta-1a,
44 mcg sc tiw
In favour of
IFN beta-1a,
30 mcg im qw
In favour of
IFN beta-1a,
44 mcg sc tiw
0.5%,
No significant
difference
NAb+ patients receiving
IFN beta-1a, 44 mcg sc tiw,
versus all patients receiving
IFN beta-1a, 30 mcg im qw
NAb– patients receiving
IFN beta-1a, 44 mcg sc tiw,
versus all patients receiving
IFN beta-1a, 30 mcg im qw
5
3
1
–1
–3
–5
–7
Mean treatment dif
ference
for percent change in
Publish with BioMed Central and every scientist can read your work free of charge
"BioMed Central will be the most significant development for disseminating the results of biomedical researc h in our lifetime."
Sir Paul Nurse, Cancer Research UK
Your research papers will be:
available free of charge to the entire biomedical community
peer reviewed and published immediately upon acceptance
cited in PubMed and archived on PubMed Central
yours — you keep the copyright
Submit your manuscript here:
http://www.biomedcentral.com/info/publishing_adv.asp
BioMedcentral
Authors' contributions
AT and DL carried out the MRI design and analysis and interpretation of results. All authors have read and approved the manuscript.
Acknowledgements
The authors thank Claire Inness (supported by Merck Serono International S.A., an affiliate of Merck KGaA, Darmstadt, Germany) and Robert Glanz-man, who at the time of the analysis was employed by Pfizer Global Phar-maceuticals and is now employed by Novartis PharPhar-maceuticals
Corporation (US affiliate of Novartis AG), for their assistance in the prep-aration of this manuscript.
Dr Guojun Zhao, UBC MS/MRI Research Group, identified all lesions for segmentation. Analysis technicians were Aileen To, Yu Wang, Jin Xiu Han, Leila Lagroix and Melinda Medina. Radiologists were Yan Cheng and Guo Jun Zhao.
References
1. Panitch H: Differences between IFN beta-1a 44 mcg tiw and 30 mcg qw sustained to 16 months: final EVIDENCE results. Intl J MS Care 2003, 5:80.
2. Panitch H, Goodin D, Francis G, Chang P, Coyle P, O'Connor P, Li D, Weinshenker B: for the EVIDENCE study group and the Uni-versity of British Columbia MS/MRI Research Group. Bene-fits of high-dose, high-frequency interferon beta-1a in relapsing-remitting multiple sclerosis are sustained to 16 months: final comparative results of the EVIDENCE trial. J Neurol Sci 2005, 239:67–74.
3. Panitch H, Goodin DS, Francis G, Chang P, Coyle PK, O'Connor P, Monaghan E, Li D, Weinshenker B: Randomized, comparative study of interferon beta-1a treatment regimens in MS: the EVIDENCE trial. Neurology 2002, 59(10):1496–1506.
4. Goodin DS, Frohman EM, Hurwitz B, O'Connor PW, Oger JJ, Reder AT, Stevens JC: Neutralizing antibodies to interferon beta: assessment of their clinical and radiographic impact: an evi-dence report: report of the Therapeutics and Technology Assessment Subcommittee of the American Academy of Neurology. Neurology 2007, 68(13):977–984.
5. Abdul-Ahad AK, Galazka AR, Revel M, Biffoni M, Borden EC: Inci-dence of antibodies to interferon-beta in patients treated with recombinant human interferon-beta 1a from mamma-lian cells. Cytokines Cell Mol Ther 1997, 3(1):27–32.
6. Li DK, Paty DW: Magnetic resonance imaging results of the PRISMS trial: a randomized, double-blind, placebo-control-led study of interferon-beta1a in relapsing-remitting multi-ple sclerosis. Prevention of Relapses and Disability by Interferon-beta1a Subcutaneously in Multiple Sclerosis. Ann Neurol 1999, 46(2):197–206.
7. Traboulsee A, AL-Sabbagh A, Bennett R, Chang P, Glanzman R, Rus-sell H, Li DKB: Greater reduction of MRI T2 burden of disease with interferon beta-1a 44 mcg administered subcutane-ously three times weekly than 30 mcg administered intra-muscularly once weekly: analysis of 48-week data from the EVIDENCE study: (27-30 September), Madrid, Spain. Vol-ume P678. ; 2006.
8. Francis GS, Rice GP, Alsop JC: Interferon beta-1a in MS: results following development of neutralizing antibodies in PRISMS. Neurology 2005, 65(1):48–55.
9. Kappos L, Clanet M, Sandberg-Wollheim M, Radue EW, Hartung HP, Hohlfeld R, Xu J, Bennett D, Sandrock A, Goelz S: Neutralizing antibodies and efficacy of interferon beta-1a: a 4-year con-trolled study. Neurology 2005, 65(1):40-47.
10. Perini P, Calabrese M, Biasi G, Gallo P: The clinical impact of interferon beta antibodies in relapsing-remitting MS. J Neurol
2004, 251(3):305-309.
11. Durelli L, Verdun E, Barbero P, Bergui M, Versino E, Ghezzi A, Mon-tanari E, Zaffaroni M: Every-other-day interferon beta-1b ver-sus once-weekly interferon beta-1a for multiple sclerosis: results of a 2-year prospective randomised multicentre study (INCOMIN). Lancet 2002, 359(9316):1453–1460.
12. PRISMS Study Group and the University of British Columbia MS/MRI Analysis Group: PRISMS-4: Long-term efficacy of interferon-beta-1a in relapsing MS. Neurology 2001, 56(12):1628–1636.
Pre-publication history
The pre-publication history for this paper can be accessed here: