R E S E A R C H
Open Access
Estimation of maximum intraventricular pressure:
a three-dimensional fluid
–
structure interaction
model
Hamidreza Ghasemi Bahraseman
1, Kamran Hassani
1*, Arezoo khosravi
2, Mahdi Navidbakhsh
3, Daniel M Espino
4,
Davood Kazemi-Saleh
2and Naser Fatourayee
5* Correspondence: [email protected] 1Department of Biomechanics, Science and Research Branch, Islamic Azad University, Tehran, Iran Full list of author information is available at the end of the article
Abstract
Background:The aim of this study was to propose a method to estimate the
maximum pressure in the left ventricle (MPLV) for a healthy subject, based on cardiac outputs measured by echo-Doppler (non-invasive) and catheterization (invasive) techniques at rest and during exercise.
Methods:Blood flow through aortic valve was measured by Doppler flow
echocardiography. Aortic valve geometry was calculated by echocardiographic imaging. A Fluid–structure Interaction (FSI) simulation was performed, using an Arbitrary Lagrangian–Eulerian (ALE) mesh. Boundary conditions were defined as pressure loads on ventricular and aortic sides during ejection phase. The FSI simulation was used to determine a numerical relationship between the cardiac output to aortic diastolic and left ventricular pressures. This relationship enabled the prediction of pressure loads from cardiac outputs measured by invasive and non-invasive clinical methods.
Results:Ventricular systolic pressure peak was calculated from cardiac output of Doppler, Fick oximetric and Thermodilution methods leading to a 22%, 18% and 24% increment throughout exercise, respectively. The mean gradients obtained from curves of ventricular systolic pressure based on Doppler, Fick oximetric and Thermodilution methods were 0.48, 0.41 and 0.56 mmHg/heart rate, respectively. Predicted Fick-MPLV differed by 4.7%, Thermodilution-MPLV by 30% and Doppler-MPLV by 12%, when compared to clinical reports.
Conclusions:Preliminary results from one subject show results that are in the range of literature values. The method needs to be validated by further testing, including independent measurements of intraventricular pressure. Since flow depends on the pressure loads, measuring more accurate intraventricular pressures helps to understand the cardiac flow dynamics for better clinical diagnosis. Furthermore, the method is non-invasive, safe, cheap and more practical. As clinical Fick-measured values have been known to be more accurate, our Fick-based prediction could be the most applicable.
Background
Cardiac disease is a major cause of death in industrialized countries, despite advances in prevention, diagnosis, and therapy [1]. Maximum pressure in the left ventricle (MPLV) assessment is among the most clinical measured for cardiac disease is import-ant for disease recognition [2]. However, its measurement requires invasive techniques. Therefore, this study has assessed a Fluid–structure Interaction (FSI) method to predict MPLV and trans-aortic pressure, as a non-invasive alternative to current methods.
Invasive techniques used to measure MPLV include Fick oximetric and Thermodilution [3], catheterisation alone [4] or with echo-Doppler [5] but have associated risks [3]. Hence, non-invasive measures have been correlated to invasive MPLV measurements [6-8]. How-ever, MPLV may vary with heart rate and/or exercise but few studies have investigated this effect [9]. This includes computational models (e.g. FSI, left intraventricular-impedance), which have so far neglected the exercise on intraventricular pressure gradients [10-12] despite the potential for inclusion of exercise modelling [13].
FSI simulations are overall well matched to cardiovascular modeling [14,15]. This method requires the use of an Arbitrary Lagrange-Euler (ALE) mesh to analyze both structural de-formation and fluid flow; i.e. Computational Fluid Dynamics and Finite Element Analysis [16,17]. Recently, FSI has been used to investigate heart valves [18-25]. Previously, using two-dimensional geometry, we have measured the cardiac output and stroke volume for a healthy subject by coupling an echo-Doppler method with an FSI simulation at rest and during exercise. Particular attention was given to validating the model against measures of cardiac function that could be reliably calculated by applying clinical protocols, with varying exercise [13]. The effect of exercise on blood flow hemodynamics including the change of flow patterns across the aortic valve, vorticity, shear rate, stress and strain on the leaflets during exercise were also assessed [26]. In our previous studies pressures across the aorta were measured experimentally and applied to models. However, MPLV was not predicted.
The aim of this study is to propose and develop an FSI computational model capable of predicting MPLV for a healthy subject. The model uses the relationship of cardiac output to MPLV derived from invasive clinical cardiac output measurement. First, the relation-ship between Cardiac output and systolic ventricular pressure and systolic aortic pressure is derived, using a three-dimensional geometry. Christie et al. [27] obtained equations for Thermodilution cardiac output (COT) and Fick oximetric cardiac output (COF) to Dop-pler cardiac output (COD), in a clinical setting. Therefore, COT and COF were measured for the subject. Subsequently, MPLV was calculated noting to the numerical relationship between cardiac output, systolic ventricular pressure and systolic aortic pressure.
Methods
Combined clinical and numerical approach
Design of experiment
A healthy male, aged 33, with normal cardiovascular function had his hemodynamic data recorded while rest and exercise. Informed consent was acquired for the partici-pant in line with accepted procedures approved by the Department of Cardiovascular Imaging (Shaheed Rajaei Cardiovascular, Medical and Research Center, Tehran, Iran).
Cardiovascular measurements
Hemodynamic data was assessed from maximal bicycle exercise tests and Doppler ECG.
Bahrasemanet al. BioMedical Engineering OnLine2013,12:122 Page 2 of 12
Systolic and diastolic pressures of the brachial artery were measured and related to heart rate changes at rest and exercise (Figure 1). Equations 1 and 2 were used to deter-mine the aortic pressure from brachial aortic pressure measurements. This relationship was previously determined by comparing brachial pressure (acquired by Oscillometry) to the aortic pressure acquired using an invasive method [28].
Aortic systolic pressure » Brachial systolic pressure + 2.25 (1)
Aortic diastolic pressure≈Brachial diastolic pressure–5:45 ð2Þ
where all pressures were measured inmmHg.
Left ventricular systolic pressure was derived from the calculated aortic systolic pres-sure. Previously, a pressure difference of around 5 mmHg was found between peak left ventricular systolic pressure and aortic systolic pressure, using catheterization [29]. The ejection times were derived from Doppler-flow imaging under B-mode.
Geometry
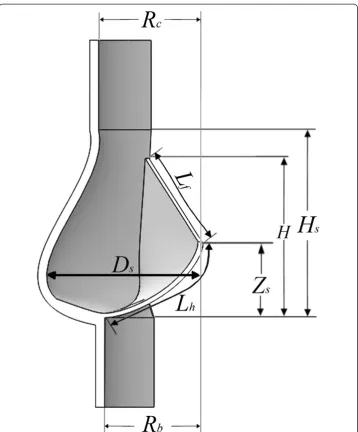
A three-dimensional axisymetric model has been used with one-sixth of the valve geom-etry modelled (Figure 2; Table 1). Briefly, aortic valve geomgeom-etry was obtained with respect to T-wave of ECG (maximum opening area). Diameters of the aortic valve annulus and the sinus valsalva were measured at the peak T-wave time using a resting para-sternal long-axis view. This data was used to generate the three-dimensional geometry (Figure 2) in Solidworks (Solidworks v2011, Dassault Systèmes SolidWorks Corp, France). In our model, leaflets were assumed to have a uniform thickness (0.6 mm).
Fluid–structure interaction simulation
Valve cusps were considered to be isotropic, homogenous and to have a linear stress– strain relationship. This assumption has been used in other heart valve models [19,22,23,30]. Blood was assumed to be an incompressible and Newtonian fluid [15]. All material properties are provided in Table 2 and were obtained from the literature [31,32].
Figure 2The simulated aortic valve geometry.An axisymmetric model was used with one-sixth of the valve represented. The top view was acquired using the assumed symmetry of the model.
Table 1 Geometric parameters of the aortic valve as shown in Figure 2
Rb Rc H Hs Lh Lf Ds Zs
Radius of the base (mm)
Radius at the commissures
(mm)
Valve height
(mm) Sinus height
(mm) Leaflet height (mm)
Leaflet free edge length (mm)
Sinus maximum radius
(mm)
Sinus maximum radius location (mm)
11.5 11.75 16.1 20.36 14 14.95 16.65 8.30
Bahrasemanet al. BioMedical Engineering OnLine2013,12:122 Page 4 of 12
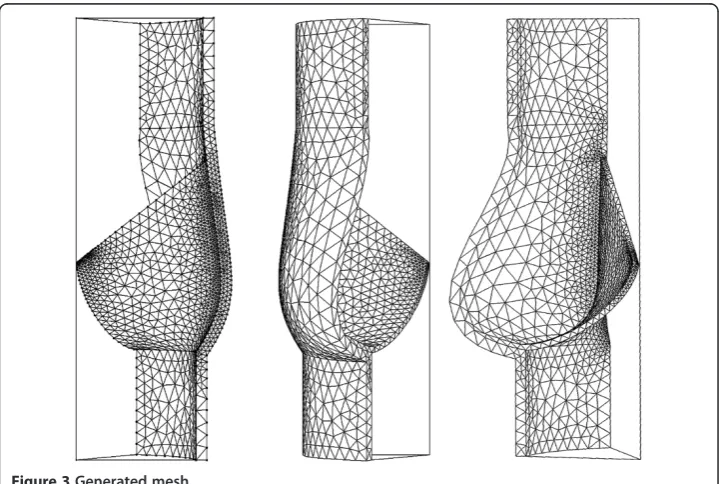
For fluid boundaries (Figure 2), pressure was applied at the inflow boundary of the aortic root at the left ventricular side. A moving ALE mesh was used which enabled the deformation of the fluid mesh to be tracked without the need for re-meshing [33]. Sec-ond order Lagrangian elements were used to define the mesh. The mesh contained a total of 87357 elements (Figure 3). The finite element analysis package Comsol Multi-physics (v4.2, Londen: Comsol Ltd.) was used to solve the FSI model under time dependent conditions [22,23,34]. The fluid velocity is coupled to the structural deform-ation while the valve is loaded by the fluid, this ensures simultaneous coupling [35-37].
Hemodynamic measurements and relationships
Cardiac output was computed using Equation 3:
Cardiac output¼Stroke volumeHeart rate ð3Þ
where the stroke volume was calculated from ECG using Equation 4:
Stroke volume¼VelocityAortic area ð4Þ
where the velocity integration was automatically obtained by tracing the Doppler flow from ultrasound imaging. The aortic area was calculated using Equation 5:
Area¼π D
2 2
ð5Þ
whereDis the measured ascending aortic diameter after the sinotubular junction (Table 1).
Table 2 Mechanical properties
Viscosity (Pa.s) Density (kg/m3) Young’s modulus (N/m2) Poisson ratio
3.5 x 10⁻³ 1056 6.885 x 10⁶ 0.4999
For FSI simulations, the aortic diastolic pressure’s change was obtained at each time step of the ejection period as shown in Figures 4. Equation 6, however, was used to de-termine the velocity integration (used to dede-termine both stroke volume and cardiac output).
Velocity intergration¼
∮
Ejection time
0 V:dt ð6Þ
where V is the fluid-velocity through the outlet boundary. Stroke volume and cardiac output predicted from FSI simulations were compared to values determined by echo-Doppler. Note that the mean velocity for each heart rate was obtained using Equation 7.
Velocity mean¼Velocity intergration
Ejection time ð7Þ
Results
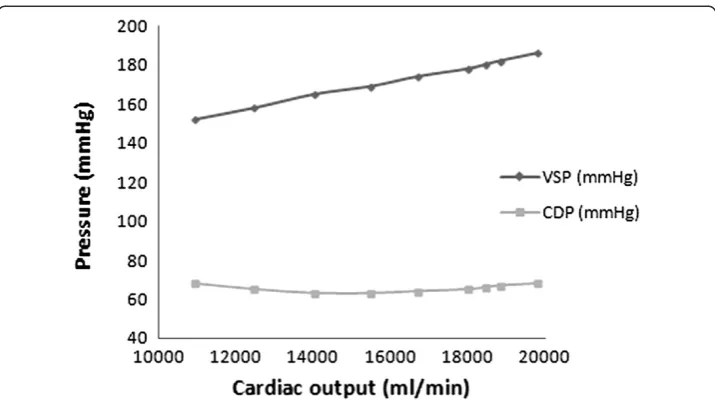
Doppler and numerical cardiac outputs are provided in Table 3. They used to calculate Left ventricular systolic pressure (VSP; Equation 8) and Aortic diastolic pressure (ADP; Equation 4) to the cardiac output predicted numerically (Figure 5 and Table 3):
VSP¼−4:49710−9ðCOÞ2−0:003868ðCOÞ þ110:6; R2¼0:9977 ð8Þ
ADP¼2:5610−7ðCOÞ2−0:007788ðCOÞ þ122:3; R2¼0:9674 ð9Þ
Note thatCOandHrrefer to cardiac output and heart rate, respectively.
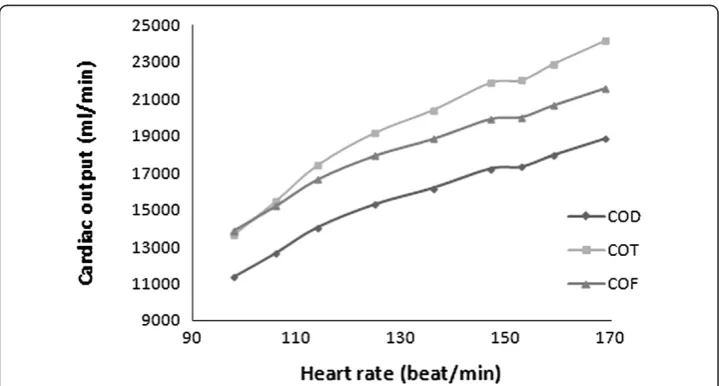
A relationship between Doppler cardiac output and heart rate was obtained, using Table 3 [38]:
COD¼−0:7534ð ÞHr 2−300:7ð Þ þHr 10710; R2¼0:9934 ð10Þ
Figure 4FSI prediction of aortic diastolic pressure’s change relative to heart rate based on Doppler method (ADPD), Fick oximetric method (ADPF), Thermodilution method (ADPT).
Bahrasemanet al. BioMedical Engineering OnLine2013,12:122 Page 6 of 12
Christie et al. [27] obtained regression equations for the relationship between Ther-modilution cardiac output (COT) and Fick oximetric cardiac output (COF) to Doppler cardiac output (COD), based on the data given from 15 subjects:
COT¼1:41ðCODÞ−2394 ð11Þ
COF ¼1:03ðCODÞ þ2165 ð12Þ
Relationships between Fick oximetric (COF) and Thermodilution cardiac output (COF) relative to the heart rate (Figure 6) have been derived by combining above men-tioned equations:
COT¼−1:062ð ÞHr 2þ424ðCOÞ þ17500; R2¼0:9934 ð13Þ
COF ¼−0:776ð ÞHr 2þ309ð ÞHr −8870; R2 ¼0:9934 ð14Þ
Variation in aortic diastolic (Figure 4) and left ventricular systolic (Figure 7) pressures with heart rate, have been derived from Thermodilution, Fick oximetric, and Doppler
Table 3 Hemodynamic measurements
Heart rate (bpm)
Ventricular systolic pressure (mmHg)
Aortic diastolic pressure (mmHg)
Doppler-cardiac output (ml/min)
Numerical-cardiac output (ml/min)
98 152 68 11356 10916.97
106 158 65 12651 12478.27
114 165 63 14051 14031.32
125 169 63 15298 15487.93
136 174 64 16172 16686.83
147 178 65 17225 18012.27
153 180 66 17330 18445.6
159 182 67 17941 18844.08
169 186 68 18849 19817.15
methods using Equations 8, 9, 10, 11, 12, 13 and 14. Both pressures rise with heart rate, despite differences in absolute values predicted using the different methods.
Aortic diastolic pressure, derived from Doppler based measurements, increased by 1% (0.7 mmHg) with increasing heart rate from 98 bpm to 169 bpm. This compares to 17% (10 mmHg) using Fick oximetry and 31.3% (19.9 mmHg) using thermodilution. The gradients of aortic diastolic pressure to heart rate were 0.04, 0.14 and 0.28 mmHg/ heart rate measured using Doppler, Fick oximetric and Thermodilution, respectively.
The ventricular systolic pressure, predicted from the Doppler method, increased 22% (34 mmHg), with increasing heart rate from 98 bpm to 169 bpm (Figure 7). This
Figure 6FSI prediction of cardiac output’s change relative to heart rate based on Doppler method (COD), Fick oximetric method (COF), Thermodilution method (COT).
Figure 7FSI prediction of ventricular systolic pressure’s change relative to heart rate based on Doppler method (VSPD), Fick oximetric method (VSPF), Thermodilution method (VSPT).
Bahrasemanet al. BioMedical Engineering OnLine2013,12:122 Page 8 of 12
increase was calculated to be 18% (28.9 mmHg) using Fick oximetry and 24% (39.6 mmHg) for Thermodilution. The gradients of ventricular systolic pressure to heart rate were 0.48, 0.41 and 0.56 (mmHg/heart rate) measured using Doppler, Fick oximetric and Thermodilution, respectively.
Discussion
Study findings
The study has combined an FSI model with hemodynamic measurements of the cardiac output from a healthy subject [13] and invasive clinical measurements [27] in order to estimation of maximum pressure in the left ventricles during exercise. Using a three-dimensional model, the method developed has potential for clinical application (see Initial insights in to clinical application & reliability section) and the obtained values show good agreement with the literature (see comparison to literature section). More-over, the FSI model reliably predicted MPLV over a range of heart rates based on clin-ical measurement of cardiac outputs. MPLV was calculated by cardiac output of Doppler method, Fick oximetric and Thermodilution method which shows 22%, 18% and 24% increment during exercise, respectively.
Initial insights in to clinical application & reliability
Regression analysis between echo-Doppler and FSI simulations resulted in a strong cor-relation (r = 0.998; Table 3) for cardiac output. Therefore, there was a strong corcor-relation between the two mentioned methods, as clinical and computational techniques, with similar values were predicted. Predicting reliable intraventricular pressures is important in clinical diagnosis and treatment [2]. For instance, a recent commercial device to as-sess intraventricular pressure has a fluid-filled, balloon-tipped, catheter that is intended for insertion into the ventricle [39]. The balloon provides a closed system from which intraventricular pressure is determined. Its use is often limited to animal studies be-cause of the risks involved with this invasive device.
Catheterization-Thermodilution is the current gold-standard for measuring intraven-tricular pressure [3]. It is an invasive procedure with potential risks such as heart fail-ure, cardiac arrhythmia, and even death [3]. Moreover, Thermodilution exposes the patient and doctor to radiation. Exercising while catheterized results in a range of prac-tical problems too, therefore, is not a common customary action. However, numerical methods enable estimation of cardiac function by non-invasive measurements during an exercise protocol. Therefore, the key-concern is the dependability of numerical methods when predicting MPLV while exercise.
Comparison to literature
the normal exercise cycle [40]. Our Thermodilution-based prediction lead to an over-estimate of about 30%, our Fick oximetric-based prediction is underover-estimated by 4.7% and our Doppler prediction is overestimated by 12% when compared to standard text-book average values. Our results are in agreement with reports that Fick based methods provide more reliable measurements [41-45].
Textbook maximum systolic pressure for healthy left ventricles range from 250 to 300 mmHg, but varies widely among different subjects with heart strength and degree of heart stimulation by cardiac nerves [9]. MPLV measured through catheterization has ranged between 121 mmHg (at 75 bpm) to 210 mmHg (at 180 bpm) [9]. A study of healthy patients without valve abnormalities found the mean MPLV to be 121 mmHg (at 75 bpm, at rest) and 149 mmHg (at 108 bpm, during exercise).
Limitations & future trends
The main limitations are that:
▪mechanical properties have been simplified and a constant single diameter has been
used for the ascending aorta in the model;
▪statistical and generalized data are typically used for clinical assessment of
hemodynamics but in our study only one subject was used for the initial development of a method for MPLV prediction.
Despite model limitations we presented excellent agreement with clinical measure-ments and the general literature [13]. A full three-dimensional model could result in more precise predictions, while, it would also increase the solution time (currently about 17 hours). This would hold disadvantages for clinical applications. Furthermore, a range of values for statistical comparison are not predictable without including model variability [23]. However, at this time, there is a tendency towards patient specific models [46], due to potential profits in aiding treatment/diagnosis for an individual. Prediction of intraventricular pressure could also be useful to construct more reliable heart valve prototypes [47].
Conclusions
This study demonstrates the technical feasibility of combining a three-dimensional fluid- structure interaction model of the aortic valve with clinical measurements. The study is intended as a proof of concept that such a model can be used to reliably pre-dict maximum pressure in the left ventricles. The reliability and accuracy of this method for clinical use with human subjects would require appropriate clinical studies.
Abbreviations
MPLV:Maximum pressure in the left ventricle; ALE: Arbitrary Lagrangian–Eulerian; FSI: Fluid–structure interaction; COT: Thermodilution cardiac output; COF: Fick oximetric cardiac output; COD: Doppler cardiac output; VSP: Ventricular systolic pressure; ADP: Aortic diastolic pressure; ADPD: FSI prediction of aortic diastolic pressure’s change relative to heart rate based on Doppler method; ADPF: FSI prediction of aortic diastolic pressure’s change relative to heart rate based on Fick oximetric method; ADPT: FSI prediction of aortic diastolic pressure’s change relative to heart rate based on Thermodilution method; VSPD: FSI prediction of ventricular systolic pressure’s change relative to heart rate based on Doppler method; VSPF: FSI prediction of ventricular systolic pressure’s change relative to heart rate based on Fick oximetric method; VSPT: FSI prediction of ventricular systolic pressure’s change relative to heart rate based on Thermodilution method.
Competing interests
The authors of the manuscript declare that they have no conflict of interest.
Bahrasemanet al. BioMedical Engineering OnLine2013,12:122 Page 10 of 12
Authors’contributions
HGB has done the modeling and simulations, KH, AKH, and DKS reviewed the results, MN, NF approved the final results and discussions, and DME commented the structure of the research, edited the manuscript and revised it. All authors read and approved the final manuscript.
Author details
1
Department of Biomechanics, Science and Research Branch, Islamic Azad University, Tehran, Iran.2Atherosclerosis research center, Tehran, Iran.3Department of Mechanical Engineering, Iran University of Science and Technology, Tehran, Iran.4School of Mechanical Engineering, University of Birmingham, Birmingham, UK.5Department of Biomedical Engineering, Amirkabir University, Tehran, Iran.
Received: 24 February 2013 Accepted: 18 November 2013 Published: 22 November 2013
References
1. Murphy SL, Xu J:Deaths: preliminary data for 2010.Natl Vital Stat Rep2012,4(60):31.
2. Bonow RO, Mann DL, Zipes DP, Libby P:Book Braunwald’s Heart Disease: A Textbook of Cardiovascular Medicine.9th edition. Saunders Elsevier: Philadelphia, Pa; 2011.
3. Lavdaniti M:Invasive and non-invasive methods for cardiac output measurement.Int J Caring Sci2008,1(3):112–117. 4. Courtois MA, Kovacs SJ, Ludbrook PA:Physiologic early diastolic intraventricular pressure gradient is lost
during acute myocardial ischemia.Circulation1990,82:1413–1423.
5. Brenner JI, Baker KR, Berman MA:Prediction of left ventricular pressure in infants with aortic stenosis.Br Heart J
1980,44(4):406–410.
6. Greenberg NL, Vandervoort PM, Thomas JD:Instantaneous diastolic transmitral pressure differences from color Doppler M mode echocardiography.Am J Physiol1996,271:H1267–H1276.
7. Firstenberg MS, Vandervoort PM, Greenberg NL,et al:Noninvasive estimation of transmitral pressure drop across the normal mitral valve in humans: importance of convective and inertial forces during left ventricular fi lling.J Am Coll Cardiol2000,36:1942–1949.
8. Tonti G, Pedrizzetti G, Trambaiolo P, Salustri A:Space and time dependency of inertial and convective contribution to the transmitral pressure drop during ventricular fi lling.J Am Coll Cardiol2001, 38:290–291.
9. Pasipoularides A, Murgo JP, Miller JW, Craig WE:Nonobstructive left ventricular ejection pressure gradients in man.Circ Res1987,61(2):220–227.
10. Redaelli A, Montevecchi FM:Computational evaluation of intraventricular pressure gradients based on a fluid–structure approach.J Biomech Eng, transactions of the ASME1996,118(4):529–537.
11. Clavin OE, Spinelli JC, Alonso H, Solarz P, Valentinuzzi ME, Pichel RH:Left intraventricular pressure–impedance diagrams (DPZ) to assess cardiac function. Part 1: morphology and potential sources of artifacts.Med Progn Technol1986,11:17–24.
12. Spinelli JC, Clavin OE, Cabrera EI, Chatruc MR, Pichel RH, Valentinuzzi ME:Left intraventricular pressure–impedance diagrams (DPZ) to assess cardiac function. Part II: determination of end-systolic loci.Med Progn Technol1986, 11:25–32.
13. Bahraseman HG, Hassani K, Navidbakhsh M, Espino DM, Sani ZA, Fatouraee N:Effect of exercise on blood flow through the aortic valve: a combined clinical and numerical study.Comput Methods Biomech Biomed Engin
2013. In Press. DOI: 10.1080/10255842.2013.771179.
14. Bellhouse BJ:The fluid mechanics of heart valves.InBook Cardiovascular fluid mechanics.Volume 1st edition. Edited by Bergel DH. London: Academic Press; 1972.
15. Caro CG, Pedley TJ, Schroter RC, Seed WA:Book The mechanics of the circulation.Oxford: Oxford University Press; 1978.
16. Donea J, Giuliani S, Halleux JP:An arbitrary Lagrangian–Eulerian finite element method for transient dynamic fluid–structure interactions.Comput Methods Appl Mech Engrg1982,33(1–3):689–723.
17. Formaggia L, Nobile F:A stability analysis for the arbitrary Lagrangian Eulerian formulation with finite elements.East–West J Numer Math1999,7(2):105–132.
18. Al-Atabi M, Espino DM, Hukins DWL:Computer and experimental modelling of blood flow through the mitral valve of the heart.J Biomech Sci Eng2010,5(1):78–84.
19. De Hart J, Peters GW, Schruers PJ, Baaijens FP:A two-dimensional fluid–structure interaction model of the aortic valve.J Biomech2000,33(9):1079–1088.
20. De Hart J, Peters GW, Schreurs PJ, Baaijens FP:A three-dimensional computational analysis of fluid–structure interaction in the aortic valve.J Biomech2003,36(1):103–112.
21. De Hart J, Baaijens FP, Peters GW, Schreurs PJ:A computational fluid–structure interaction analysis of a fiber-reinforced stentless aortic valve.J Biomech2003,36(5):699–712.
22. Espino DM, Shepherd DET, Hukins DWL:Evaluation of a transient, simultaneous, Arbitrary Lagrange Euler based multi-physics method for simulating the mitral heart valve.Comput Methods Biomech Biomed Engin
2013. In Press. DOI: 10.1080/10255842.2012.688818.
23. Espino DM, Shepherd DET, Hukins DWL:A simple method for contact modelling in an arbitrary frame of reference within multiphysics software.J Mech2013,29(3):N9–N14.
24. Stijnen JMA, De Hart J, Bovendeerd PHM, Van de Vosse FN:Evaluation of a fictitious domain method for predicting dynamic response of mechanical heart valves.J Fluids Struct2004,19(6):835–850.
25. Xia GH, Zhao Y, Yeo JH:Numerical Simulation of 3D Fluid–structure Interaction Using AN Immersed Membrane Method.Modern Physics Letters B2005,19(28–29):1447–1450.
27. Christie J, Sheldahl LM, Tristani FE, Sagar KB, Ptacin MJ, Wann S:Determination of stroke volume and cardiac output during exercise: comparison of two-dimensional and Doppler echocardiography, Fick oximetry, and Thermodilution.Circulation1987,76(3):539–547.
28. Park SH, Lee SJ, Kim JY, Kim MJ, Lee JY, Cho AR, Lee HG, Lee SW, Shin WY, Jin DK:Direct comparison between brachial pressure obtained by oscillometric method and central pressure using invasive method. Soonchunhyang Medical Science2011,17(2):65–71.
29. Laske A, Jenni R, Maloigne M, Vassalli G, Bertel O, Turina MI:Pressure gradients across bileaflet aortic valves by direct measurement and echocardiography.Ann Thorac Surg1996,61(1):48–57.
30. Weinberg EJ, Kaazempur-Mofrad MR:A multiscale computational comparison of the bicuspid and tricuspid aortic valves in relation to calcific aortic stenosis.J Biomech2008,41(16):3482–3487.
31. Govindarajan V, Udaykumar HS, Herbertson LH, Deutsch S, Manning KB, Chandran KB:Two-dimensional FSI simulation of closing dynamics of a tilting disk mechanical heart valve.J. Med. Devices2010,4(1):011001(1–11). 32. Koch TM, Reddy BD, Zilla P, Franz T:Aortic valve leaflet mechanical properties facilitate diastolic valve function.
Comput Methods Biomech Biomed Engin2010,13(2):225–34.
33. Winslow AM:Numerical solution of the quasilinear poisson equation in a nonuniform triangle mesh.J Comput Phys1966,1(2):149–172.
34. Espino DM, Shepherd DET, Hukins DWL:Development of a transient large strain contact method for biological heart valve simulations.Comput Methods Biomech Biomed Engin2013,16(4):413–424.
35. Dowell EH, Hall KC:Modelling of fluid–structure interaction.Annu Rev Fluid Mech2001,33(1):445–490. 36. Wall W, Gerstenberger A, Gamnitzer P, Forster C, Ramm E:Large deformation fluid–structure interaction–
advances in ALE methods and new fixed grid approaches.InFluid–structure interaction.Edited by Bungartz HJ, Shafer M. Berlin: Springer; 2006.
37. Van de Vosse FN, De Hart J, Van Oijen CHGA, Bessems D, Gunther TWM, Segal A, Wolters BJBM, Stijnen JMA, Baaijens FPT:Finite-element-based computational methods for cardiovascular fluid–structure interaction.J Eng Math2003, 47(3–4):335–368.
38. MATLAB version 7.10.0.Natick, MA, USA: The MathWorks; 2010.
39. Intraventricular Pressure Measurement in a Langendorff Preparation.http://cdn.adinstruments.com/adi-web/ techniques/TN-BalloonCatheter.pdf.
40. Guyton AC, Hall JE:Textbook of Medical Physiology.Philadelphia, PA: WB Saunders; 1996:27.
41. Mahutte CK, Jaffe MB, Chen PA, Sasse SA, Wong DH, Sassoon CS:Oxygen Fick and modified carbon dioxide Fick cardiac outputs.Crit Care Med1994,22(1):86–95.
42. Jarvis SS, Levine BD, Prisk GK, Shykoff BE, Elliott AR, Rosow E, Blomqvist CG, Pawelczyk JA:J Appl Physiol2007, 103(3):867–874. Epub 2007 Jun 7.
43. Maroni JM, Oelberg DA, Pappagianopoulos P, Boucher CA, Systrom DM:Maximum cardiac output during incremental exercise by first-pass radionuclide ventriculography.Chest1998,114(2):457–461.
44. Sugawara J, Tanabe T, Miyachi M, Yamamoto K, Takahashi K, Iemitsu M, Otsuki T, Homma S, Maeda S, Ajisaka R, Matsuda M:Non-invasive assessment of cardiac output during exercise in healthy young humans: comparison between Modelflow method and Doppler echocardiography method.Acta Physiol Scand2003, 179(4):361–366.
45. Monroe RG, La Farge CG, Gamble WJ, Hammond RP, Gamboa R:Left ventricular performance and blood catecholamine levels in the isolated heart.Am J Physiol1966,211(5):124854.
46. Öhman C, Espino DM, Heinmann T, Baleani M, Delingette H, Viceconti M:Subject-specific knee joint model: design of an experiment to validate a multi-body finite element model.Visual Comp2011,27(2):153–159. 47. Verhey JF, Nathan NS, Otto R, Ron K, Fabian R, D’Ambra MN:Finite-element-method (FEM) model generation of
time-resolved 3D echocardiographic geometry data for mitral-valve volumetry.Biomed Eng Online2006,5:17. Published online 2006 March 3. doi: 10.1186/1475-925X-5-17.
doi:10.1186/1475-925X-12-122
Cite this article as:Bahrasemanet al.:Estimation of maximum intraventricular pressure: a three-dimensional fluid–structure interaction model.BioMedical Engineering OnLine201312:122.
Submit your next manuscript to BioMed Central and take full advantage of:
• Convenient online submission
• Thorough peer review
• No space constraints or color figure charges
• Immediate publication on acceptance
• Inclusion in PubMed, CAS, Scopus and Google Scholar
• Research which is freely available for redistribution
Submit your manuscript at www.biomedcentral.com/submit
Bahrasemanet al. BioMedical Engineering OnLine2013,12:122 Page 12 of 12