Journal of Information Technology and Computer Science Volume 2, Number 2, 2017, pp. 85-91
Journal Homepage: www.jitecs.ub.ac.id
Implementation of Lossless Voice Data Communication
using Network Streams on Embedded System
Barlian Henryranu Prasetio1, Dahnial Syauqy2
Computer System and Robotics Lab, Faculty of Computer Science, University of Brawijaya, Malang, Indonesia
{1[email protected], 2[email protected]}
Received 14 March 2017; accepted 05 November 2017
Abstract. Smart home refers to the use of computers and information technology to control home appliances. The smart home system occupies sensors to acquire data for monitoring. One of the most important factors in designing a smart home system was the communication between devices that will be used. It requires high throughput and low latency communication so that monitoring can be done in real time and lossless. The communication network was designed to optimize the stream monitoring for smart home by reviewing the system throughput and latency. Lab-VIEW programming on My-RIO embedded systems was used to acquire accelerometer and voice data readings and send them to personal computer wirelessly. The network communication was designed by implementing network stream protocols between two applications which were planted in the personal computer and My-RIO system. The test results indicate that the network stream protocol did not require normalization of sensor data types while transmitting and receiving. The throughput values were affected by increasing buffer size but on certain conditions saturated throughput were experienced. The value of the latency is always stable with an average value of 13 ms even though the size of the buffer is enlarged.
1 Introduction
Smart home is a system that uses computers and information technology to control home appliances. The system can be a computer/microcontroller based on networks with different levels of intelligence and automation [1]. Smart home can provide convenience, security and energy efficiency [2]. One important factor in designing a smart home system is the communication of data between devices used in the system.
Data communication is the exchange of data between two or more devices via a transmission medium such as cable [3]. A data communication process occurs when the devices are connected to a part of the communication system, which consists of a combination of hardware and software [4]. The effectiveness of a data communication system depends on four fundamental characteristics, namely packet loss, delay, throughput and jitter [5].
Ethernet is used as a medium in the process of information exchange [6]. There are three models of network communication [7]:
1. Command or Message Base Communication 2. Process Data Communication
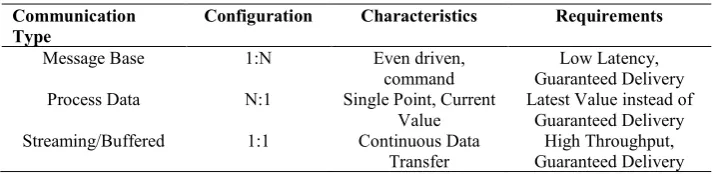
Details of network communication model characteristics are shown in Table 1.
Table 1. Communication model characteristics Communication
Type Configuration Characteristics Requirements
Message Base 1:N Even driven, command
Low Latency, Guaranteed Delivery Process Data N:1 Single Point, Current
Value
Latest Value instead of Guaranteed Delivery Streaming/Buffered 1:1 Continuous Data
Transfer
High Throughput, Guaranteed Delivery
The specific characteristics of each model of network characteristics in Table 1, can be used as a reference to determine the model and the network protocol used in configuring applications and system requirements [7].
Generally, TCP or UDP is used in data communication systems between computers. TCP and UDP is a network protocol that has high throughput, but costly in its implementation [7]. TCP and UDP network connections require manual management and each connection requires ports. In addition, TCP and UDP data types in the format string. This means that the sender must flatten all the data to a string and receiver must unflatten data from string. Therefore, additional layers need to be added to the complexity of the data transmission of non-string [7].
Network streams can transfer most types of data on Lab-View including clusters and arrays [8]. Network streams can also pass data from computer to computer, computer real-time targets, or targets real-time to real-time targets.
Based on the background outlined above, can be formulated problem: How to network streams to optimize the delivery of data without failure, How does the buffer size to throughput and CPU Usage and How the system performance in terms of throughput and latency.
2 Research Methods
2.1 System Requirement Analysis
The system makes it possible to carry out the process together. In addition, the system also requires some means of communication between some processes such as queues, events and other users. System requirements can be obtained from the network protocol stream. Here are the features of network stream:
1. Connection management a. The need for ordering
b. Decides connections to a network that does not fit. Where possible cope with data loss
2. Transfer of data by generic
a. Serial to and from a binary stream
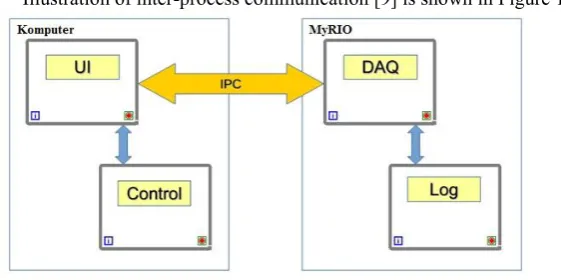
p-ISSN: 2540-9433; e-ISSN: 2540-9824 Illustration of inter-process communication [9] is shown in Figure 1.
Fig. 1. Inter-process Communication
2.2 Voice Data
The voice signal is recognized and recorded using acquiresound () [10]. Acquiresound function () functions in LabVIEW known as the "Acquire Sound Express VI". The voice data is stored in an array format. Symbol VI to Acquire Sound Express VI is shown in Figure 2.
Fig. 2. Acquire Sound Express VI.
2.3 Connection Management
Creation process connection from one host to another is quite complex and involves multiple exchange of packets between two endpoints, and takes a long time. That requires a connection between endpoint management [11].
Endpoint using a FIFO buffer to transfer data. Streams Network Engine (NSE) is using Logos-XT [12] to transfer data from the FIFO buffer writer endpoint to the FIFO buffer on the reader endpoint. Figure 3 illustrates the flow of data within the network.
3 Result and Discussion
Lossless communication system with a network stream, requiring two devices that are used to transmit data, in this case is My-RIO and PC. The data is sent in the form of voice data from the microphone contained in My-RIO input. Input data is received by a single voice on the network stream write blocks on My-RIO. Before single write transmit the voice data in the single read PC, reader to initialize the block create endpoints on each endpoint network stream. Initialization was done by the size of the buffer, ID sender/recipient and sender address/recipient data. After initialization is complete, the data is sent from a single write My-RIO towards single read PC using Wi-Fi communications. To perform the test latency, data received on the PC need to be sent back to My-RIO to determine the round trip time two-way communication. The process is done by sending the received data direct read single write on a single PC to the network stream PC. Then the data is sent using Wi-Fi communication to the single read contained in my-RIO. Once the data is received single read My-RIO, destroy blocks endpoint will remove all endpoints contained in My-RIO or PC.
3.1 Implementation
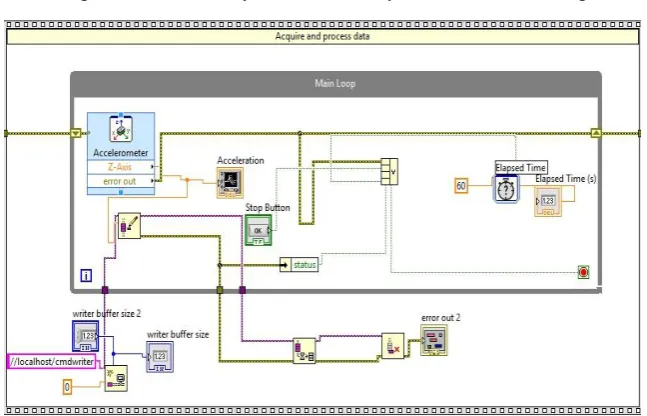
Modeling at the transmitter system that uses My-RIO can be seen in Figure 4.
Fig. 4. Endpoint Writer System Modeling
p-ISSN: 2540-9433; e-ISSN: 2540-9824 Fig. 5. Endpoint Reader System Modeling
3.2 Testing
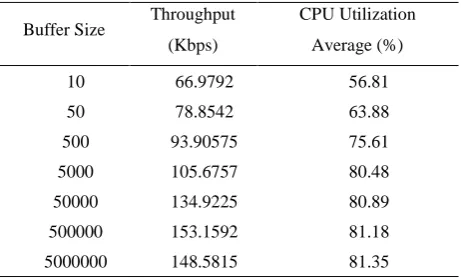
Data z-axis accelerometer on My-RIO sent without delay. The amount of data sent in one shipment of one element which is equivalent to 64 bits. Shipping data using wireless module contained in My-RIO system that has data transfer speed of 65Mbps. Data transmission is done in a peer-to-peer between My-RIO with a PC that has been installed Lab-VIEW software. Throughput obtained by sending an accelerometer sensor data for 60 seconds by My-RIO. Then the amount of data received by the PC, divided by 60 so we will get the amount of data received every second. Testing is done by giving the variation in the size of the buffer that is used to determine the effect of buffer size on the throughput. The test chart can be seen in Table 2.
Table 2. The Testing Result of Throughput with increasing buffer size.
Buffer Size Throughput
(Kbps)
CPU Utilization
Average (%)
10 66.9792 56.81
50 78.8542 63.88
500 93.90575 75.61
5000 105.6757 80.48
50000 134.9225 80.89
500000 153.1592 81.18
5000000 148.5815 81.35
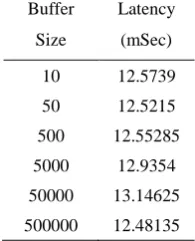
Table 3. The Testing Result of Latency with increasing buffer size.
Buffer
Size
Latency
(mSec)
10 12.5739
50 12.5215
500 12.55285
5000 12.9354
50000 13.14625
500000 12.48135
4 Conclusions
Throughput testing aims to determine how much data can be sent in the system every second. Testing is done by sending the data in the z-axis accelerometer My-RIO heading to PCs that already have Lab-VIEW software by changing the size of the buffer used. From the testing that has been done, the larger the size of the buffer used, the throughput values obtained are also getting bigger. However, in certain circumstances, the throughput will experience saturation despite the enlarged size of the buffer.
Changes the buffer size directly affect the CPU usage on My-RIO. The larger the size of the buffer is used; the CPU usage on My-RIO also will increase. The use of CPU usage that is too large is not expected, because it would burden My-RIO if it will be used for other processes. So the selection of the size of the buffer must be adapted to the complexity of the system to be designed.
Latency was tested using two different data, i.e. data on my-RIO accelerometer sensor and voice data. In testing using the sensor data, the data is sent as many as 1000 iterations by changing the size of the buffer used. From the test results, the size of the buffer does not affect the speed of data transmission process. The value of the latency is always stable with an average value of 13 ms even though the size of the buffer is enlarged.
References
[1] Harper. R, 2003, Inside the Smart Home, Springer-Verlag, London.
[2] Gerhart. J, 1999, Home Automation and Wiring, The McGraw-Hill Companies Inc. [3] Strangio. CE, 1993, Data Communication, A One Page Introduction for Each Important
Featur, CAMI Research Inc., Acton, Massachusetts.
[4] Behrouz A. F. (2007). Data Communication and Networking. USA: McGraw Hill. [5] Keysight, 2014, PLL and Jitter Spectrum Analysis using the 86100C Digital
Communications Analyzer, Keysight Technology, USA.
[6] Suneetha. U etal, 2014, Ethernet Based Remote Monitoring And Control Of Temperature By Using Rabbit Processor, (IJACSA) International Journal of Advanced Computer Science and Applications,Vol. 3, No. 9.
[7] National Instruments. NI, 2013, Using the Right Networking Protocol, http://www.ni.com/white-paper/12079/en/, access on April 15th 2016.
[8] Panoiu. M etal, 2014, Video streaming technologies using ActiveX and LabVIEW, International Conference on Applied Sciences, Vol. 85
[9] National Instruments. NI, 2011, Network Streams Functions,
p-ISSN: 2540-9433; e-ISSN: 2540-9824
[10] National Instruments. NI, 2010, Designing Applications Using Network Streams, http://zone.ni.com/reference/en-XX/help/371361G-01/lvconcepts/usingstreams/, access on April 15th 2016.
[11] National Instruments. NI, 2016, Displays and Data Visualization with CompactRIO: The Ultimate Multipurpose Controller, http://www.ni.com/white-paper/12602/en/ access on April 15th 2016.