Turkish Journal of Fisheries and Aquatic Sciences 13: 819-825 (2013)
www.trjfas.org ISSN 1303-2712 DOI: 10.4194/1303-2712-v13_3_05
© Published by Central Fisheries Research Institute (CFRI) Trabzon, Turkey in cooperation with Japan International Cooperation Agency (JICA), Japan
Partial Replacement of Fish Oil with Vegetable Oils in Diets for European
Seabass (
Dicentrarchus labrax
): Effects On Growth Performance and Fatty
Acids Profile
Introduction
Aquaculture is one of the fastest growing sectors of food industry in the world. It is reported that there has been about 10% growth achieved in aquaculture during the past 10 years to meet the food demand of the ever increasing world population. According to FAO data of 2006, the total aquaculture production reached 140 million tons, 95 million tons of which
came from fishing and 45 million tons from farming (FAO, 2007).
Parallel to the rest of the world, fishery production has demonstrated a rapid growth in Turkey totaling 623,191 tons of production value made in 2009 alone in Turkey, 158,000 tons (25.7%) of which came from farming of fresh, saltwater and brackish water aquatic species. Farmed European sea bass
(Dicentrachus labrax) production values in Turkey
Ilgın Özşahinoğlu1, Tufan Eroldoğan2,*, Pınar Mumoğullarında2, Suat Dikel2, Kenan Engin3, Asuman H.
Yılmaz2, Murat Arslan4, A.Nejdet Sirkecioğlu5
1 Çukurova University, Feke Vocational School, 01330, Adana, Turkey.
2 Çukurova University, Faculty of Fisheries, Department of Aquaculture, 01330, Adana, Turkey.
3 Mersin University, Faculty of Fisheries, Department of Aquaculture, Yenişehir Campus, Mersin, Turkey.
4 Atatürk University, Faculty of Fisheries, Department of Aquaculture, Erzurum, Turkey.
5 Atatürk University, Faculty of Agriculture, Department of Agricultural Biotechnology, Erzurum, Turkey.
* Corresponding Author: Tel.: +90.322 3386084; Fax: +90.322 3386439;
E-mail:[email protected]
Received 12 June 2013 Accepted 17 December 2013
Abstract
The study was conducted to determine the effects of alternative oil sources on growth, body composition and feed conversion of sea bass individuals. The tested oils used in the study were as follows: sesame oil (SO), canola oil (CO) and soybean oil (SBO). All tested oils were included at a 50% substitution level of fish oil and were compared with a control diet containing 100% fish oil (FO). There was no effect of diet on specific growth rate. The highest final weight was seen in fish fed SO and FO diets compared to that of fish fed CO diet and SBO diets (P<0.05). At the end of the experiment, no statistically significant difference was detected determined in whole body fatty acid composition in terms of saturated fatty acids (SFA) and polyunsaturated fatty acids (PUFA) contents (P>0.05). In the n-6 fatty acids, fish fed SBO diet contained significant amount of linoleic acids (LA, 18:2n-6) compared to that of fish other dietary treatments diets . Deposition of eicosapentaenoic acid (EPA, 20:5n-3) and docosahexaenoic acid (DHA, 22:6n-3) was identical among the dietary treatments. In conclusion, the result of the trial show that sesame oil could be used as an alternative to fish oil in European sea bass diet formulation while when fish meal content of the diet is kept relatively high as it was the case our present in this study (585 mg/g)
Keywords: Sea Bass, alternative vegetable oil sources, soybean oil, sesame oil, canola oil.
Balık Yağ Yerine Kısmı Bitkisel Yağların Avrupa Deniz Levreği (Dicentrarchus Labrax) ‘nin Beslenmesine Büyüme Performansı ve Yağ Asitleri Profili Üzerine Etkileri
Özet
Bu çalışma alternatif yağ kaynaklarının; levrek bireylerinde büyüme, vücut kompozisyonu ve yem değerlendirmesi üzerine etkilerini belirlemek üzere yapılmıştır. Denemede kullanılan yağlar susam yağı, kanola yağı ve soya yağı. Denemede kullanılan tüm yağlar, %50’sini balık yağının oluşturduğu diyetlere %50 oranında dahil edilmiştir ve %100 balık yağından oluşan bir diyetle karşılaştırılmıştır. Diyetlerin Spesifik Büyüme oranı üzerinde hiçbir etkisi olmamıştır. Kanola yağı ve soya yağı ile beslenen balıklarla karşılaştırılınca, en yüksek final ağırlığı susam yağı ve balık yağı diyetleriyle beslenen balıklarda görülmüştür (P<0,05). Denemenin sonunda, tüm vücut yağ asit kompozisyonlarına bakıldığında doymuş yağ asitleri ve çoklu doymamış yağ asitleri bakımından istatistiksel açıdan bir fark bulunmamıştır (P>0,05). n-6 yağ asitlerinde, diğer diyetlere oranla soya yağı diyetinin önemli miktarda linoleik asit (LA, 18:2n-6) içerdiği gözlenmiştir.Diyet grupları arasında Eicosapentaenoic acid (EPA, 20:5n-3) ve docosahexaenoic acid (DHA, 22:6n-3)’nın depolandığı belirlenmiştir. Sonuç olarak, Avrupa deniz levreği diyetlerinde balık yağına alternatif, 585 mg/g balık unu içeren susam yağı kullanılabilir.
820
have steadily increased over the last decade reaching 38000 tons in 2008 ranking Turkey first in European production scale (TUIK, 2010). The oil source used in the feed of the cultured aquatic species and especially the fish species increases the growth performance, food and protein conversion rates (Bell et al., 2000; Montero et al., 2005). In the grow-out phase of sea fishes, the oil content and its use are quite important for the growth of fishes. As it is widely known, protein and oils are the most important energy sources in feed of carnivorous salt water fish species. These two important energy sources should be well balanced in all commercial aqua feeds. The recent studies have focused on balancing oil and protein contents in feeds of carnivore species, thus adjusting energy rates of feeds (Marti Palanca et al., 1996; Vergara et al., 1996; Santinha et al., 1996, 1999; Company et al., 1999; Fountoulaki et al., 2005). The most important oil and energy source used in fish feeds is fish oil. Fish oil should be used in feed formula to preserve and balance energy balance of feeds.
There has been an increasing demand for aquaculture products by consumers throughout the world due to different reasons like healthy diet, which has, in turn, increased the production of these products. The rapid increase of aquaculture products in general and fish farming in particular results in increasing demand for fish meal and oil, which are the main contents of feeds used in aquaculture. It is quite important to find cheaper alternative oil sources to fish oil to meet the fatty acid requirements of fishes in aqua feeds for a sustainable and economically sound aqua feed industry thereby reducing ingredient cost and contributing to national economy (Dernekbaşı et al., 2010).
Thus, the aim of the study was to investigate the effects of some vegetable oils (sesame oil, canola oil and soybean oil) included at a 50% substitution levels of fish oil in practical diet formulations for European sea bass.
Materials and Methods
Experimental Diets
Four diets containing equal amount of crude protein, energy and lipid concentration on a dry weight basis were formulated. Anchovy oil was the only added lipid source in fish oil diet (FO). All the other diets contained vegetable oils to substitute half of the fish oil used in the control diet by sesame (SO), canola (CO) and soybean oils (SBO) (Table 1).
Feeding Trial
European sea bass (Dicentrarchus labrax) juveniles used in this study were obtained from a commercial local farm (Akuvatur, Ltd., Adana, Turkey) and were transported to an indoor system where they were kept in fiberglass tanks for a period
of four weeks prior starting of the experiment. 240 European sea bass individuals (45g initial body weight) were distributed randomly among 12 tanks of 500 L (20 fish/tank). These tanks were supplied with sea water (40 g/L) at a flow rate of approximately 2 L min-1. Water parameters such as temperature, salinity,
pH and dissolved oxygen were continuously monitored with YSI model salinometer (Yellow springs Instrument, Yellow springs, OH, USA), oxygenmeter and pH meter (pH 315i Set, WTW Measurement Systems, Germany). Individual fluorescent lighting was provided over each tank and was automatically controlled to provide12-h light/12-h dark (07.00 to 19.00 h) photoperiod. Triplicate groups
of fish were fed one of the four s dietary treatments by hand to apparent satiation three times daily (09.00 h,
13.00 h and 18.00 h) for 90 days and the dietary
treatments were assigned using a randomized block design.
All fish in each group were anaesthetized (2-phenoxyethanol at 0.5 ml/L) and then weighed individually, after removal of excess surface moisture, to the nearest 0.01 g at 10- day intervals during the study. On day 0, 15 fish from a common pool of fish were sampled randomly and stored at -20°C for subsequent chemical analyses. On day 90, 3 fish per tank were randomly culled from each replicate group (tank) for subsequent analyses. Whole body and fillet muscle samples were grounded and homogenized in a blender and the homogenate from each replicate tank was pooled (n=3/diet treatment) and stored at -20°C until analysis. A series of parameters were used to assess the effects of dietary treatments on the growth performance of the fish and were computed by the following equations:
Specific growth rate (SGR) (% body weight/day) = [(ln FW (g) − ln IW (g)) / time (days)] × 100
Feed conversion ratio (FCR) = total daily dry feed intake (g) / WG (g)
Protein efficiency ratio (PER) (g/g) = WG (g) / protein intake (g)
Survival (S) (%) = (number of fish in each group remaining on day 90 / initial number of fish) x 100.
Chemical Analyses
Determinations of moisture, ash, protein, and gross energy concentrations in the diets and fish samples were conducted as described below. Percent moisture samples were dried to constant weight at 103ºC. Ash content was determined by burning the samples at 450ºC for 5 h (AOAC, 1994). Crude protein concentration was determined by the Kjeldahl procedure using a Kjeltec 2200 (Foss Tecator, Högans, Sweden). Percent nitrogen was multiplied by 6.25 to obtain an estimate of percent crude protein in samples.
821
(Czesny and Dabrowski 1998) with some modifications. Briefly, the FAME obtained were separated by gas chromatography (Agilent 6890 N), equipped with a flame ionization detector and fitted with a DB 23 capillary column (60 m, 0.25 mm i.d. and 0.25 µm) ejector and detector temperature program was 190°C for 35 min than increasing at 30°C per min up to 220°C where it was maintained for 5 min. Carrier gas was hydrogen (2 ml min-1 and
split ratio was 30:1). The individual fatty acids were identified by comparing their retention times to that of a standard mix of fatty acids (Supelco 37 component FAME mix). Prior to transmethylation, nonadecanoic acid (C19:0) was added to the samples (0.8 mg per 50 mg of lipid) as the reference standard for the quantification of fatty acids.
Statistical Analysis
Data are reported as mean ± S.E.M (n=3). Percentage values were arcsine square root transformed and after normality and homogeneity of variance were confirmed, one-way variance (ANOVA; sigmastat 3.0, SPSS, Chicago, U.S.A) were used to
determine differences between means. Differences were considered statistically significant at P<0.05.
Results
Mortality was low and unaffected by dietary treatments at the end of 90 days (P>0.05).
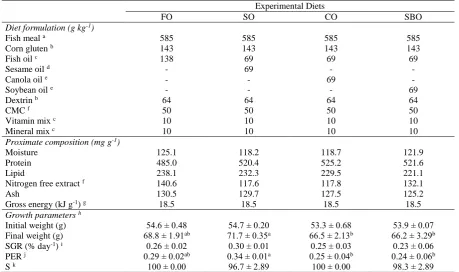
Dietary treatment influenced growth performance of European sea bass in the present study (Table 1). On the final day of the experiment, the highest final weight was found in fish fed SO diet, while the lowest final weight was obtained in fish fed the SBO diet. The values of FO group and CO group were close to each other, while the highest final weight of individuals was observed in fish fed SO diet. The mean weight of SO group was found as 71.70 g at the end of 90 days, which was the highest weight (Table 1). In terms of specific growth rate, there was no statistically significant difference among groups (P>0.05). Specific growth rate changed between 0.23 and 0.30% body weight/day. Considering the feed conversion values obtained in the experiment, there was no significant difference among groups (P>0.05). The mean feed conversion Table 1. Ingredients, proximate composition (mg/g-1) of experimental diets (3 mm) and growth parameters
Experimental Diets
FO SO CO SBO
Diet formulation (g kg-1)
Fish meal a 585 585 585 585
Corn gluten b 143 143 143 143
Fish oil c 138 69 69 69
Sesame oil d - 69 - -
Canola oil e - - 69 -
Soybean oil e - - - 69
Dextrin b 64 64 64 64
CMC f 50 50 50 50
Vitamin mix c 10 10 10 10
Mineral mix c 10 10 10 10
Proximate composition (mg g-1)
Moisture 125.1 118.2 118.7 121.9
Protein 485.0 520.4 525.2 521.6
Lipid 238.1 232.3 229.5 221.1
Nitrogen free extract f 140.6 117.6 117.8 132.1
Ash 130.5 129.7 127.5 125.2
Gross energy (kJ g-1) g 18.5 18.5 18.5 18.5
Growth parameters h
Initial weight (g) 54.6 ± 0.48 54.7 ± 0.20 53.3 ± 0.68 53.9 ± 0.07 Final weight (g) 68.8 ± 1.91ab 71.7 ± 0.35a 66.5 ± 2.13b 66.2 ± 3.29b
SGR (% day-1) i 0.26 ± 0.02 0.30 ± 0.01 0.25 ± 0.03 0.23 ± 0.06
PER j 0.29 ± 0.02ab 0.34 ± 0.01a 0.25 ± 0.04b 0.24 ± 0.06b
S k 100 ± 0.00 96.7 ± 2.89 100 ± 0.00 98.3 ± 2.89
Values in the same row with different superscripts are significantly different (P<0.05) as determined by ANOVA. Values are means ± S.E.M. (n=3)
a Supplied by Agromarine A.Ş., İzmir, Turkey. b Supplied by Sunar Mısır A.Ş., Adana, Turkey. c Supplied by Kılıç Deniz ürünleri üretim A.Ş. d Supplied by Yeni Uğur A.Ş, Adana, Turkey. e Supplied by Bizim yağ, Migros A.Ş., Adana, Turkey. f Nitrogen free extract: 100-(protein+lipid+ash).
g Calculated based on the standard physiological fuel values: 19 kJ g-1 for protein, 36 kJ g-1 for lipid and 15 kJ g-1 for carbohydrate h Values are mean ± SEM. (n = 3; number of thanks per treatment).
I Specific Growth Rate (SGR): [Ln(final weight) - Ln(initial weight)]/(number of days)/100. j Protein efficiency ratio (PER) (g/g) = WG (g)/protein intake (g).
822
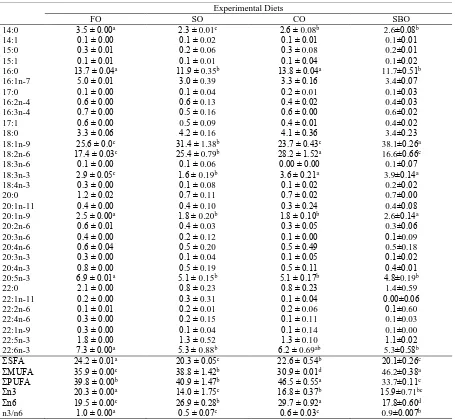
rate of groups was determined as 3.48±0.89., There was no significant difference in the daily feed intake values obtained in the dietary treatments throughout the study (P>0.05). The fish fed on FO diet consumed 15.44 g/day on average, while the mean feed consumptions of fish fed SO diet and CO diet were 16.44 g/day and 16.01 g/day, respectively. There was a statistically significant difference among groups in terms of protein efficiency ratio (PER) (P<0.05). Accordingly, the highest PER was observed in fish fed SO diet (0.34±0.01), while the lowest protein efficiency was determined in fish fed SBO diet (0.23±0.06) compared to fish fed all the other diets. Proximate composition of the experimental diets is reported in Table 2. There was a statistically significant difference among groups in terms of MUFA and HUFA (P<0.05). The level of MUFA was highest in experimental diets SBO diet. On the other hand, the level of PUFA was highest in experimental
diets SO diet.
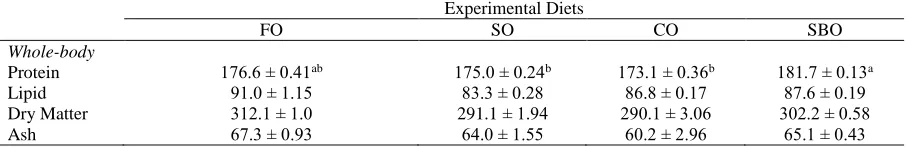
Proximate composition of whole body is reported in Table 3. The fish fed SBO diet and FO diet (181.7±0.13 mg/g and 176.6±0.41 mg/g, respectively) had the highest whole body protein content across the 90 day experimentation period. Lipid content of the whole body varied between 86.8 mg/g and 91.0 mg/g and was unaffected by dietary treatments. There were no significant differences observed between dietary treatments for dry matter and ash content in fish fed the experimental diets (P>0.05).
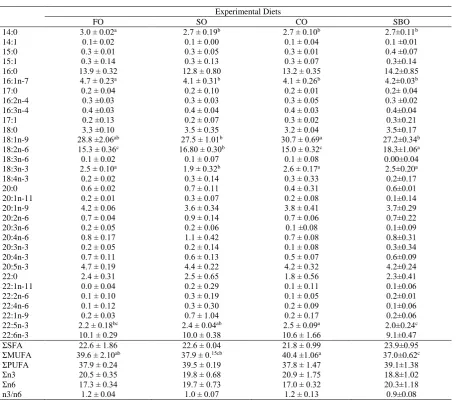
The fatty acid compositions of whole body total lipid of European sea bass, following 90 days of feeding the experimental diets are shown in Table 4. As it would be expected, the fatty acid composition of the diet was mirrored in whole body of fish. The level of LA was highest in fish fed SBO diet and lowest in fish fed FO diet (15.3%) and CO diet (18.3%). On the
Table 2. Percent fatty acid composition (g/100g fatty acids) of the experimental diets of European sea bass
Experimental Diets
FO SO CO SBO
14:0 3.5 ± 0.00a 2.3 ± 0.01c 2.6 ± 0.08b 2.6±0.08b
14:1 0.1 ± 0.00 0.1 ± 0.02 0.1 ± 0.01 0.1±0.01
15:0 0.3 ± 0.01 0.2 ± 0.06 0.3 ± 0.08 0.2±0.01
15:1 0.1 ± 0.01 0.1 ± 0.01 0.1 ± 0.04 0.1±0.02
16:0 13.7 ± 0.04a 11.9 ± 0.35b 13.8 ± 0.04a 11.7±0.51b
16:1n-7 5.0 ± 0.01 3.0 ± 0.39 3.3 ± 0.16 3.4±0.07
17:0 0.1 ± 0.00 0.1 ± 0.04 0.2 ± 0.01 0.1±0.03
16:2n-4 0.6 ± 0.00 0.6 ± 0.13 0.4 ± 0.02 0.4±0.03
16:3n-4 0.7 ± 0.00 0.5 ± 0.16 0.6 ± 0.00 0.6±0.02
17:1 0.6 ± 0.00 0.5 ± 0.09 0.4 ± 0.01 0.4±0.02
18:0 3.3 ± 0.06 4.2 ± 0.16 4.1 ± 0.36 3.4±0.23
18:1n-9 25.6 ± 0.0c 31.4 ± 1.38b 23.7 ± 0.43c 38.1±0.26a
18:2n-6 17.4 ± 0.03c 25.4 ± 0.79b 28.2 ± 1.52a 16.6±0.66c
18:3n-6 0.1 ± 0.00 0.1 ± 0.06 0.00 ± 0.00 0.1±0.07
18:3n-3 2.9 ± 0.05c 1.6 ± 0.19b 3.6 ± 0.21a 3.9±0.14a
18:4n-3 0.3 ± 0.00 0.1 ± 0.08 0.1 ± 0.02 0.2±0.02
20:0 1.2 ± 0.02 0.7 ± 0.11 0.7 ± 0.02 0.7±0.00
20:1n-11 0.4 ± 0.00 0.4 ± 0.10 0.3 ± 0.24 0.4±0.08
20:1n-9 2.5 ± 0.00a 1.8 ± 0.20b 1.8 ± 0.10b 2.6±0.14a
20:2n-6 0.6 ± 0.01 0.4 ± 0.03 0.3 ± 0.05 0.3±0.06
20:3n-6 0.4 ± 0.00 0.2 ± 0.12 0.1 ± 0.00 0.1±0.09
20:4n-6 0.6 ± 0.04 0.5 ± 0.20 0.5 ± 0.49 0.5±0.18
20:3n-3 0.3 ± 0.00 0.1 ± 0.04 0.1 ± 0.05 0.1±0.02
20:4n-3 0.8 ± 0.00 0.5 ± 0.19 0.5 ± 0.11 0.4±0.01
20:5n-3 6.9 ± 0.01a 5.1 ± 0.15b 5.1 ± 0.17b 4.8±0.19b
22:0 2.1 ± 0.00 0.8 ± 0.23 0.8 ± 0.23 1.4±0.59
22:1n-11 0.2 ± 0.00 0.3 ± 0.31 0.1 ± 0.04 0.00±0.06
22:2n-6 0.1 ± 0.01 0.2 ± 0.01 0.2 ± 0.06 0.1±0.60
22:4n-6 0.3 ± 0.00 0.2 ± 0.15 0.1 ± 0.11 0.1±0.03
22:1n-9 0.3 ± 0.00 0.1 ± 0.04 0.1 ± 0.14 0.1±0.00
22:5n-3 1.8 ± 0.00 1.3 ± 0.52 1.3 ± 0.10 1.1±0.02
22:6n-3 7.3 ± 0.00a 5.3 ± 0.88b 6.2 ± 0.69ab 5.3±0.58b
ΣSFA 24.2 ± 0.01a 20.3 ± 0.05c 22.6 ± 0.54b 20.1±0.26c
ΣMUFA 35.9 ± 0.00c 38.8 ± 1.42b 30.9 ± 0.01d 46.2±0.38a
ΣPUFA 39.8 ± 0.00b 40.9 ± 1.47b 46.5 ± 0.55a 33.7±0.11c
Σn3 20.3 ± 0.00a 14.0 ± 1.75c 16.8 ± 0.37b 15.9±0.71bc
Σn6 19.5 ± 0.00c 26.9 ± 0.28b 29.7 ± 0.92a 17.8±0.60d
n3/n6 1.0 ± 0.00a 0.5 ± 0.07c 0.6 ± 0.03c 0.9±0.007b
1 Values in the same row with different superscripts are significantly different (P< 0.05) as determined by ANOVA. Data for each parameter
823
other hand, fish fed CO diet (1.9%) had significantly higher linolenic acid than the other treatments. The whole body percentages of oleic acid (18:1n-9) were highest in fish fed CO diet. Total monounsaturated fatty acid content significantly higher in fish fed CO diet (P<0.05). In addition, there was no difference among groups considering arachidonic acid (20:4n-6) content. Whole body EPA, DHA, PUFA, total n-3 and total saturated fatty acids content was not different between dietary treatments. The saturated fatty acid level in whole body ranged from 21.8% and 23.9% and there was no significant affect of the dietary treatment. No statistical differences were observed in polyunsaturated fatty acids in whole body different between treatments, with values ranging between 37.8±1.47% (CO) and 39.5% (SO).
Discussion
Most of the recent studies conducted on feeding of carnivore fish species have focused on the effects of vegetable oils as alternatives to fish oil, one of the basic raw nutrient material in aqua feeds, on growth performance and whole body and tissue fatty acid composition of fishes. It is known that oils used as energy sources in fish diets have effects on growth, survival rate and body composition (Yıldız and Şener, 2004; Almaida and Pagan, 2007). In this study, no significant difference was detected considering specific fish growth rates whereas final weight of the fish fed SO and FO diet was higher than that of the fish fed on other diets. A number of recent studies on the marine species have reported growth retardation when dietary oil was replaced with different plant oils (Izquierdo et al., 2003; Yıldız and Şener, 2004;
Figuerede-Silva et al.,2005; Izquierdo et al., 2005; Eroldoğan et al., 2012; Eroldoğan et al., 2013). In a study with two marine species seabream (Sparus
aurata) and sharpsnout seabream (Diplodus
puntazzo), Hernandez et al. (2007) used linseed oil
and soybean oil as alternative oil sources. These authors found that the best results growth parameters and least nutrient composition change in whole body and tissue were observed in fish fed FO diet. In the present study, FO treatment demonstrated a better growth performance than fish fed SBO diet. In contrast to the results of the present and other studies, the growth and feed utilization of the fish were unaffected by use of the vegetable oils in some previously conducted studies but significant changes
in muscle fatty acid composition were reported in the European sea bass (Figuerede-Silva et al., 2005). Hung et al. (2007) also examined the use of canola oil as a replacement in diets fed to red coral (Pagrus
major). These authors found that the sources of lipid
used did not affect the weight gain, feed intake, feed conversion and survival of the fish, but tissue fatty acid composition largely reflected that of the diets. Therefore, the results obtained in the present study were supported by previous studies showing that replacing high levels of fish oil affected growth and fatty acid composition of the fish. Importantly, the level of the fish meal and fish oil in the present study was 60 and 50% on a dry matter basis in diets, respectively. Thus, all experimental diets contained some n-3 LC-PUFA, which could help explain the lack of any major detrimental effect on fish growth. This is in accordance with data reported in previous studies conducted in the same species (Eroldoğan et al., 2012; 2013).
In general, dietary fatty acid composition is mirrored by the fish’s organs and lipid stores (Bell et al., 2001; Izquierdo et al., 2003; Yıldız and Şener,
2004; Eroldoğan et al., 2012)
In the present study, the fish fed on SBO diet were found to have the highest value of whole body monounsaturated saturated fatty acids due to high concentration of oleic acid in soybean oil. However, SFA level was found to be similar in all dietary treatments. The highest SFA was determined in fish fed FO and CO diets. In all dietary treatments, LA content was found lowest in fish fed FO diet, while the highest were observed in fish fed SBO diet. Similar to our study, Skalli and Robin (2004) reported that sea bass fed on diets containing n-3 highly unsaturated fatty acids (n-3 HUFA level in the diet up to 1.9%) had higher LA levels in their body than the fish fed control diet containing 100% cod liver oil. Similar to our study and latter study, Bell et al. (2001) also reported that increasing LA content of Atlantic salmon (Salmo salar) correlated with canola oil inclusion in the diet. The concentration of LA and linolenic acid increased with canola oil in the diet whereas EPA and DHA levels relatively decreased with increasing canola oil the experimental diet formulated for red coral (Satoh et al., 2007). Interestingly, in the present study, there was no statistically significant difference among groups considering EPA content of fish whole body. Generally, even though European sea bass uses 18-carbon fatty acids and turns it into EPA and DHA
Table 3. The proximate composition (mg/g) of whole body of sea bass fed the four experimental diets over a 90 days period
Experimental Diets
FO SO CO SBO
Whole-body
Protein 176.6 ± 0.41ab 175.0 ± 0.24b 173.1 ± 0.36b 181.7 ± 0.13a
Lipid 91.0 ± 1.15 83.3 ± 0.28 86.8 ± 0.17 87.6 ± 0.19
Dry Matter 312.1 ± 1.0 291.1 ± 1.94 290.1 ± 3.06 302.2 ± 0.58
824
limitedly, Eroldoğan et al. (2013) noted that deposition of the DHA were significantly high in the fish fed canola diet. The remarkable higher deposition rates of the some LC-PUFA compared to other fatty acids is also in accordance with previous result on European sea bass (Mourente and Bell, 2006; Eroldoğan et al., 2012; Eroldoğan et al., 2013). Reports on DHA deposition in marine species have been contradictory, showing both significant increase (Mourente and Bell, 2006; Eroldoğan et al., 2012; Eroldoğan et al., 2013) and decrease (Sparus aurata, Fountulaki et al., 2009; Diplodus puntazzo, Piedecausa et al., 2007). This is probably due to the fact that interaction between fatty acids from different oil sources is complex and tissues (liver and flesh) do not necessarily assimilate or catabolize fatty acids from different oil sources in the same way.
In conclusion, the present study has demonstrated that the effects of dietary vegetable oil inclusion on fatty acid profile, which generally reflected the profile of the diets used. In particular,
sesame oil is an effective substitute for fish oil in European sea bass as long as the fish-meal based diet contains a relatively large amount of fish meal.
Acknowledgments
This study was supported the Resource Fund of the University of Cukurova, (Turkey) for their financial support (with SÜF 2009 YL11).
References
Almaida-Pagan, P.F., Hernandez, M.D., Garciagarcia, B., Madrid, J.A., De Costa, J. and Mendiola, P. 2007. Effects of total replacement of fish oil by vegetable oils on n-3 and n-6 polyunsaturated fatty acid desaturation and elongation in sharpsnout seabream
(Diplodus puntazzo) hepatocytes and enterocytes.
Aquaculture, 272: 589-598. doi:10.1016/j.aquaculture.2007.08.017
AOAC, 1994. Official Methods of Analysis. 16th Edn. Vol.
1. Association of Official Analytical Chemists Table 4. Percent fatty acid composition (g/100g fatty acids) of the whole body of sea bass fed the experimental diets
Experimental Diets
FO SO CO SBO
14:0 3.0 ± 0.02a 2.7 ± 0.19b 2.7 ± 0.10b 2.7±0.11b
14:1 0.1± 0.02 0.1 ± 0.00 0.1 ± 0.04 0.1 ±0.01
15:0 0.3 ± 0.01 0.3 ± 0.05 0.3 ± 0.01 0.4 ±0.07
15:1 0.3 ± 0.14 0.3 ± 0.13 0.3 ± 0.07 0.3±0.14
16:0 13.9 ± 0.32 12.8 ± 0.80 13.2 ± 0.35 14.2±0.85
16:1n-7 4.7 ± 0.23a 4.1 ± 0.31b 4.1 ± 0.26b
4.2±0.03b
17:0 0.2 ± 0.04 0.2 ± 0.10 0.2 ± 0.01 0.2± 0.04
16:2n-4 0.3 ±0.03 0.3 ± 0.03 0.3 ± 0.05 0.3 ±0.02
16:3n-4 0.4 ±0.03 0.4 ± 0.04 0.4 ± 0.03 0.4±0.04
17:1 0.2 ±0.13 0.2 ± 0.07 0.3 ± 0.02 0.3±0.21
18:0 3.3 ±0.10 3.5 ± 0.35 3.2 ± 0.04 3.5±0.17
18:1n-9 28.8 ±2.06ab 27.5 ± 1.01b 30.7 ± 0.69a
27.2±0.34b
18:2n-6 15.3 ± 0.36c 16.80 ± 0.30b 15.0 ± 0.32c 18.3±1.06a
18:3n-6 0.1 ± 0.02 0.1 ± 0.07 0.1 ± 0.08 0.00±0.04
18:3n-3 2.5 ± 0.10a 1.9 ± 0.32b 2.6 ± 0.17a 2.5±0.20a
18:4n-3 0.2 ± 0.02 0.3 ± 0.14 0.3 ± 0.33 0.2±0.17
20:0 0.6 ± 0.02 0.7 ± 0.11 0.4 ± 0.31 0.6±0.01
20:1n-11 0.2 ± 0.01 0.3 ± 0.07 0.2 ± 0.08 0.1±0.14
20:1n-9 4.2 ± 0.06 3.6 ± 0.34 3.8 ± 0.41 3.7±0.29
20:2n-6 0.7 ± 0.04 0.9 ± 0.14 0.7 ± 0.06 0.7±0.22
20:3n-6 0.2 ± 0.05 0.2 ± 0.06 0.1 ±0.08 0.1±0.09
20:4n-6 0.8 ± 0.17 1.1 ± 0.42 0.7 ± 0.08 0.8±0.31
20:3n-3 0.2 ± 0.05 0.2 ± 0.14 0.1 ± 0.08 0.3±0.34
20:4n-3 0.7 ± 0.11 0.6 ± 0.13 0.5 ± 0.07 0.6±0.09
20:5n-3 4.7 ± 0.19 4.4 ± 0.22 4.2 ± 0.32 4.2±0.24
22:0 2.4 ± 0.31 2.5 ± 0.65 1.8 ± 0.56 2.3±0.41
22:1n-11 0.0 ± 0.04 0.2 ± 0.29 0.1 ± 0.11 0.1±0.06
22:2n-6 0.1 ± 0.10 0.3 ± 0.19 0.1 ± 0.05 0.2±0.01
22:4n-6 0.1 ± 0.12 0.3 ± 0.30 0.2 ± 0.09 0.1±0.06
22:1n-9 0.2 ± 0.03 0.7 ± 1.04 0.2 ± 0.17 0.2±0.06
22:5n-3 2.2 ± 0.18bc 2.4 ± 0.04ab 2.5 ± 0.09a 2.0±0.24c
22:6n-3 10.1 ± 0.29 10.0 ± 0.38 10.6 ± 1.66 9.1±0.47
ΣSFA 22.6 ± 1.86 22.6 ± 0.04 21.8 ± 0.99 23.9±0.95
ΣMUFA 39.6 ± 2.10ab 37.9 ± 0.15cb 40.4 ±1.06a 37.0±0.62c
ΣPUFA 37.9 ± 0.24 39.5 ± 0.19 37.8 ± 1.47 39.1±1.38
Σn3 20.5 ± 0.35 19.8 ± 0.68 20.9 ± 1.75 18.8±1.02
Σn6 17.3 ± 0.34 19.7 ± 0.73 17.0 ± 0.32 20.3±1.18
n3/n6 1.2 ± 0.04 1.0 ± 0.07 1.2 ± 0.13 0.9±0.08
1 Values in the same row with different superscripts are significantly different (P< 0.05) as determined by ANOVA. Data for each parameter
825
(AOAC). Arlington. MA.
Bell, J.G., McEvoy, J., Tocher, D.R., McGhee, F., Campbell, P.J. and Sargent, J.R. 2001. Replacement of fish oil with rapeseed oil in diets of Atlantic salmon
(Salmo salar) affects tissue lipid compositions and
hepatocyte fatty acid metabolism. Journal of Nutrition, 131: 1535-1543. doi: 0022-3166/01 Czesny, S. and Dabrowski, K. 1998. The effect of fatty
acids concentration in wild and domesticated walleye Stizostedion Íitreum eggs on embryos viability. Aquat. Living Resour., 11: 371-378. doi:10.1016/S0990-7440(99)80002-3
Company, R., Calduch-Giner, J.A., Perez-Sanchez, J., Kaushik, S. 1999. Protein sparing effect of dietary in common dentex (Dentex dentex): a comparative study with sea bream (Sparus aurata) and sea bass
(Dicentrarchus labrax). Aquat. Living Resour., 12:
23-30. doi: 10.1016/S0990-7440(99)80011-4
Dernekbaşi, S. and Karayücel, İ. 2010. Use of canola oil in fish feeds. Journal of Fisheries Science.com, 4: 469-479. doi: 10.3153/jfscom.2010051
Eroldoğan, O.T., Turchini, G.M., Yılmaz, H.A., Taşbozan, O., Engin, K., Ölçülü, A., Özşahinoğlu, I. and Mumoğullarında, P. 2012. Potential of cottonseed oil as fish oil replacer in european sea bass feed formulation, Turkish Journal of Fisheries and Aquatic Sciences, 12: 787-797. doi: 10.4194/1303-2712-v12_4_07
Eroldoğan, O.T., Yılmaz, H.A., Turchini, G.M., Arslan, M., Sirkecioğlu, A.N., Engin, K., Özşahinoğlu, I. and Mumoğullarında, P. 2013. Fatty acid metabolism in European sea bass (Dicentrarchus labrax): effects of n-6 PUFA and MUFA in fish oil replaced diets. Fish Physiology and Biochemistry, 39: 941-955. doi: 10.1007/s10695-012-9753-7
FAO, 2007. Fishery Statistical Collections. Fishery Information Data and Statistics Unit (FIDI) - FIGIS Data Collection. FAO, Rome.
Figueiredo-Silva, A., Rocha, E., Dias, J., Silva, P., Rema, P., Gomes, E. and Valente, L.M.P. 2005. Partial replacement of fish oil by soybean oil on lipid distribution and liver histology in European sea bass
(Dicentrarchus labrax) and rainbow trout
(Oncorhynchus mykiss) juveniles. Aquaculture
Nutrition, 11: 147-155. doi: 10.1111/j.1365-2095.2004.00337.x
Folch, J., Lees, M. and Stanley, G.H.S. 1957. A simple method for the isolation and purification of total lipids from animal tissues. J. Biol. Chem, 497-509.
Fountoulaki, E., Vasilaki, A., Hurtado, R., Grigorakis, K., Karacostas, I., Nengas, I., Rigos, G., Kotzamanis, Y., Venou, B., and Alexis, M.N. 2009. Fish oil substitution by vegetable oils in commercial diets for gilthead sea bream (Sparus aurata L.); effects on growth performance, flesh quality and fillet fatty acid profile: Recovery of fatty acid profiles by a fish oil finishing diet under fluctuating water temperatures. Aquaculture, 289(3-4): 317-326. doi:10.1016/j.aquaculture
Huang, S.S.Y., Oo, A.N., Higgs, D.A. and Brauner, C.J. 2007. Effect of dietary canola oil level on the growth performance and fatty acid composition of juvenile red sea bream (Pagrus major). Aquaculture, 271: 420-431. doi.10.1016/j.aquaculture
Izquierdo, M.S., Obach, A., Arantzamendi L., Montero, D., Robaina, L. Rosenlund, G. 2003. Dietary lipid sources for seabream and seabass: Growth performance, tissue
composition and flesh quality. Aquac Nutr, 9: 397-407. doi: 10.1046/j.1365-2095.2003.00270.x
Izquierdo, M.S., Montero, D., Robaina, L., Caballero, M.J., Rosenlund, G. and Gines, R. 2005. Alterations in filet fatty acid profile and flesh quality in gilthead seabream (Sparus aurata) fed vegetable oils for a long term period. Recovery of fatty acid profiles by fish oil feeding. Aquaculture, 250: 431-444. doi:10.1016/j.aquaculture.2004.12.001
Marti-Palanca, H., Martinez-Barbera, J.P., Pendon, C., Valdivia, M.M., Pérez-Sanchez, J. and Kaushik, S. 1996. Growth hormone as a function of age and dietary protein:energy ratio in a marine teleost, the gilthead sea bream (Sparus aurata). Growth Regul., 6: 253-259.
Metcalfe, L.D. and Schmitz, A.A. 1961. The rapid preparation of fatty acid esters for gas chromatographic analysis. Anal. Chem, 33: 363-364. doi: 10.1021/ac60171a016
Montero, D., Robaina, L., Caballero, M.J., Gines, R. and Izquierdo, M.S. 2005. Growth, feed utilization and flesh quality of European sea bass (Dicentrarchus
labrax) fed diets containing vegetable oils: A
time-course study on the effect of are-feeding period with a 100% fish oil diet. Aquaculture, 248: 121-134. doi: 10.1016/j.aquaculture.2005.03.003
Mourente, G. and Bell, J. 2006. Partial replacement of dietary fish oil with blends of vegetable oils (rapeseed, linseed and palm oils) in diets for European sea bass (Dicentrarchus labrax L.) over a long term growth study: effects on muscle and liver fatty acid composition and effectiveness of a fish oil finishing diet. Comp Biochem Physiol, 145: 389-399. doi: 10.1016/j.cbpb.2006.08.012
Piedecausa, M.A., Mazon, M.J., Garcia, B.G. and Hernandez, M.D. 2007. Effects of total replacement of fish oil by vegetable oils in the diets of sharpsnout seabream (Diplodus puntazzo). Aquaculture, 263: 211-219. doi: 10.1016/j.aquaculture.2006.09.039 Richard, N., Mourente, G., Kaushik, S. and Corraze, G.
2006. Replacement of a large portion of fish oil by vegetable oils does not affect lipogenesis, lipid transport and tissue lipid uptake in European seabass
(Dicentrarchus labrax L.). Aquaculture, 261:
1077-1087. doi: 10.1016/j.aquaculture.2006.07.021 Santinha, P.J.M., Gomes, E.F.S. and Coimbra, J.O. 1996.
Effects of protein level of the diet on digestibility and growth of gilthead seabream (Sparus aurata L.). Aquacult. Nutr, 2: 81-87. doi: 10.1046/j.1365-2095.1999.00107.x
Skalli, A. and Robin, J.H. 2004. Requirement of n-3 long chain polyunsaturated fatty acids for European sea bass (Dicentrarchus labrax) juveniles: growth and fatty acid composition. Aquaculture, 240: 399-415. doi: 10.1016/j.aquaculture.2004.06.036
TUIK (Turkish Statistics Institute), 2010. Su Ürünleri İstatistikleri. http://www.tuik.gov.tr/PreHaber Bültenleri. do?id=6284.
Vergara, J.M., Robina, L., Izquierdo, M.S. and Dela Higuera, M. 1996. Protein sparing effect of lipids in diets for fingerlings of gilthead seabream. Fish sci, 62: 624-628.