Volume -2, Issue-5, September - October 2016, Page No. 56 - 61
Pag
e
56
ISSN: 2455 - 1597
Correlation and Path Coefficient Analysis Studies in OAT (AVENA SATIVA L.)
Parbhat kumar1, Dalbir Singh Phogat2, Pummy Kumari3
Forage Section, Department of Genetics and Plant Breeding,
CCS Haryana Agricultural University, Hisar-125004
E-Mail Id: [email protected]
Abstract
Fifty genotypes of oat were evaluated to study the character association and path coefficient during rabi 2014-15. The
correlation studies revealed positive and significant correlations of seed yield/plant with 100-seed weight, number of
spikelets/panicle and number of tillers/plant. Strong association of these traits revealed that the selection based on these
traits would ultimately improve seed yield and it is also suggested that hybridization of genotypes possessing combination
of above characters is most useful for obtaining desirable high yielding genotypes. Path coefficient analysis revealed that
100 seed weight, number of spikelets/panicle, number of tillers/plant, plant height, flag leaf length, internode length, axis
length and days to maturity had positive and direct effects on seed yield/plant, while the characters viz., days to 50%
flowering and peduncle length showed direct negative effects. The results revealed that the traits like, 100-seed weight,
number of spikelets/panicle and number of tillers/plant should be given due consideration while performing selection for
seed yield in segregating generations of OAT.
Keywords: Correlation, Avena sativa, path analysis, seed yield.
1. Introduction
OAT (Avena sativa L.) is widely cultivated for use as food, feed and fodder. The crop has been adopted well by the
farmers because of its multicut nature and high yield of nutritious and palatable fodder. Among fodder crops grown in
rabi, oat possesses relatively more dry matter content, 7 to 10% protein, resistance to diseases and is specially suited for
silage. It also gives highest green fodder yield per unit area per unit time with minimum irrigation. Seed yield is a complex
trait and is influenced by several component characters. It is also very difficult to improve yield by directly selecting for
seed yield/plant. Therefore, it was felt that it would be of great help in selecting the desirable genotypes for yield if there
is certain association of seed yield with certain easily measurable plant characters. Correlation between different
characters could arise due to linkage or pleiotropy. Correlation due to linkage can be manipulated or changed through
recombination but it would be impossible to overcome the correlation due to pleiotropy. In the later case, genetic
improvement in one trait is not eventually possible without bringing a change in the associated component characters.
Path coefficient analysis provides more realistic picture of the relationship among the characters. The path coefficient
analysis reveals whether the association of each individual character with yield is due to its direct effect on yield or is a
consequence of indirect effects via other component characters. Thus, path coefficient is essential to know the
effectiveness of selection for simultaneous improvement in these characters. Looking into all these aspects an attempt was
Pag
e
57
Pag
e
57
Pag
e
57
Pag
e
57
Pag
e
57
Pag
e
57
Pag
e
57
Pag
e
57
Pag
e
57
Pag
e
57
Pag
e
57
Pag
e
57
Pag
e
57
Pag
e
57
Pag
e
57
Pag
e
57
Pag
e
57
Pag
e
57
Pag
e
57
Pag
e
57
Pag
e
57
2. Material And Methods
The field experiment was conducted on 50 genotypes of Oat at Forage Research Area and Seed Science & Technology
Section laboratory of the Department of Genetics & Plant Breeding, CCS, Haryana Agricultural University, Hisar during
Rabi-2014-15.All the genotypes were grown in Randomized Block Design (RBD) with three replications each genotype
having single row of three metre length with 15 cm plant to plant distance and 45 cm row to row spacing. All the
recommended package of practices were adopted to raise a good crop. Observations were recorded on five randomly
selected plants from each entry on Plant height at maturity (cm), Peduncle length (cm), Stem internode length (cm), Axis
length (cm), Flag leaf length (cm), Tillers per plant (number), Spikelets (number), Seed yield/plant (g), 100 seed weight
(g), Days to 50% flowering and Days to maturity. Seed quality parameters viz., Standard germination test (%), Shoot
length (cm), Root length (cm) , Seedling length (cm) and Seedling dry weight (g) were estimated as per ISTA, 2004 while
Seed Vigour indices were calculated according to the method suggested by Baki and Anderson (1970). The correlation
coefficient at phenotypic and genotypic level was calculated from the variance and covariance according to Johnson et al.
(1955). Direct and indirect effect of various contributing traits towards green fodder yield and dry matter yield was
calculated using the path coefficients analysis (Dewey and Lu, 1959).
3. Results And Discussion
Correlation coefficient
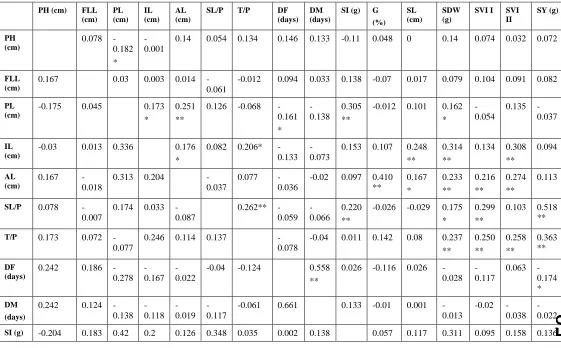
The correlation coefficients at genotypic level have shown higher magnitude than their corresponding correlation
coefficients at phenotypic level thereby, revealing a good amount of strong inherent association between different
attributes (Table 1). Seed yield/plant exhibited positive correlation with number of tillers/plant (0.374), number of
spikelets/panicle (0.58) and 100 seed weight (0.183) and negative correlation with days to 50% flowering (-0.247) and
days to maturity (-0.046) . Similar results for one or more characters were reported by many researchers, Krishna Pal et al.
(1992), Babber et al. (1998), Ahmed et al. (2013), Vaisi et al. (2013) and Krishna et al. (2014). These results indicated that
number of spikelets/panicle, number of tillers/plant and 100 seed weight are the major yield contributing traits to be given
more selection pressure for improving yield.
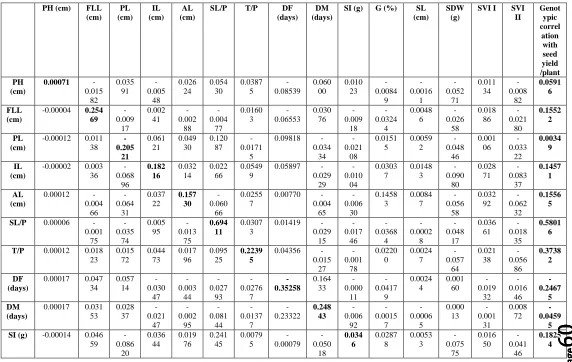
Path coefficient analysis for direct and indirect effects on seed yield/ plant
Path coefficient analysis was done on the basis of genotypic correlation coefficients in which diagonal values are direct
effects and off-diagonal values are indirect effects (Table-2), indicates that spiklets/panicle had the highest direct and
positive effect (0.69411) on seed yield/plant, followed by germination (0.28919), flag leaf length (0.25469), days to
maturity (0.24843), number of tillers/plant (0.22395), internode length (0.18216), axis length (0.1573), seed vigour index I
(0.12658), seedling length (0.04085), 100 seed weight (0.0346) and plant height (0.00071). The direct negative effects
were observed for days to 50% flowering (-0.35258), seedling dry weight (-0.21881), peduncle length (-0.20521) and seed
vigour index II (-0.19452). Similar results for one or more characters were reported by Solanki et al. (1973), Murtza et al.
(1979), Acar-z et al. (1994), Choubey et al. (2001), Vaisi et al. (2013) and Krishna et al. (2014).The residual effect
(0.2707) indicated that the component characters under study were responsible for about 73% of variability in seed
yield/plant. Partitioning of genotypic correlation between seed yield per plant and its component characters revealed that
Pag
e
58
Pag
e
58
Pag
e
58
Pag
e
58
Pag
e
58
Pag
e
58
Pag
e
58
Pag
e
58
Pag
e
58
Pag
e
58
Pag
e
58
Pag
e
58
Pag
e
58
Pag
e
58
Pag
e
58
Pag
e
58
Pag
e
58
Pag
e
58
Pag
e
58
Pag
e
58
Pag
e
58
Selection for higher number of spiklets/panicle, germination, flag leaf length, days to maturity, number of tillers/plant,
internode length, axis length, seed vigour index I, seedling length, 100 seed weight and plant height will be significant for
the improvement of seed yield while progess in breeding for enhanced seed yield may adversely be affected by selection
for traits like days to 50% flowering, seedling dry weight, peduncle length and seed vigour index II due to negative
association of these traits with seed yield. The results, thus, observed in the present study would provide some guidelines
in the selection of parents and in the prediction of possible merits for genetic recombination and would also be of value in
formulating model plant type for selection in segregating generations.
4. References
[1]. Abbott L.A., Pistrole S. M., Filippini O.S., 2007. Path coefficient analysis for seed yield in Bromus catharticus.
Ciencia e Investigación Agraria, 34 (2), 107-114.
[2]. Acar-Z. 1994. Relations between hay yield and yield components by correlation and path analysis methods in oats.
Anadolu. 4(2):55-69.
[3]. Ahmad, M., Zaffar, G., Mir, S.D., Dar, Z.A., Dar, S.H., Iqbal, S., Bukhari, S.A., Khan, G.H. and Gazal A., (2013)
Estimation of correlation coefficient on oats (Avena sativa L.) for forage yield, grain yield and their contributing traits.
Internat. J. Plant Breed. Res.7(3):188-191.
[4]. Babbar, A., Rao, S.K. and Agrwal, S.B. 1997. Relationship of parental diversity and heterosis for yield in Oats. Adv.
Agric. Res. India. 7: 29-38.
[5]. Burton, G.W. and E.W. de Vane 1953. Estimating heritability in tall fescue (Fistuea arundincea) from replicated
clonal material. Agron. J. 45:178-181.
[6]. Choubey, R.N., Prasad, S.V.S., Roy, A.K. 2001. Study on variability association and path analysis in forage oat.
Forage Manage. Agrofores. 22(2):188-192.
[7]. Dewey, D.R. and Lu, K.H.1959. A correlation and path coefficient analysis of components of crested wheat
grass seed production. Agron. J., 51 (9): 515-518.
[8]. ISTA. 2004. International rules for seed testing. Seed Sci. and Technol. 27:1-334. Falconer, D.S. 1981. An
Introduction to Quantitative Genetics, 2nd edition. Longman. New York.
[9]. Johnson, H.W., Robinson, H.F. and Comstock, F. 1955. Genotypic and phenotypic correlation in soybean and
their implications in selection. Agron. J. 47: 477-483.
[10]. Kumar K.B. and Vivekananda P 2009. Correlation and Path analysis for seed yield in sesame (Sesamum indicum L.)
Elect. J. Plant Breed. 1:70-73.
[11]. Kapoor, R., Bajaj R.K., Sidhu Navjot and Kaur Simarjit 2011. Correlation and Path coefficient analysis in oat
(Avena sativa L.). Internat. J. Plant breed. 5(2):133-136.
[12]. Krishan, P., Mishra, S.N. and Pal, K. 1992. Genetic variability and correlation coefficients relating to grain yield and
other quantitative characters in oats (Avena sativa L.). Adv. Plant Sci. 5(1):6-11.
[13]. Krishna, A., Ahmed, S., Pandey, H.C and Kumar, V. 2014. Correlation, path and diversity analysis of oat (Avena
Pag
e
59
Pag
e
59
Pag
e
59
Pag
e
59
Pag
e
59
Pag
e
59
Pag
e
59
Pag
e
59
Pag
e
59
Pag
e
59
Pag
e
59
Pag
e
59
Pag
e
59
Pag
e
59
Pag
e
59
Pag
e
59
Pag
e
59
Pag
e
59
Pag
e
59
Pag
e
59
Pag
e
59
[14]. Murtza, T. I., Dixit, R.K. and Singh, H.G. 1979. Components of fodder yield in oats (Avena sativa L.). Forage Res.
5:179-82.
[15]. Nofouzi F., Rashidi V. and Tarinejad A.R. 2008. Path analysis of grain yield with its components in duram wheat
underdrout stress. In: International meeting on Soil Fertility Land Management and agroclimatology, Kusadasi, Turkey,
pp681-686.
[16]. Shanker S., Jha B. and Nirala R.B.P.2002. Variation and association studies in oat (Avena sativa L.) Forage Res.
28:110-112.
[17]. Simane B., Struit P.C., Nachit M.M. and Peacock J.M. 1993. Ontogenetic analysis of yield components and yield
stability of duram wheat in water limited environments. Euphytica 71:211-219.
[18]. Singh, R.K. and Choudhary, B.D. 1977. Biometrical methods in quantitative genetic analysis. Kalyani
Publishers. New Delhi. 178-185.
[19]. Solanki, K.R., Paroda, R.S. and Chaudhary, B.S. 1973. Components of green fodder yield in Oats (Avena sativa L.).
Haryana Agric. Univ. J. Res. 3:20-23.
[20].Vaisi, H., Golparvar1, A.R., Resaie, A. and Bahraminejad, S. 2013. Factor analysis of some quantitative attributes in
oat (Avena sativa L.) genotypes. Sci. Agric. 3(3):62-65.
Table 1: Phenotypic (above diagonal) and genotypic (below diagonal) correlation coefficients among sixteen
characters in OAT.
PH (cm) FLL (cm)
PL (cm)
IL (cm)
AL (cm)
SL/P T/P DF
(days) DM (days)
SI (g) G (%)
SL (cm)
SDW (g)
SVI I SVI II
SY (g)
PH (cm)
0.078 -0.182 *
-0.001
0.14 0.054 0.134 0.146 0.133 -0.11 0.048 0 0.14 0.074 0.032 0.072
FLL (cm)
0.167 0.03 0.003 0.014
-0.061
-0.012 0.094 0.033 0.138 -0.07 0.017 0.079 0.104 0.091 0.082
PL (cm)
-0.175 0.045 0.173
*
0.251 **
0.126 -0.068
-0.161 *
-0.138
0.305 **
-0.012 0.101 0.162
* -0.054
0.135 -0.037
IL (cm)
-0.03 0.013 0.336 0.176
*
0.082 0.206*
-0.133 -0.073
0.153 0.107 0.248
**
0.314 **
0.134 0.308 **
0.094
AL (cm)
0.167
-0.018
0.313 0.204
-0.037
0.077
-0.036
-0.02 0.097 0.410
**
0.167 *
0.233 **
0.216 **
0.274 **
0.113
SL/P 0.078
-0.007
0.174 0.033
-0.087
0.262**
-0.059 -0.066
0.220 **
-0.026 -0.029 0.175
*
0.299 **
0.103 0.518
**
T/P 0.173 0.072
-0.077
0.246 0.114 0.137
-0.078
-0.04 0.011 0.142 0.08 0.237
**
0.250 **
0.258 **
0.363 **
DF (days)
0.242 0.186
-0.278 -0.167
-0.022
-0.04 -0.124 0.558
**
0.026 -0.116 0.026
-0.028 -0.117
0.063 -0.174 *
DM (days)
0.242 0.124
-0.138 -0.118
-0.019
-0.117
-0.061 0.661 0.133 -0.01 0.001
-0.013
-0.02 -0.038
-0.022
Pag e
60
Pag e60
Pag e60
Pag e60
Pag e60
Pag e60
Pag e60
Pag e60
Pag e60
Pag e60
Pag e60
Pag e60
Pag e60
Pag e60
Pag e60
Pag e60
Pag e60
Pag e60
Pag e60
Pag e60
Pag e60
**G (%) -0.029 -0.112
0.052 0.105 0.504
-0.127
0.076
-0.145 -0.005
0.1 0.204
* 0.345 ** 0.497 ** 0.350 ** 0.269 ** SL (cm)
-0.04 0.119 0.145 0.363 0.207
-0.007
0.06 0.06
-0.016
0.13 0.212 0.459
** 0.209 * 0.172 * 0.046 SDW (g)
0.241 0.121 0.221 0.415 0.259 0.22 0.263
-0.007 -0.001
0.346 0.376 0.538 0.233
**
0.339 **
0.167 *
SVI I 0.09 0.149 0.008 0.227 0.26 0.289 0.169 -0.153
-0.01 0.13 0.504 0.309 0.256 0.319
**
0.515 **
SVI II 0.045 0.112 0.171 0.429 0.32 0.094 0.292 0.085 -0.045
0.213 0.385 0.155 0.379 0.397 0.087
SY (g) 0.059 0.155 0.003 0.146 0.156 0.58 0.374 -0.247
-0.046
0.183 0.237 0.07 0.169 0.553 0.092
*Significant at 5 percent
** Significant at 1 percent PH= Plant height (cm) , FLL= Flag leaf length (cm), PL= Peduncle length (cm), IL=Internode
length (cm), AL= Axis length (cm), S/P=Spikelets/panicle, T/p=Tillers/plant, DF= Days to 50% flowering, DM= Days to
maturity, SI= 100 seed weight (g), G%= Germination% , SL= Seedling length (cm), SDW= Seedling dry weight (g), SVI I
= seed vigour index I, SVI II = seed vigour index II, SY = Seed yield/plant(g).
Table 2: Path coefficient analysis of seed yield /plant with its component characters in OAT.
PH (cm) FLL (cm) PL (cm) IL (cm) AL (cm)
SL/P T/P DF
(days) DM (days)
SI (g) G (%) SL (cm)
SDW (g)
SVI I SVI II Genot ypic correl ation with seed yield /plant PH (cm)
0.00071 -0.015 82 0.035 91 -0.005 48 0.026 24 0.054 30 0.0387 5 -0.08539 0.060 00 0.010 23 -0.0084 9 -0.0016 1 -0.052 71 0.011 34 -0.008 82 0.0591 6 FLL (cm)
-0.00004 0.254 69 -0.009 17 0.002 41 -0.002 88 -0.004 77 0.0160 3 -0.06553 0.030 76 -0.009 18 -0.0324 4 0.0048 6 -0.026 58 0.018 86 -0.021 80 0.1552 2 PL (cm)
-0.00012 0.011 38 -0.205 21 0.061 21 0.049 30 0.120 87 -0.0171 5
0.09818
-0.034 34 -0.021 08 0.0151 5 0.0059 2 -0.048 46 0.001 06 -0.033 22 0.0034 9 IL (cm)
-0.00002 0.003 36 -0.068 96 0.182 16 0.032 14 0.022 66 0.0549 9
0.05897
-0.029 29 -0.010 04 0.0303 7 0.0148 3 -0.090 80 0.028 71 -0.083 37 0.1457 1 AL (cm)
0.00012
-0.004 66 -0.064 31 0.037 22 0.157 30 -0.060 66 0.0255 7
0.00770
-0.004 65 -0.006 30 0.1458 3 0.0084 7 -0.056 58 0.032 92 -0.062 32 0.1556 5
SL/P 0.00006
-0.001 75 -0.035 74 0.005 95 -0.013 75 0.694 11 0.0307 3
0.01419
-0.029 15 -0.017 46 -0.0368 4 -0.0002 8 -0.048 17 0.036 61 -0.018 35 0.5801 6
T/P 0.00012 0.018
23 0.015 72 0.044 73 0.017 96 0.095 25 0.2239 5
0.04356
-0.015 27 -0.001 78 0.0220 0 0.0024 7 -0.057 64 0.021 38 -0.056 86 0.3738 2 DF (days)
0.00017 0.047
34 0.057 14 -0.030 47 -0.003 44 -0.027 93 -0.0276 7 -0.35258 0.164 33 -0.000 11 -0.0417 9 0.0024 4 0.001 60 -0.019 32 -0.016 46 -0.2467 5 DM (days)
0.00017 0.031
53 0.028 37 -0.021 47 -0.002 95 -0.081 44 -0.0137 7 -0.23322 0.248 43 -0.006 92 -0.0015 7 -0.0006 5 0.000 13 -0.001 31 0.008 72 -0.0459 5 SI (g) -0.00014 0.046
Pag
e
61
Pag
e
61
Pag
e
61
Pag
e
61
Pag
e
61
Pag
e
61
Pag
e
61
Pag
e
61
Pag
e
61
Pag
e
61
Pag
e
61
Pag
e
61
Pag
e
61
Pag
e
61
Pag
e
61
Pag
e
61
Pag
e
61
Pag
e
61
Pag
e
61
Pag
e
61
Pag
e
61
G (%) -0.00002 -0.028
57 -0.010
75
0.019 13
0.079 33
-0.088
43
0.0170 4
0.05096
-0.001 35
-0.004
99
0.2891 9
0.0086 6
-0.082
26
0.063 73
-0.074
83
0.2368 4
SL (cm)
-0.00003 0.030 31
-0.029
76
0.066 12
0.032 62
-0.004
70
0.0135 2
-0.02104
-0.003
98 -0.006
55
0.0613 1
0.0408 5
-0.117
82
0.039 08
-0.030
18
0.0697 5
SDW (g)
0.00017 0.030
94 -0.045
45
0.075 59
0.040 67
0.152 81
0.0589 9
0.00258
-0.000 14
-0.017
37
0.1087 2
0.0219 9
-0.218
81
0.032 38
-0.073
81
0.1692 6
SVI I 0.00006 0.037 96
-0.001
71
0.041 32
0.040 91
0.200 75
0.0378 3
0.05382
-0.002 58
-0.006
54
0.1456 1
0.0126 1
-0.055
98
0.126 58
-0.077
26
0.5533 8
SVI II 0.00003 0.028 54
-0.035
04
0.078 07
0.050 40
0.065 48
0.0654 6
-0.02983
-0.011
14 -0.010
70
0.1112 5
0.0063 4
-0.083
03
0.050 27
-0.194
52
0.0915 8
Residual effect = 0.2707 PH= Plant height (cm) , FLL= Flag leaf length (cm), PL= Peduncle length (cm), IL= Internode
length (cm), AL= Axis length (cm), S/P= Spikelets/panicle, T/p=Tillers/plant, DF= Days to 50% flowering, DM= Days to
maturity, SI= 100 seed weight (g), G%= Germination% , SL= Seedling length (cm), SDW= Seedling dry weight (g), SVI I