Copyright © 2014 IJECCE, All right reserved
A Cognizance Discovery of Indian Railway through
Modern Lucrative using Pattern Recognition and
Classification
T. Ramdas Naik, O. Subhash Chander Goud, K. Arun Raj Bapuji
Abstract – The present work is going to concentrate on data Railway Transaction Data for the estimation of the passengers and their contribution in earning the profits by the department. The systems already present give us the inflow and outflow of the passengers and the regular activities which decides the profitability of these peculiar departments. The first three parts of the paper is going to discuss the Data Transformation of the raw data into sets which categorizes data into some sort of Domains. These Domains are being classified according to scenario which comes with number of queries processing with MySql Database. In this work we are going to describe the models like Classification, choosing Classification best Attributes, etc., applied on the data set. The second three parts of the paper is used for the Pattern Discovery we try to use the Data Classification Technique called as Hierarchical Classification which gives the convergence point to observe in Data. In the Pre-processing area we try to use Matrix Row by Row Based Transformation which gives us the best mechanism to make the Data Persist. The resultant is the factor based analysis which will lead us to a Pattern to observe called as Pre and Post-Periodic Classification of Data. The rest of the work will be described in the later sections.
Keywords – Domain, Inflow, Outflow, Periodic, Hierarchical, Classification, Matrix, Scenario.
I.
I
NTRODUCTIONThe Data Mining concept reveals the knowledge of information through many relative mechanisms through which, we make the relevant information useful for the utilization in decision making and also for estimating the future. Now in Data mining pattern recognition plays a crucial role all think it is different than Data Mining but it nothing as “the act of taking in raw data and making an action based on the category of the pattern”.[1-2]
Indian Railways has a wide network throughout the nation. With the help of this widely spread railway networks, you can reach any place in India. Both passengers and freight can be transported to anywhere in India by the help of Indian Railways. This also creates impact on the Indian Economy. This article deals with the impact of Indian Railways on the Indian Economy [3][4].
The systems already present give us the inflow and outflow of the passengers and the regular activities which disturbs the profitability of these peculiar departments. In order to make raw data useful, it is necessary to represent, process, and extract knowledge for various applications [11], the main reason why we divide the raw data into sets is that the problem solving will be very easy if its category is divided into some sort of Domains. These Domains are being classified according to scenario which comes with number of queries processing with MySql Database. The
reason why we transform the data to an data base is to see if there exists any functional dependencies [8]. The Database is the transformation of flat files with queries like „X‟ described in the section „Pattern Discovery‟ .With this information we categorize the information into similar Attributed Information called as Scenario. And after all there are many requirement basis and un-requirement basis fund increasing nature in the above said department related to government. So this system will also guide the department on how to increase the fund requirement depending on non-crisis and under-crisis timing also.
The data mining process has several steps which mainly deal with data cleaning, transformation and pattern extraction [5]. The process of data cleaning and transformation is done with data set when being transformed to data base MySQL. After cleansing the data transformed in to database format the data set can be picked up and used for variant models as described above. The samples of the data sets which we are saying will be huge and gives complex ideologies in order to extract the knowledge gaining and also in order to make some crucial decision during the period when there are crisis and some other reason. As these sets can be divided into some Domain .These domains can be categorized based on the allocations of the schemes released by the specific departments. And if necessary the some peculiar reason of categorizing the charges according to the scheme‟s. These all will be giving us the structure that how narrow the knowledge gaining system can be and how much broad the system can be categorized.
All sets when categorized the system starts mining and also follows some kind of regulated informational retrieval activity movement so that which helps us in giving the output as an small and short precise decisions. The first of the work which is to be done is to identify the patterns as the data set which is given is in the form of 3- equal set of an month. The data given by the Railway ministry is in the format of 1st to 10th of the month and 11th to 20th of the month and then 1st to end of the month. This method of data is drawn back into the following mechanism of transformation as shown below:
Copyright © 2014 IJECCE, All right reserved The figure 1 above shows us the path way to transform
the given raw data + along with some other decentralization factors gives us the details about the how the environmental policy is and how accordingly that gives us the regular changes or else the regular time interval of time which is giving less traffic to railway passengers. This results us an explanation system which always gives us updated information how to take decision depending up on the estimation factors which are varying it. The Scenario here may be a two factor analysis such as Passenger Potential and Actual Passenger Potential at a time.
In the Preprocessing the work we try to clean the data which is not containing of non-quality of data[7-12], here we transform the raw Flat file format like .xls report in to data base using the time period factor like „Period-from and Period-to‟ in to a 2 dimensional structure called as MySql Table „tat_2_0‟. This allows us in manipulating the below shown figure 3 fields „Period:‟ to the format like figure 4 fields of database table columns as „Period_from‟ and „Period_to‟ respectively. This is simple as shown below pictorial representation.
The representation in table „tat_2_0‟ structure is
A= A1 A2 A3 A4 A5 A6 . . . .
Table 1: tat_2_0, where A1=Period_from, A2=Period_to , A3= Zone, A4=Class,…
II.
M
ATRIXR
OW BYR
OWB
ASEDT
RANSFORMATIONHere in this we try to represent the raw data in to a Matrix structure like A. and this A gets recorded as shown below
A=
𝒑𝒆𝒓𝒊𝒐𝒅_𝒕𝒐 𝒑𝒆𝒓𝒊𝒐𝒅_𝒇𝒓𝒐𝒎 𝒛𝒐𝒏𝒆 𝑪𝒍𝒂𝒔𝒔 𝑨_𝒑𝒂𝒔𝒔 .
mxn
and the condition here is that there is no A[i][j] ≠ null i.e. empty. And if A[i][j]= null then A[i][j] = 0.0 .
later the complete Arrary A is transformed in to tat_2_detail table by using the following mechanism. Int i=number of coloumns in A
Int j= number of rows in A for (int n=0;n<=j;n++) {
for (int m=0;m<=i;m++) {
Record in tat_2_detail[n][m]=A[n][m]; }
}
Now, from this structure we try to draw the scenarios like Zone wise separation or Class wise etc. These separations of the above mentioned Table 1 is called as the Scenario. The picture figure2 gives us the result depending up on the facts of reasons that vary from scenario to scenario.
Now this particular structure is transformed in to database format as shown below figure later the data is ready for the use of data analysis. These transformed data can used at a time for the purpose of at a time multifactor analysis as explained.
These results which are giving us will lead us to the following
Fig.2.
The figure 4 is the transformation of figure 3 where in the data is segregated as according to the period or duration. This gives us the convenience of limiting one factor of” time instance” then we try to limit the other factor called as “Zone” later according to this we try to extract the factor “Class” now some pattern which we discovered in accordance is as given in the below section “Pattern Discovery”.
III.
P
ATTERND
ISCOVERYIn pattern discovery we try to concentrate on the first selecting the Properties with which are dependent and non-dependent as “several key properties one should examine in order to select the right measure for a given application” [6]. Machine performing Pattern can be observed as learning the invariant and common properties of a set of samples characterizing a class[13] .The Pattern recognition purpose we try to consider the Preprocessing results of report 2.0 “Zone-wise Class-wise Summary Report of Current and Last Year Passenger Percentage Growth for Reserved Trains” .This report gives us the data related to Current and previous years Percentage growth of passengers for the reserved trains according to Zone and Class of trains .
The Pattern to be discovered results us in calculating mainly how much the Passengers Potential is co-related to the Zone and Class at the same time the Co-relation between the Zones to Passenger‟s Reservation towards regular workload trains for regular routes. Among Pattern recognition some of the explorations are as shown in the below picture.
The classification stage is the decision making part of the recognition system. One of the most important transform to reduce dimensionality for simple and fast data processing and better convenience for dividing the data set in to Classes [9] and they say the information related to which class to pickup and utilize for decision making . The exact classification we made according to the scenario as
X=“Actual Potential and Passenger Potential for complete data set where Zone is ‘Central Railway’ and Class is ‘First Class’ and period from is ‘1 or 11 /any month/*’ and Period to is ’10 or 20 or 30 or 31/any month/ *’ ”.
Raw Data
Decategorisation According to
scenario
Reasons and facts up on which data give
Copyright © 2014 IJECCE, All right reserved Equation -1
Xi= 101 28,29,30,311 𝑡𝑎𝑡_2_𝑑𝑒𝑡𝑎𝑖𝑙
Equation -2
Xj= 𝑡𝑎𝑡_2_𝑑𝑒𝑡𝑎𝑖𝑙
28,29,30,31 11 20 11
Equation -3
Where X ⊃ Xi and Xj and
tat_2_detail is Data set = ” Zone-wise Class-wise Summary Report of Current and Last Year Passenger Percentage Growth for Reserved Trains”. The least and maximum values of 1-10, 1-30.. are projection of attribute ranges on the scenario = “tat_2_0”.
In this stage the data is mined to extract the rule that identifies the unusual and fraudulent patterns. Normally, the characteristic of the problem, its domain and expected results define the model to be used for the pattern discovery. “The models can be predictive or descriptive [10].The pattern to be discovered are drawn in the format of results when analyzed, they draw us scenario based important results where we have some patterns being drawn from the results extracted because of the above query. Here „*‟ is from all the years in the Data Set. The result drawn has led us to the following figures about which there is in depth discussion in Results Section.
IV.
R
ESULTSAs according to the analyses of results made previous on Railway Data the responses were subjected to various empirical analyses through using SPSS. The findings were finally presented with a set of conclusions and recommendations. The statistical analyses were descriptive as well as causal, and included multivariate statistical techniques for testing of the hypotheses to arrive at the research findings [11], as according to this statement the Pattern Discovery reveals us the basic multiple variable variations in the Railway data. So the pattern basis classification is just for the purpose of the Classifying the data not to Estimate the Railway profits on immediate so that these patterns are capable of deciding whether any estimate given factor comes under what set of class of data they belong .
The Results drawn becomes the criterion point in order to make Pattern Observations. The equation [I]given in the above Pattern Discovery section has led to the following graphical representation where we observe that the figure 5 where the January month in 2007 has started with a convenient 30.71% increment than the previous year , where in Passenger Potential is 24.87% compared to last year 2006. Now if we can see that it got dropped in the same January 2008 month rather than 2007.
And this dropping of Actual passenger and Passenger Potential dropped to 0% is continued still the month of April, later there is an increment in the May 9.9 %and -0.85% respectively .The dropped level is increased by the month of July 2008 to 46.35% but still Passenger Potential is -.54 % as shown in the below figure 6.
Fig.5. January Month Complete Variation of Actual Potential and Passenger Potential from 2007 to 2010.
Fig.6. July Month Complete Variation of Actual Potential and Passenger Potential from 2007 to 2010.
This way of increment in Actual Potential continued until October up to 58.46%, but again there is a decrement of Actual Passengers to 23.82 %. This increment continued until April 2009. This Variation of Actual Passenger will lead us to the Pattern that there was a some sort of disturbance until 2008 later also we can find some more patterns from time period 2009 to 2011.
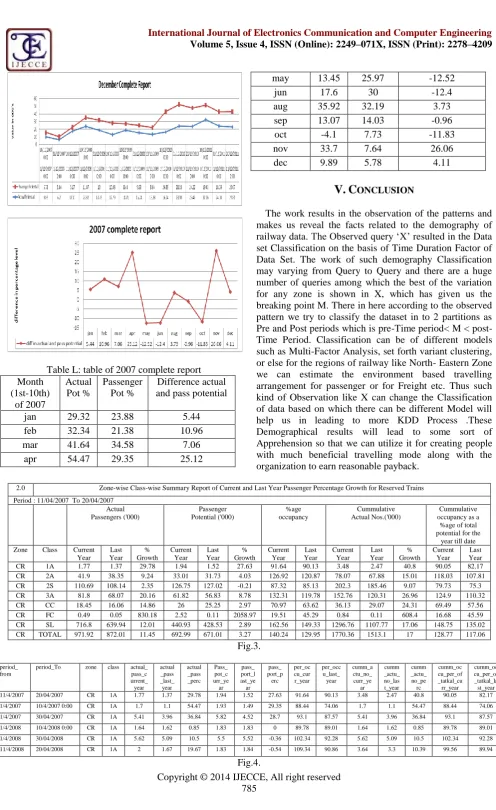
Copyright © 2014 IJECCE, All right reserved Table L: table of 2007 complete report
Month (1st-10th) of 2007 Actual Pot % Passenger Pot % Difference actual and pass potential
jan 29.32 23.88 5.44
feb 32.34 21.38 10.96
mar 41.64 34.58 7.06
apr 54.47 29.35 25.12
may 13.45 25.97 -12.52
jun 17.6 30 -12.4
aug 35.92 32.19 3.73
sep 13.07 14.03 -0.96
oct -4.1 7.73 -11.83
nov 33.7 7.64 26.06
dec 9.89 5.78 4.11
V.
C
ONCLUSIONThe work results in the observation of the patterns and makes us reveal the facts related to the demography of railway data. The Observed query „X‟ resulted in the Data set Classification on the basis of Time Duration Factor of Data Set. The work of such demography Classification may varying from Query to Query and there are a huge number of queries among which the best of the variation for any zone is shown in X, which has given us the breaking point M. There in here according to the observed pattern we try to classify the dataset in to 2 partitions as Pre and Post periods which is pre-Time period< M < post-Time Period. Classification can be of different models such as Multi-Factor Analysis, set forth variant clustering, or else for the regions of railway like North- Eastern Zone we can estimate the environment based travelling arrangement for passenger or for Freight etc. Thus such kind of Observation like X can change the Classification of data based on which there can be different Model will help us in leading to more KDD Process .These Demographical results will lead to some sort of Apprehension so that we can utilize it for creating people with much beneficial travelling mode along with the organization to earn reasonable payback.
2.0 Zone-wise Class-wise Summary Report of Current and Last Year Passenger Percentage Growth for Reserved Trains
Period : 11/04/2007 To 20/04/2007
Actual Passengers ('000) Passenger Potential ('000) %age occupancy Cummulative Actual Nos.('000) Cummulative occupancy as a %age of total potential for the
year till date
Zone Class Current
Year Last Year % Growth Current Year Last Year % Growth Current Year Last Year Current Year Last Year % Growth Current Year Last Year
CR 1A 1.77 1.37 29.78 1.94 1.52 27.63 91.64 90.13 3.48 2.47 40.8 90.05 82.17
CR 2A 41.9 38.35 9.24 33.01 31.73 4.03 126.92 120.87 78.07 67.88 15.01 118.03 107.81
CR 2S 110.69 108.14 2.35 126.75 127.02 -0.21 87.32 85.13 202.3 185.46 9.07 79.73 75.3
CR 3A 81.8 68.07 20.16 61.82 56.83 8.78 132.31 119.78 152.76 120.31 26.96 124.9 110.32
CR CC 18.45 16.06 14.86 26 25.25 2.97 70.97 63.62 36.13 29.07 24.31 69.49 57.56
CR FC 0.49 0.05 830.18 2.52 0.11 2058.97 19.51 45.29 0.84 0.11 608.4 16.68 45.59
CR SL 716.8 639.94 12.01 440.93 428.53 2.89 162.56 149.33 1296.76 1107.77 17.06 148.75 135.02
CR TOTAL 971.92 872.01 11.45 692.99 671.01 3.27 140.24 129.95 1770.36 1513.1 17 128.77 117.06
Fig.3.
period_ from
period_To zone class actual_ pass_c urrent_ year actual _pass _last_ year actual _pass _perc Pass_ pot_c urr_ye ar pass_ port_l ast_ye ar pass_ port_p erc per_oc cu_cur r_year per_occ u_last_ year cumm_a ctu_no_ curr_ye ar cumm _actu_ no_las t_year cumm _actu_ no_pe rc cumm_oc cu_per_of _tatkal_cu rr_year cumm_oc cu_per_of _tatkal_la st_year 11/4/2007 20/04/2007 CR 1A 1.77 1.37 29.78 1.94 1.52 27.63 91.64 90.13 3.48 2.47 40.8 90.05 82.17 1/4/2007 10/4/2007 0:00 CR 1A 1.7 1.1 54.47 1.93 1.49 29.35 88.44 74.06 1.7 1.1 54.47 88.44 74.06 1/4/2007 30/04/2007 CR 1A 5.41 3.96 36.84 5.82 4.52 28.7 93.1 87.57 5.41 3.96 36.84 93.1 87.57 1/4/2008 10/4/2008 0:00 CR 1A 1.64 1.62 0.85 1.83 1.83 0 89.78 89.01 1.64 1.62 0.85 89.78 89.01 1/4/2008 30/04/2008 CR 1A 5.62 5.09 10.5 5.5 5.52 -0.36 102.34 92.28 5.62 5.09 10.5 102.34 92.28 11/4/2008 20/04/2008 CR 1A 2 1.67 19.67 1.83 1.84 -0.54 109.34 90.86 3.64 3.3 10.39 99.56 89.94
Copyright © 2014 IJECCE, All right reserved
R
EFERENCES[1] Pattern Classification second edition book written by- By
Richard O. Duda, Peter E. Hart, David G. Stork.
[2] Fundamentals of Algorithms: Matrix methods in data mining and
pattern recognition- Lars Elden.
[3] http://indianrailways.gov.in/railwayboard/uploads/directorate/
stat_econ/yearbook10-11/Economic_Review.pdf
[4] http://pib.nic.in/feature/fe0199/f1101991.html
[5] http://web.engr.illinois.edu/~hanj/pdf/ency99.pdf
[6] Selecting the right objective measure for association analysis
Pang-Ning Tan*, Vipin Kumar, Jaideep Srivastava:
http://www.cse.msu.edu/~ptan/papers/IS.pdf
[7] http://www.mimuw.edu.pl/~son/datamining/DM/4-preprocess.
[8] FD_Mine: Discovering Functional Dependencies in a Database
Using Equivalences Hong Yao, Howard J.Hamilton, and Cory Butz:http://www.cs.uregina.ca/Research/Techreports/2002-04. pdf
[9] Nearest Neighbor Algorithm in Handwritten Character P. R.
Deshmukh Department of Electronics & Telecommunication, Alamuri Ratnamala Institute of Engineering Technology Sapgaon, Tal.Shahapur, Dist.Thane-421601, M. B. Limkar Department of Electronics & Telecommunication, Terna College of Engineering, Neruls, Mumbai
[10] Effective Use of Pattern Discovery for Detection of Fraudulent
Patterns in Railway Reservation-1 Ashish Gaigowad, 2 Prachi Deote, 3 Prathamesh Badge, 4 Rahul Giradkar - Dept. of
Computer Technology, Yeshwantraochavan college of
Engineering, Nagpur, India.
[11] Feature Selection for Knowledge Discovery and Datamining by
Huan Liu and Hiroshi Motoda
[12] Data Mining: Practical Machine Learning Tools and Techniques,
by Ian H. Witten, Eibe Frank
[13] Pattern Recognition Algorithms for Data Mining by Sankar
K.Pal, Pabitra Mitra
A
UTHOR’
SP
ROFILET. Ramdas Naik
Has completed Bachelors in Civil from Osmania University, M. Tech. (CSE) from College of Engineering, Osmania University, MCA from University of Hyderabad, Pursuing Ph. D. in CSE, Dept. of Computer Science Engineering, College of Engineering, Osmania University, Hyderabad, A. P. Email: [email protected]
O. Subhash Chander Goud
Has completed Bachellors from Nizam College, Osmania University, MCA from PG college of Science, saifabad, Osmania University, A.P. working as Assistant Professor in Nizam College from 2010. Email:[email protected]
K. Arun Raj Bapuji
Has completed MCA from Kakatiya University in 2003, and is pursuing Ph.D from Acharya Nagarjuna University.