382 |
P a g e
RURAL ELECTRIFICATION USING RENEWABLE
ENERGY SOURCES
Devesh M.Imade
1,Dr. Mangesh S.Thakare
2
1
Student,
2Professor,
1,2,Department of Electrical Engineering Pune VidyarthiGriha’s College of Engg. & Tech.,
Pune, (India)
ABSTRACT
Rural electrification is one of the main issues in developing country like India due to large number of
small villages and remote Islands are unelectrified. Due to financial and technical issues, extension
or installation of grid lines with high voltage is not possible in these areas. Main electrical load in
these villages is residential load which consist of mostly lighting load. The study presented in this
paper shows availability of solar and biogas at villages is sufficient to meet electric demand and can
replace use of costlier fuel for electricity. Considering cost data of 2007, 2012 and 2016;
economically feasible option is tested for five villages using cost of energy (COE) calculation for
solar, biogas and diesel generator (DG). Based on the analysis of cost of energy for the year 2016,
size require of solar photovoltaic systems require for these villages is also presented.
Keywords:
Balance of system (BOS), biogas, and cost of energy, renewable energy sources, and
solar photovoltaic.
I. INTRODUCTION
In modern world energy has becomes an important utility. It is one of main factor in country’s development.
Normally there are many forms of energy chemical, thermal, electrical etc. This energy can obtain from the
conventional sources like diesel, petrol, coal, LPG and CNG etc. Among all types of energy electrical energy
is most favourable due to easy in transfer over long distance and easy in use to consumer.
India is developing country and having world’s second largest country in population. Hence electricity
consumption is high and will increase in future. The per capita consumption of electricity in India during year
2016 was 768kWh/yr. India is world’s third largest producer and fourth largest consumer of electricity [1],
[2]. Major consumption of electricity is in industrial sector (44%) and in agricultural sector (18%). To fulfil
the demand of electricity as mentioned the majority of power plant in India is coal based (59%). In India
mainly coal is used for power generation and being conventional its storage is limited. Its impact on
environment results into large amount of carbon dioxide emission. Also demand of imported coal forced to
spend more money for generation of electricity. Hence search of another option for source of electricity is
383 |
P a g e
There are 590000 villages in India and about 700 million people live in rural and remote part of country. Mostvillages in remote area not get sufficient electricity which slow down the growth of rural India both at social
and economic development. Total electricity coverage area 80% and 20% remain unelectrified which consists
most of remote area. In India53% of rural population has access of grid electricity and 43% population use
conventional sources for electricity [3], [4]. In this remote area the power is mainly provided through diesel
based power generation. As the cost of diesel per liter increase day by day the cost of energy using DG is very
high not affordable to villagers. The financial problems for remote electrification include high capital cost,
lack of subsidies etc. for long transmission of power. The technical problems faced in remote place
electrification include severe transmission and distribution losses, voltage drop and unreliable operation in
distribution system because of long distance from power stations [5]. Due to these issues the use of renewable
energy sources for remote electrification is the best option due to their availability at place of requirement. It
also reduces voltage drop and the expenses on long distance transmission line. In this paper sample data [6] of
five villages (Bharatpur, Laxmanpur, Ramnagar, Sitapur, and Neil Kendra) of remote Neil Island is adapted
for the search of techno economic renewable options. The size of renewable energy source and calculation of
cost of energy (COE) are determined for the search of best option for village electrification.
II. STUDY AREA: NEIL ISLAND
2.1 Location of Neil Island
384 |
P a g e
The location map of remote Neil Island is shown inFig.1. It is located between 6° 45́ and 13°41́ Northlatitudes and 92°12́ and 93°57́ East longitude. The island has an area of 18.9 Km2 and consists of five
villages (Bharatpur, Laxmanpur, Ramnagar, Sitapur, and Neil Kendra) [6]
2.2 Energy scenario at Neil Island:
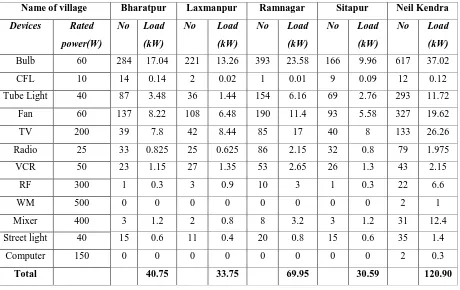
The details of connected load [6] of five villages are shown in Table 1. Maximum load found to be during
evening time i.e. from 5.30 pm to 11.30 pm and most of load is lighting loads. All five villages electrified
through the diesel power generation so the distribution system of electricity present at Neil Island.
III. CASE STUDY
To replace the existing diesel generator option at sample 5 villages, renewable energy sources such as solar PV
and biogas sources are selected for the purpose of remote electrification. As India receive large amount of solar
radiations in range of the 4 to 7 kWh/ /day with horizontal intensity 1000 W/ and most places have annual
sunshine of about 300 days, solar PV is one of the best option for village electrification. Biogas is selected due
to locally available waste product at these villages which can be sufficient to meet their electricity requirements.
Availability of agriculture wastage, fuel wood, and animal dung produces biogas sufficient to small scale
electricity generation. Biogas gives a sustainable and relatively low cost option for fulfilling basic electricity
needs in rural and remote areas. To meet the energy demands at villages, sample calculation of array sizing,
biogas generation and COE for one of the village Bharatpur is presented bellow in detail. Similar steps and
calculation applied to other villages for COE of solar and biogas.
2.3 Solar PV power generation
Solar radiations are about 1000 W/ The efficiency of solar cell assumed to 13% so solar cell of 1 produces
130W of peak power. A 100 kWp solar plant of 1800 panels of 70 W each produces 75 kWh/h. Assuming peak
sunshine hours 4.2 hr/day units generated per day is 315 kWh. Specification of 70Wp module are a) Peak
current 4.15 A and short circuit current 4.48 A b) Mismatch factor 0.85 c)battery efficiency 0.8 and charge
regulator efficiency is 0.9 d) module voltage is 12V.
3.1.1 Array sizing and total no of modules: From the Table 1, connected load of Bharatpur is 40.755 kW. From
connected load, from specification given above and following equations (1) to (5) determines the array size and
number of modules required to supply the electrical load of Bharatpur. Require array load and size calculated
using following equations.
Array load = (1)
Array load = 56.94 kWh/day
Array size =
(2)
385 |
P a g e
Total number of module calculated from specification and system voltage is 220V.No. of series modules = (3)
= = 19
No. of parallel modules =
(4)
= (5)
=
= 16
No of parallel model = 16 No of series model = 19 Total no of modules = No of series Modules x No of parallel Modules = 16 19 = 304
Table 1 Connected load of five villages
Name of village Bharatpur Laxmanpur Ramnagar Sitapur Neil Kendra
Devices Rated
power(W)
No Load
(kW)
No Load
(kW)
No Load
(kW)
No Load
(kW)
No Load
(kW)
Bulb 60 284 17.04 221 13.26 393 23.58 166 9.96 617 37.02
CFL 10 14 0.14 2 0.02 1 0.01 9 0.09 12 0.12
Tube Light 40 87 3.48 36 1.44 154 6.16 69 2.76 293 11.72
Fan 60 137 8.22 108 6.48 190 11.4 93 5.58 327 19.62
TV 200 39 7.8 42 8.44 85 17 40 8 133 26.26
Radio 25 33 0.825 25 0.625 86 2.15 32 0.8 79 1.975
VCR 50 23 1.15 27 1.35 53 2.65 26 1.3 43 2.15
RF 300 1 0.3 3 0.9 10 3 1 0.3 22 6.6
WM 500 0 0 0 0 0 0 0 0 2 1
Mixer 400 3 1.2 2 0.8 8 3.2 3 1.2 31 12.4
Street light 40 15 0.6 11 0.4 20 0.8 15 0.6 35 1.4
Computer 150 0 0 0 0 0 0 0 0 2 0.3
386 |
P a g e
3.1.2 Batterysizing: The battery capacity is decided assuming 5 days of reserve, depth of discharge (DOD) as80%, temperature derating of 0.85.Total number of batteries is calculated considering individual capacity of
battery as 200 Ah.
Capacity of battery calculated using equations (6), (7), (8), (9) as follows
Battery capacity = (6)
=
= 1024 Ah
No. of series batteries = (7)
= = 19
= 19 approx
No. of parallel batteries = (8)
=
= 6 approx
Total no of batteries = No of series Battery No of parallel Battery (9)
= 16
= 114
3.1.3 Inverter sizing: After determining the size and numbers of battery next step is to size inverter to supply
power to load. Inverter size depends upon the total connected load and efficiency of inverter. Efficiency of
inverter assumed as 90%. Using following
equation (10) the size of inverter for Bharatpur village is calculate from data given in Table 1. Total connected
load of 40.755 kW indicates output power required by the inverter.
Efficiency of inverter =
x 100
(10)So inverter input power calculated from equation (10)
= = 50 kVA
Inverter input power = 50 kVA
For irrigation pump load of 27.2 kW by using similar steps and formulae the array size calculated
Array size = 11 kWp/day
387 |
P a g e
3.2 Electricity produced from biogas:The waste available in the form of cattle dung (Animal dung) and bird dung which can be converted into the
biogas. Detail of dung availability [6] of five villages is shown in Table 2. It was found that for Bharatpur there
are 997 kg of dung from animal and 427 kg dung from the bird. Total collected dung is 1421 kg but the
collection efficiency considered as 75% so net dung collection be the 1068 kg. The important assumption for the
waste collection is that 7 kg of dung will be available from buffalo, 1 kg from goat and 0.5 kg from the hen.
Whereas 12 kg of dung produces 1 of biogas Total biogas production from the net dung availability is
calculated using the following equations and assumptions describe above.
1 kg gives 0.0833 so total wastes of 1068 kg gives 89 biogas. Biogas plant of 60 capacities is
considered in COE calculation. Hence number of biogas plant of capacity 60 for Bharatpur (NB) is 2.
As 89 m3 of biogas available and as 1 biogas gives 19 MJ [6], electricity generated from biogas found as,
Electricity from biogas (MJ) =89 19=1691 MJ
Conversion of MJ to kWh
Electricity in kWh= 469.722 kWh
Total electricity generated from waste at Bharatpur considering 33 % efficiency is found as 155 kWh/day
Table 2 Dung availability and biogas production
3.3 Cost of energy calculation:
3.3.1 COE of solar PV: COE for solar depends upon the capital cost of solar panel and balance of system cost
(BOS).BOS cost consider cost of battery, inverter and other components required for connection of solar PV
system. It is assumed that BOS is 41% of panel cost.
Capital cost of solar system is calculated using following equations
Capital cost = Cost of solar panel + BOS cost
= [watt peak cost + BOS cost] Array size Name of
village
Animal
dung per
day (kg)
Bird dung
per day
(kg)
Total dung
per day
(kg)
NET dung
(75%
collection
efficiency)
Total
biogas per
day
(cu-m)
Bharatpur 997 427 1424 1068 89
Laxmanpur 1378 245 1623 1217 101
Ramnagar 2064 552 2616 1962 164
Sitapur 1385 285 1670 1253 104
Neil kendra 1059 308 1367 1025 85
388 |
P a g e
Panel cost is calculated from watt peak cost. In the year 2007 Rs 165 was the per watt peak cost of solar PVpanel. The array size calculated in section A shows Baratpur village require array size of16kWp/day to supply
electrical load.
Panel cost = Rs2640000/-
BOS cost =Rs1082400/-
Putting together cost of panel and BOS cost, capital cost is found as of Rs 3722400/-.
As the Government of India provides subsidy for solar power plant and it is 2/3 of capital cost hence considering
subsidy
Cost of subsidy for solar = Rs2481600/-
Net Capital cost = Rs1240800/-
So after calculating the capital cost of PV panel as above next step is to calculate annual generation from PV
array.
Total annual generation calculated by assumption of 100 kWp panel gives 75 kWh/h [6]. Hence 16 kWp gives
12 kWh/h of energy and considering solar PV is operated for 3 hours.
Annual generation = 12 365 = 13140 kWh
Considering capital cost and net generation, cost of energy (COE) for solar is calculated as
Cost of energy (COE) =
(11)
Where PRF is plant recovery factor and it is 15 % of capital cost and O&M is operation and maintenance cost
which is considered as 2 % of capital cost.
Putting values of annual generation, capital cost, PRF and O&M in equation (11)
Cost of energy (COE) for solar PV= 16.05 Rs/kWh
3.3.2 COE for biogas: COE of biogas depends on plant cost and unit fuel cost. The cost of 60 biogas plant in
year 2007 is Rs 302500 per plant.
COE =
(12)
Capital cost of biogas plant = Cost of 60 plant NB
NB = Number of biogas plant of capacity of 60 for Bharatpur.From section B, NB is equal to 2.
Cost of 60 plant in 2007 year is given as Rs302500/-
Capital cost of Biogas Plant =Rs605000/-
As considering subsidy given for biogas is 40% of the capital cost is
Capital cost of Biogas Plant= Rs363000/-
Next step is to calculate unit cost of fuel for mode 1) 70 % biogas, 30 % diesel 2) 85 % biogas, 15% diesel
Unit cost of fuel = cost of diesel per kWh + cost of dung per kWh (13)
As fuel consumption in 70 % biogas, 30 % diesel mode is 0.09 L/kWh and cost of diesel in 2007 is 33.25 Rs/L
so unit cost diesel/kWh using equation (13)
389 |
P a g e
Similarly the cost of diesel for 85% biogas, 15% diesel calculated as fuel consumption reduced 0.045L/kWhusing equation (13)
Cost of diesel for 85 % biogas, 15 % diesel = 1.49 Rs/kWh
Cost of dung is gives as 1.25 Rs/kWh
Unit cost of fuel for 70 % biogas, 30 % diesel = 4.24 Rs
Unit cost of fuel for 85 % biogas, 15 % diesel = 2.74 Rs
As the electricity generated from biogas given is 10 kW and biogas plant is assumed to be operated for
6.5 hours and number of 60 biogas plant (NB) is 2
Annual generation = 10 6.5 47450 kWh
Putting value of unit cost of fuel, capital cost and annual generation in equation (12) for both modes, COE is
calculated as
COE 70% biogas and 30%diesel (no subsidy) =6.41 Rs/kWh
COE 85 % biogas, 15 % diesel (no subsidy) = 4.91Rs/kWh
Similarly the COE with subsidy is calculated for both modes as
COE for 70% biogas and 30%diesel = 5.54 Rs/kWh
COE for 85 % biogas, 15 % diesel = 4.04 Rs/kWh
3.3.3 COE of diesel power generatios: COE of diesel power generation calculated as
Capital cost Diesel power plant = Cost of generator/kW Size of generator
As cost of generator in year 2007 is 20000 Rs/kW and size of generator is taken as 30% more than connected load
hence size of generator is 53kW
Capital cost Diesel power plant = Rs1060000/-
Unit cost of fuel = Fuel consumption Rate of diesel/L
As fuel consumption is 0.3 L/kWh and rate of diesel in 2007 is 33.25 L
Unit cost of fuel = 9.975 Rs/kWh
As there is no subsidy for diesel power generation, it is not included in calculations. From capital cost and unit
fuel cost values calculated above and equation (12),
COE for diesel power generation
=
11.93 Rs/kWhSteps and calculation presented in section A, B and C, applied for the other villages. Considering the cost of
components as per year 2007, 2012 and 2016, year wise COE with and without subsidy has been given in Table
3. In addition to this the battery and number of PV module required for other villages are calculated by applying
steps in section A. The details of battery and PV module obtained as per village connected load are as given in
390 |
P a g e
IV. RESULTS AND DISCUSSION
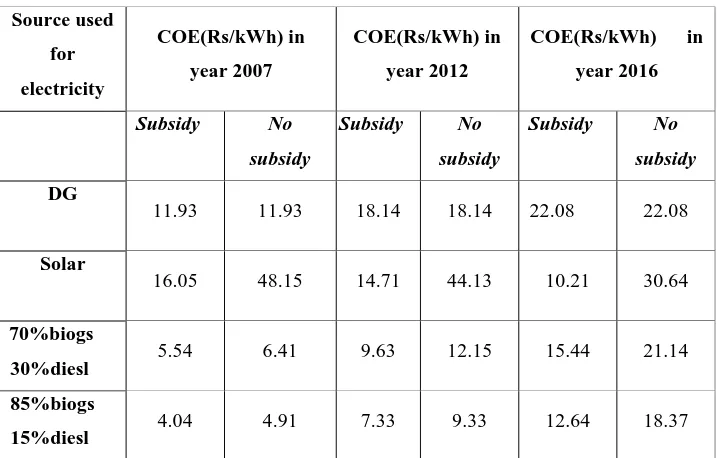
Table 3 shows effect of change in COE for the year 2007, 2012, and 2016. As government of India provides
subsidy for solar and biogas power generation and its local availability, the use of these sources in comparison
with diesel power generation are found attractive for village electrification.
Table 3 Cost of energy
In year 2007 the COE of DG is 11.93 Rs/kWh and it goes on increasing in year 2012 (18.14Rs/kWh) and in year
2016 (22.08Rs/kWh) due to increase in diesel cost and installation cost. Whereas COE of solar PV in year 2007
is 16.05Rs/kWh and decreases in year 2012 (14.71Rs/kWh) and in 2016 more reduction in COE (10.21Rs/kWh)
because of reduction in panel cost and BOS cost.
Duel fuel mode gives two options for use of biogas as 70%biogas and 30% diesel & second one is 85% biogas
and 15 % diesel hence due to reduction in use of diesel in second option the COE is less relative to that of first
option. So in year 2007 COE of biogas of both option is very less as compared to solar and DG. But as cost of
diesel increase in year 2012 and 2016 the COE of biogas plant is found increased and it is relatively high in
year 2016(12.64 Rs/kWh), as compare to solar PV in year 2016 (10.21 Rs/kWh). The size of solar system with
number of battery and number PV module required as per connected load of five villages is given in Table 4.
Table 4 Details of battery and module Source used for electricity COE(Rs/kWh) in year 2007 COE(Rs/kWh) in year 2012
COE(Rs/kWh) in
year 2016
Subsidy No
subsidy
Subsidy No
subsidy
Subsidy No
subsidy
DG
11.93 11.93 18.14 18.14 22.08 22.08
Solar
16.05 48.15 14.71 44.13 10.21 30.64
70%biogs
30%diesl
5.54 6.41 9.63 12.15 15.44 21.14
85%biogs
15%diesl 4.04 4.91 7.33 9.33 12.64 18.37
Name of
village Load (kW)
Battery (200Ah)
391 |
P a g e
V. CONCLUSIONS
The paper presents the approximate financial and technical requirements for the remote area electrification
where grid extension is not possible. Due to these available solar and biogas renewable energy source sat site are
selected for such isolated areas for electrification. It seems availability of solar radiation at remote location and
the dung availability at villages are sufficient to produce electricity according to connected load of all five
villages. The cost of energy obtained for solar and biogas in comparison with diesel shows the economically
feasible option for rural electrification. The study shows in year 2016 the solar is the economically best options
for rural electrification over diesel and biogas hence based on the calculations solar system size for five villages
is also presented.
REFERENCES
[1] https://en.m.wikipedia.org/wiki/Electricity_sector_in_India
[2] https://en.m.wikipedia.org/wiki/List_of_countries_by_electricity_consumption
[3] https://en.m.wikipedia.org/wiki/List_of_countries_by_population_(United_Nations)
[4] Chetan Singh solanki a book on Solar photovoltaic technology and systems 2014
[5] Anil Kumar Sahu, Dr. Arun M. Shandilya and Dr. S. K. Bhardwaj, “Rural Electrification: Issues and
Challenges of Sustainable Development .” in International Journal of Emerging Technology and Advanced
Engineering (ISSN 2250-2459, ISO 9001:2008 Certified Journal, Volume 4, Issue 8, August 2012
[6] S.K. Singal, Varun, R.P. Singh “Rural electrification of a remote island by renewable energy sources.”