Tomasz A. Szczepański, Artur Weiser, Wojciech L. Zub,
Włodzimierz Jarmundowicz, Marta Koźba-Gosztyła, Bogdan Czapiga
Assessment of Cerebral Blood Flow During Infusion Test
in the Diagnosis of Normal Pressure Hydrocephalus
Ocena mózgowego przepływu krwi podczas testu infuzyjnego
w diagnostyce wodogłowia normotensyjnego
Department of Neurosurgery, Wroclaw Medical University, Wroclaw, Poland
Abstract
Background. Many studies indicate that the increase in intracranial pressure (ICP) leads to cerebral blood flow velocity (CBFV) changes. This relationship was accurately determined in patients with traumatic brain injury.
Objectives. The aim of this study was to determine how the changes in intracranial pressure induced during an infusion test influence cerebral blood flow.
Material and Methods. 40 patients with enlarged ventricular systems (Evan’s ratio > 30%) who underwent a diagnostic lumbar infusion test (LIT) were included. Tests were performed at the Department of Neurosurgery, Wroclaw Medical University. CBFV in the middle cerebral artery was measured using transcranial Doppler (TCD) simultaneously during the standard lumbar infusion test. TCD measurements were continued with simultaneous recording of CSF pressure with a frequency of 100Hz. A total number of 5800 measurements (10-second periods) performed during the three phases of the infusion test (stable, infusion and decrease) was obtained.
Results. In the stable phase of LIT, a weak positive correlation between ICP and mean CBFV (R = 0.193, p < 0.01) was observed. There was no statistically significant correlation between ICP and the pulsatility index (PI, Gosling Index). During the increased-ICP phase of LIT (infusion, decrease), we observed significant changes in CBFV expressed by a decrease of diastolic velocity and an increase of systolic velocity. A simultaneous increase of pulsa-tion correlated with an increase in ICP (R = 0.371, p < 0.01). There were no significant changes in mean CBFV.
Conclusions. In patients with ventriculomegaly, the mean cerebral blood flow is maintained despite a significant increase in ICP, within the limits of the infusion test. It is noted the relative increase of the pulsatility indices of CBF may indicate preserved cerebrovascular reactivity (Adv Clin Exp Med 2012, 21, 1, 55–61).
Key words: normal pressure hydrocephalus, cerebral blood flow, transcranial Doppler.
Streszczenie
Wprowadzenie. Obserwacja kliniczna potwierdzona badaniami wskazuje, że w przypadku wzrostu ciśnienia wewnątrzczaszkowego dochodzi również do zmian mózgowego przepływu krwi. Zjawiska te zostały szczegóło-wo zbadane u chorych po ciężkich urazach czaszkoszczegóło-wo-mózgowych. Istnieje uzasadnione podejrzenie, że zmiany mózgowego przepływu krwi mogą występować również podczas indukowanego nadciśnienia wewnątrzczaszkowe-go podczas testu infuzyjnewewnątrzczaszkowe-go w diagnostyce wodogłowia normotensyjnewewnątrzczaszkowe-go.
Cel pracy. Określenie, w jaki sposób zmiany ciśnienia wewnątrzczaszkowego (ICP), które występują w czasie wykonywania testu infuzyjnego, wpływają na mózgowy przepływ krwi.
Materiał i metody. Badaniami objęto 40 pacjentów z poszerzonym układem komorowym, u których wykonano test infuzyjny podczas diagnostyki wodogłowia normotensyjnego. Badania prowadzono w Klinice Neurochirurgii Akademii Medycznej we Wrocławiu. Podczas standardowej procedury testu infuzyjnego lędźwiowego monito-rowano prędkość przepływu krwi w tętnicy środkowej mózgu z użyciem ultrasonografii przezczaszkowej (TCD). Zapis TCD odbywał się w sposób ciągły z częstotliwością 100 Hz i był rejestrowany symultanicznie z zapisem ciśnienia płynu mózgowo-rdzeniowego (PMR) w kanale kręgowym. Analizę przeprowadzono we wszystkich trzech okresach testu infuzyjnego, tj. spoczynek, infuzja i swobodny spadek ciśnienia.
Wyniki. W badanej grupie pacjentów w początkowym, stabilnym okresie testu infuzyjnego wykazano słabą pozy-tywną korelację między ICP a średnią prędkością przepływu krwi (R = 0,193). W tym okresie nie było istotnej korelacji ICP z pulsacją przepływu oznaczaną z użyciem współczynnika PI (Gosling Pulsatility Index). Podczas
Adv Clin Exp Med 2012, 21, 1, 55–61 ISSN 1899-5276
ORIGINAL PAPERS
T.A. Szczepański et al.
56
Transcranial Doppler (TCD) is a completely non-invasive method of testing cerebral blood flow velocity, is easy to use and allows for con-tinuous monitoring in high resolution. The listed advantages make it a basic diagnostic tool used for measurements of cerebral blood flow [1]. Tests em-ploying TCD are used in patients with various in-tracranial pathologies. One large group tested with TCD is patients who have suffered subarachnoid hemorrhages from a ruptured aneurysm [2, 3]. Other groups are patients with intracranial hem-orrhage [4, 5], idiopathic intracranial hyperten-sion [6] and active hydrocephalus [7]. Moreover, many of the authors analyze blood flow veloc-ity changes in patients following severe traumatic brain injuries [8–11] in whom determining blood flow velocity is one of the obligatorily monitored parameters [12].
A strong correlation between changes in the cerebral blood flow velocity in the middle cere-bral artery and cerecere-bral blood flow (CBF) has been proven experimentally in animal models [13, 14]. A positive correlation was also confirmed in healthy individuals [15, 16]. It is therefore assumed that changes of blood flow velocity measured with TCD mirror changes of CBF [17–19].
In 1988, Giulioni et al. analyzed the literature about intracranial hemodynamics [20]. They in-dicate that cerebral blood flow shows significant changes with a large increase in ICP (above 60 mm Hg). As later studies showed, the results from 1988 were not confirmed.
The aim of the present study was to determine how the changes in intracranial pressure affect ce-rebral blood flow during an infusion test.
Material and Methods
The study included 40 patients, hospitalized in the Department of Neurosurgery of Wro-claw Medical University, in whom an infusion test with simultaneous recording of blood flow velocity in the middle cerebral artery was done due to suspected normal pressure hydrocephalus (NPH). The purpose of hospitalizing the patients in this department was to carry out
diagnos-tic tests for NPH and to identify indications for surgical treatment (implantation of a ventriculo-peritoneal shunt).
The age of the patients was from 20 to 88 years (61 ± 16.02 years). The study group included 14 wo- men from 20 to 88 years old (58 ± 20.13 years) and 26 men from 26 to 83 years old (63 ± 13.38 years). In the study group, an enlargement of the ven-tricular system was evaluated on the basis of CT or MRI. The value of the Evans ratio was between 0.30 and 0.66 (0.41 ± 0.073). In the radiological images there were no signs of acute hydrocepha-lus. Another inclusion criterion was the presence of Hakim’s triad or incomplete Hakim’s triad with a history of coexistent symptoms of elevated in-tracranial pressure like headaches, visual distur-bances and papilledema.
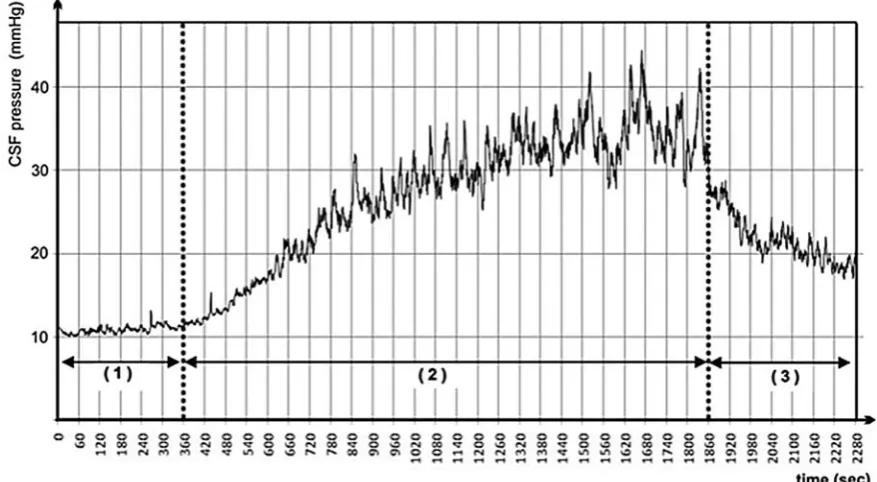
During the infusion test, isotonic fluid was administered into the subarachnoid space of the spinal canal via lumbar puncture. During this test, intracranial pressure (ICP) increases until it reaches a plateau state. ICP measurement was also done via lumbar puncture because ICP can also be determined in the spinal canal when the path of cerebro-spinal fluid (CSF) circulation is main-tained [21]. A lumbar infusion test with fluid sup-ply fixed at 2 ml/min with the use of a volumetric infusion pump was carried out in all patients. The protocol we use is commonly used in many centers [22–24]. During a strictly monitored pressure ele-vation, the value of ICP was between 5 and 50 mm Hg. The testing procedure consisted of three ba-sic periods. The first one is a ca. 10-minute-long measurement while stable, during which natural fluctuations of CSF and blood flow velocity were recorded. The second period is the beginning of the infusion with an induced increase of ICP value. The infusion of fluid was carried out until a new state of balance (plateau phase) was determined or until ICP reached 40 mm Hg (for over 60 s), which is regarded as the safety limit and requires the infusion to be interrupted. The third period is the time of free decrease in CSF pressure after the infusion (Fig. 1).
In the present study, the authors included Transcranial Doppler examination of blood flow velocity in the middle cerebral artery with a
DOP-indukowanych zmian ciśnienia w okresach infuzji oraz swobodnego spadku zmiana zapisu prędkości przepływu wyrażała się spadkiem końcowo rozkurczowej prędkości oraz wzrostem prędkości skurczowej. Jednoczesny wzrost pulsacji przepływu dodatnio korelował ze zmianą ICP (R = 0,371). Nie wykazano istotnych zmian średniej pręd-kości przepływu krwi.
Wnioski. W grupie pacjentów z poszerzonym układem komorowym średni przepływ mózgowy krwi jest stały pomimo istotnego wzrostu ciśnienia PMR w granicach wyznaczonych przez test infuzyjny. Stwierdza się natomiast względny wzrost pulsacji i współczynników oporowych przepływu mózgowego, co może świadczyć o zachowanej reaktywności naczyń mózgowych (Adv Clin Exp Med 2012, 21, 1, 55–61).
PLER BOX device. A 2 MHz Doppler probe was fastened in the temporal region with a special hel-met. The TCD recording was constant and simul-taneous with the recording of CSF pressure in the spinal canal at a frequency of 100 Hz. The follow-ing analyzed values described blood flow velocity: Vps (peak systolic velocity, cm/s), Vmean (mean velocity, cm/s), Ved (end diastolic velocity, cm/s) and AMP value (amplitude, the difference between systolic and diastolic velocity, cm/s). Blood flow pulsatility was described with a PI index (Gosling’s pulsatility index, calculated as:
[Vps – Ved]/Vmean).
10-second periods (one measurement) were used for analysis. The value of a single measure-ment was calculated by determining the median of 10 1-second segments for all the variables tested. The measurements were gathered in a Mi-crosoft Excel file according to a homogenous
scheme. This way, 5800 measurements were ob-tained (Table 1).
The study received approval on Dec. 5, 2009 from the Bioethics Committee of Wroclaw Medi-cal University (KB–346/2009).
Statistical Analysis
Further statistical analysis was carried out with the Statistica 9.0PL package. The significance level (α) assumed was 0.05. The choice of an ap-propriate method depended on the statistical fea-tures of data analyzed and on the fulfillment of the assumptions of the statistical test chosen for veri-fying the study hypothesis. Mean values, median, maximum and minimum, and standard devia-tion (SD) were determined. Friedman’s ANOVA analysis and Kendall’s coefficient of concordance, as well as Kruskal-Wallis ANOVA on ranks and multiple comparisons of mean ranks for all tests were used for statistical evaluation.
Fig. 1. Continuous recording of sample infusion test with marked investigated periods: 1 – stable, 2 – infusion, and 3 – decrease
Ryc. 1. Zapis ciągły przykładowego testu infuzyjnego z oznaczonymi okresami 1 – spoczynek, 2 – infuzja, 3 – spadek
Table 1. Average number of measurements taken per patient by period: 1 – stable, 2 – infusion, and 3 – decrease (n = 40)
Tabela 1. Średnia liczba pomiarów wykonanych u jednego pacjenta z podziałem na okresy spoczynku, infuzji oraz spadku (n = 40)
Number
(Liczba) Period 1 – stable (Okres 1 – spoczynku) Period 2 – infusion (Okres 2 – infuzji) Period 3 – decrease (Okres 3 – spadku) Total (Suma) Mean ± SD
T.A. Szczepański et al.
58
Results
An analysis of 5800 measurements was carried out separately for every period of the infusion test, i.e. period 1 – stable, period 2 – infusion, and pe-riod 3 – decrease.
In the stable period, in which a fluctuation of normal ICP values was observed, a very poor posi-tive correlation only was found between ICP and Vmean (R = 0.193). No correlations were shown in this period between changes in ICP and changes in the flow pulsation expressed by PI changes.
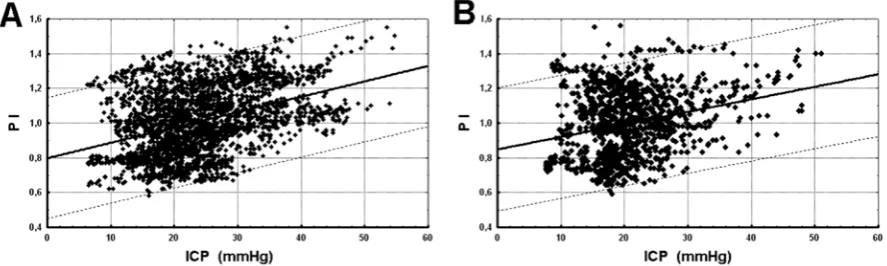
During artificially induced ICP changes (i.e. infusion and decrease periods), increased flow pulsatility was observed. A positive correlation of ICP and PI changes were observed during in-fusion (R = 0.369) and in the decrease period (R = 0.242). A positive correlation between ICP and PI variables was confirmed by an separate analysis for each patient (the mean correlation coefficient during the infusion period was 0.666 while in the decrease period it was 0.528). Contrary to the sta-ble period, the period of induced changes showed no significant correlation of changes in ICP and Vmean (Fig. 2).
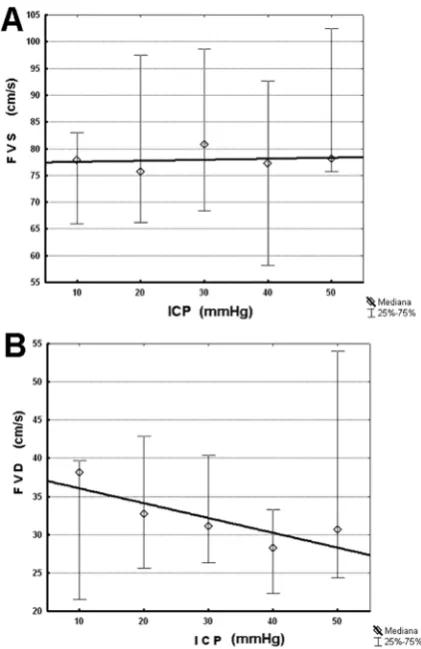
For a more thorough analysis of flow pulsatil-ity changes, the values of CSF pressure from the entire study group were divided into 5 sections ev-ery 10 mm Hg. The statistical analysis of Vps and Ved variables demonstrated that systolic flow ve-locity increases with the increase of ICP pressure (differences of means up to 5.5 cm/s). Moreover, the value of diastolic blood flow velocity decreases (differences of means up to 7.4 cm/s) (Fig. 3).
In the specified sections, we also carried out an analysis of Vmean changes. Statistical analysis did not demonstrate any differences between sec-tions 10-20-30. Differences at the level of 2.2 cm/s
in the 40 section are lower than the demonstrated natural Vmean fluctuations at rest (median = 5.95 ± 4.74), which proves that blood flow velocity at ICP up to 50 mm Hg shows no clinically signifi-cant differences (Fig. 4).
In summary, in patients with ventriculomega-ly, the mean cerebral blood flow is maintained de-spite a significant increase in ICP within the lim-its of the infusion test. A relative increase in the pulsatility indices of CBF was noted, which may indicate preserved cerebrovascular reactivity.
Discussion
Present study included a group of 40 patients (a total of 5800 measurements). In the available literature, there are results of studies regarding cerebral blood flow with the use of TCD during an infusion test in adults. Present study is the only one to include a description of all blood flow pa-rameters, i.e. Vps, Vmean, Ved and PI, while au-thors of other studies presented only the measure-ment results for FVM and PI. Moreover, available studies include smaller groups, i.e. from 8 patients in Behrens’ et al. study [24] to the maximum of 35 patients in Czosnyka’s et al. study [22].
The first report to use TCD during an infu-sion test can be found in the 2000 study of Schmidt et al. [26]. They did 19 lumbar infusion tests dur-ing diagnostic tests preceddur-ing the implantation of a ventriculo-peritoneal shunt. The study group included 9 patients with idiopathic normal pres-sure hydrocephalus and 10 patients with second-ary normal pressure hydrocephalus. On this small group of patients, they confirmed the usefulness of the developed mathematical model for calculating ICP in an non-invasive manner (based on
arte-Fig. 2. A graph of the correlation of PI and ICP during the period 2 – infusion (A) and during the period 3 – decrease (B). In both periods there is a positive correlation at the significance level of p < 0.01 (number of observations: A = 3130, B = 1298)
rial blood pressure and blood flow velocity in the middle cerebral artery). They did not describe the relations between values characterizing cerebral blood flow and intracranial pressure.
On a group of 10 patients, Jarus-Dziedzic et al. carried out an analysis of changes in the diastolic value of blood flow velocity and PI index in the consecutive minutes of the infusion test [23]. The analysis showed no significant relationship be-tween blood flow velocity and ICP. Researchers also observed no correlation between the value of absorption resistance rate and the change of blood flow velocity value assessed prior to the beginning of the infusion and at infusion peak. There is no description of the methodology of the analysis car-ried out, therefore the published results cannot be used as a reference. Based on available literature, it must be assumed that there are correlations be-tween the ICP and blood flow velocities that were not observed in the study group.
Haubrich et al. also proved no statistically significant analysis for FVM value and pulsatility changes presented as changes of the PI index [27]. They carried out a ventricular infusion test on a group of 20 patients 21–78 years (9 with NPH, 6 with NPH after a traumatic brain injury and 5 with idiopathic intracranial hypertension). It must be noted, though, that the group was not homog-enous and recording was not continuous, and only 5-minute fragments at rest and during the plateau stage were analyzed. In present study, continuous recording and the analysis of the entire infusion test, including the decrease stage, have concluded that PI correlates positively with ICP values.
The study of Zofia Czosnyka et al. published in 2002 was very interesting and reliable [22]. In the study group of 35 patients, they demonstrated a change in blood flow velocity in the middle ce-rebral artery during the infusion test. The observa-tion resulted in a decrease in the mean blood flow velocity by 4 cm/s, which did not correlate with CSF pressure. In present study, the authors achieved re-sults similar to those of Czosnyka et al. and the de-crease of the mean blood flow value was 2.2 cm/s. It must be noted, though, that this value is lower than the natural fluctuations of mean blood flow veloc-ity that we observed in the rest phase, which were 5.95 ± 4.74 cm/s. Therefore, it should be doubted whether the velocity decrease by 2.2 cm/s proven with statistical methods signifies a real decrease of flow velocity. During the test, there was a statisti-cally significant increase of the PI index which cor-related with the increase of ICP (r = 0.480; p < 0.01). This conclusion was confirmed in present observa-tions: there is no correlation between ICP and the PI index at rest. The author has also proven that, in the period of CSF pressure changes (infusion and
Fig. 3. Graphs of mean values and median quartile ranges for observations of ICP and FVS (A), ICP and FVD (B). Systolic flow velocity increases with the increase of ICP pressure and the value of diastolic blood flow velocity decreases
Ryc. 3. Wykresy median oraz rozstępu kwartylowego dla obserwacji w przedziałach ICP i FVS (A) oraz FVD (B). Wraz ze wzrostem ICP dochodzi do spadku pręd-kości końcowo rozkurczowej oraz w mniejszym stop-niu wzrostem prędkości skurczowej
Fig. 4. Comparison of mean values of FVM in the intervals of ICP. For values 10; 20; 30, the medians show no significance differences
T.A. Szczepański et al.
60
decrease phase), there is a correlation between ICP and IP (R = 0.369; p < 0.01).
The latest report regarding the PI index is a study published in June 2010 by Behrens et al. [27]. On 8 patients, they carried out a lumbar infu-sion test with ICP measurement, using an intersti-tial sensor. During the test, they did an infusion of fluid into the spinal canal to the maximum value of 50 mmHg. During infusion, several thresholds of CSF were maintained, when blood flow in the middle cerebral artery was measured for 30 to 90 seconds. A total of 35 measurements were gath-ered in a group of 8 patients. In connection with the demonstrated high diversity between the eight patients, simulations of ICP and IP were also car-ried out based on a mathematical model. The au-thors presented an analysis of the cerebral blood flow, vessel diameter and PI index, which was the basis for the conclusion that PI index is not a re-liable prognostic of intracranial pressure. In their opinion, PI changes are caused by changes of phys-iological parameters (arterial blood pressure and its amplitude, the state of autoregulation, susceptibili-ty of the middle cerebral artery and age). It must be noted, though, that Behrens et al. studied a group of only 8 patients, and TCD measurements were done only on the chosen ICP values in the range between
0 and 50 mmHg. Considering the above factors, we cannot exclude the possibility that the result of the study is falsely negative, which is emphasized by Mayer in his commentary to the article.
Based on present analysis of 5800 measure-ments in a group of 40 patients with an enlarged ventricular system and who are suspected of NPH, the author must confirm the proper functioning of vascular regulation mechanisms anticipated in the methodology of the infusion test. As a result of their effect during increased ICP, thanks to chang-es of rchang-esistance in the area of the vascular bed, the mean cerebral blood flow is unchanged. Increas-ing the value of flow pulsatility, should be inter-preted as a compensatory response related to the maintaining of cerebral blood flow after a decrease of perfusion pressure [28]. A PI change is caused by changes of intracranial pressure [29]. With few physiological changes of ICP, the mean blood flow velocity and the amplitude of flow velocity are congruent with changes of ICP. In the stable pe-riod, there were no statistically significant correla-tions of ICP with blood flow pulsatility (PI). The lack of changes of blood flow pulsatility in relation to ICP may signify a lack of active vascular auto-regulation, which may result from normal values of intracranial pressure.
References
[1] Markdus HS: Transcranial Doppler ultrasound. J Neurol Neurosurg Psychiatry 1999, 67(2), 135–137.
[2] Tseng MY, Czosnyka M, Richards H et al.: Effects of acute treatment with pravastatin on cerebral vasospasm, autoregulation, and delayed ischemic deficits after aneurysmal subarachnoid hemorrhage: a phase II randomized placebo-controlled trial. Stroke 2005, 36, 1627–1632.
[3] Soehle M, Chatfield DA, Czosnyka M et al.: Predictive value of initial clinical status, intracranial pressure and transcranial Doppler pulsatility after subarachnoid haemorrhage. Acta Neurochir (Wien) 2007, 149(6), 575–583.
[4] Reinhard M, Neunhoeffer F, Gerds TA et al.: Secondary decline of cerebral autoregulation is associated with worse outcome after intracerebral hemorrhage. Intensive Care Med 2010, 36, 264–271.
[5] Diedler J, Sykora M, Rupp A et al.: Impaired cerebral vasomotor activity in spontaneous intracerebral hemor-rhage. Stroke 2009, 40, 815–819.
[6] Hunter G, Voll C, Rajput M: Utility of transcranial Doppler in idiopathic intracranial hypertension. Can J Neurol Sci 2010, 37(2), 235–239.
[7] Rainov NG, Weise JB, Winfried B: Transcranial Doppler sonography in adult hydrocephalic patients. Neurosurg Rev 2000, 23, 34–38.
[8] Schmidt B, Czosnyka M, Raabe A et al.: Adaptive Noninvasive Assessment of Intracranial Pressure and Cerebral Autoregulation. Stroke 2003, 34, 84–89.
[9] Lavinio A, Rasulo FA, De Peri E et al.: The relationship between the intracranial pressure–volume index and cerebral autoregulation. Intensive Care Med 2008.
[10] Zweifel Ch, Lavinio A, Steiner LA et al.: Continuous monitoring of cerebrovascular pressure reactivity in patients with head injury. Neurosurg Focus 2008, 25(10), 1–8.
[11] Schmidt B, Klingelhofer J, Perkes I et al.: Cerebral Autoregulatory Response Depends on the Direction of Change in Perfusion Pressure. J Neurotrauma 2009, 26, 1–6.
[12] Rasulo FA, De Peri E, Lavinio A: Transcranial Doppler ultrasonography in intensive care. Eur J Anaesth 2008, 25(Suppl 42), 167–173.
[13] Barzo P, Doczi T, Csete K et al.: Measurements of regional cerebral blood flow velocity in experimental intracra-nial hypertension infusion via the cisterna magna in rabbits. Neurosurgery 1991, 28, 821–825.
[14] Richards UK, Czosnyka M, Kirkpatrick P et al.: Estimation of laser Doppler flux biological zero using basilar artery flow velocity in rabbit. Am J Physiol 1995, 268, H212–H217.
[16] Romner B, Brand L, Berntman L et al.: Simultaneous transcranial Doppler sonography and cerebral blood flow measurements of cerebrovascular CO2-reactivity in patients with aneurismal subarachnoid hemorrhage. Br J Neurosurg 1991, 5, 31.
[17] Aaslid R, Newell DW, Stooss R et al.: Assessment of cerebral autoregulation dynamics from simultaneous arterial and venous transcranial Doppler recordings in humans. Stroke 1991, 22, 1148–1154.
[18] Newell DW, Aaslid R, Lam AM et al.: Comparison of flow and velocity during dynamic autoregulation testing in humans. Stroke 1994, 25, 793–797.
[19] Newell DW, Aaslid R, Stooss R et al.: Evaluation of hemodynamic responses in head injury patients with tran-scranial Doppler monitoring. Acta Neurochir 1997, 139, 804–817.
[20] Giulioni M, Ursino M, Alvisi C et al.: Correlations among intracranial pulsatility, intracranial hemodynamics, and transcranial Doppler wave form: literature review and hypothesis for future studies. Neurosurgery 1988, 22(5), 807–812.
[21] Lenfeldt N, Koskinen LO, Bergenheim AT et al.: CSF pressure assessed by lumbar puncture agrees with intrac-ranial pressure. Neurology 2007, 68(2), 155–158.
[22] Czosnyka Z, Czosnyka M, Whitfield P et al.: Cerebral autoregulation among patients with symptoms of hydro-cephalus. Neurosurgery 2002, 50, 526–533.
[23] Jarus-Dziedzic K, Jurkiewicz J, Czernicki Z et al.: Przezczaszkowa ultrasonografia dopplerowska (TCD) u cho-rych z poszerzonym układem komorowym – poszukiwanie dodatkowych wskaźników kwalifikacji do zabiegu implantacji układu zastawkowego. Pol J Radiol 2005, 70(1), 27–34.
[24] Śliwka S, Pawłowski G, Korsak-Śliwka J et al.: Skomputeryzowany test infuzyjny. I. Metoda. Neurol Neurochir Pol 1984, 18 (34), 533–560.
[25] Behrens A, Lenfeldt N, Ambarki K et al.: Transcranial Doppler pulsatility index: not an accurate method to assess intracranial pressure. Neurosurgery 2010, 66, 1050–1057.
[26] Schmidt B, Czosnyka M, Schwarze JJ et al.: Evaluation of method for noninvasive intracranial pressure assess-ment during infusion studies in patients with hydrocephalus. J Neurosurg 2000, 92, 793–800.
[27] Haubrich Ch, Czosnyka Z, Lavinio A et al.: Is There a Direct Link Between Cerebrovascular Activity and Cerebrospinal Fluid Pressure-Volume Compensation? Stroke 2007, 38, 2677–2680.
[28] Rudziński W, Swiat M, Tomaszewski M, Krejza J: Cerebral hemodynamics and investigations of cerebral blood flow regulation. Nucl Med Rev Cent East Eur 2007, 10(1), 29–42.
[29] Ursino M, Giulioni M, Lodi CA: Relationships among cerebral perfusion pressure, auto-regulation, and transcra-nial Doppler waveform: a modeling study. J Neurosurg 1998, 89, 255–266.
Address for correspondence:
Tomasz A. Szczepański Department of Neurosurgery Wroclaw Medical University Borowska 213
50-556 Wrocław Poland
E-mail: [email protected]
Conflict of interest: None declared